Strategy vault / Trend following
Dual Moving Average Trend Tracking Strategy
The Dual Moving Average Trend Tracking strategy is a strategy that uses a combination of fast and slow moving averages to determine market trend, and generates trading signals when the trend direction changes. It…
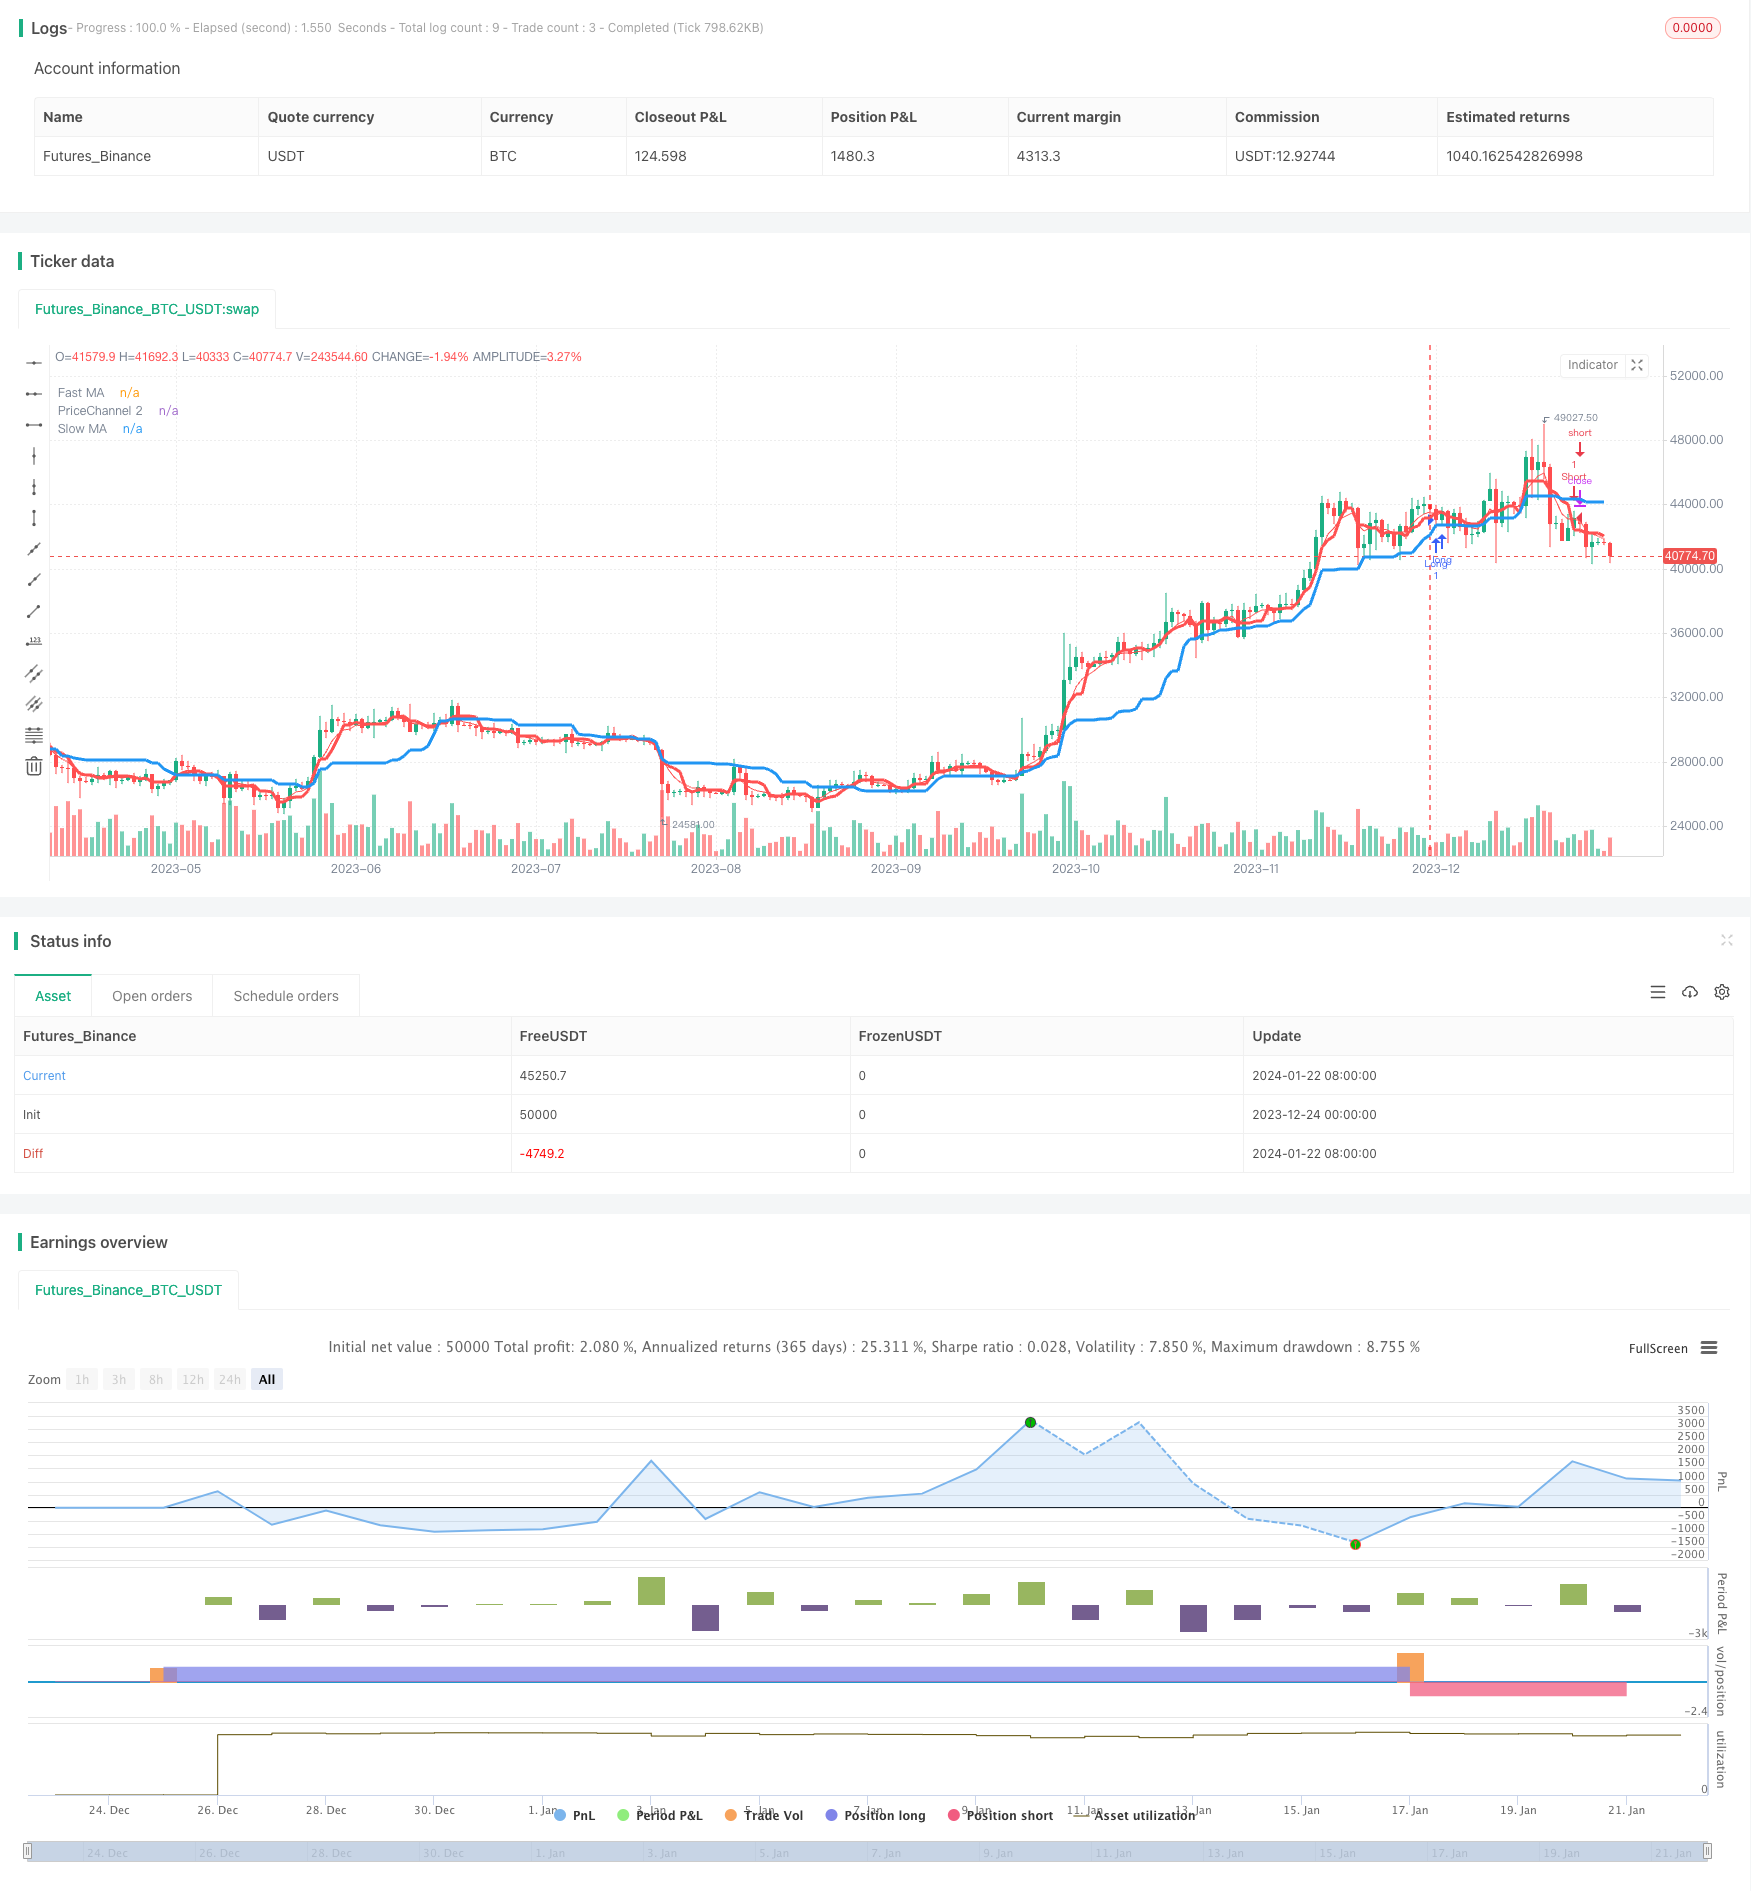
Overview
The Dual Moving Average Trend Tracking strategy is a strategy that uses a combination of fast and slow moving averages to determine market trend, and generates trading signals when the trend direction changes. It combines moving average indicators and price channel indicators to identify the trend, which can effectively filter out market noise and determine the trend direction.
Strategy Logic
The Dual Moving Average Trend Tracking strategy uses two moving averages - a fast moving average (5 periods) and a slow moving average (21 periods). The fast MA is used to generate trading signals while the slow MA is used to determine the market trend direction. When the fast MA crosses above the slow MA, a buy signal is generated. When the fast MA crosses below the slow MA, a sell signal is generated.
The strategy also uses a price channel indicator to assist in determining the trend. The price channel is determined by the moving averages of highest and lowest prices. When prices break through the channel, it indicates a trend reversal. This strategy uses two price channels with periods of 21 and 5 respectively, matching the MA periods.
When determining buy and sell signals, the strategy requires consecutive red/green candles to appear (user adjustable) as an additional filter condition. This helps avoid wrong signals during market consolidations.
In summary, the logic for determining trend in this strategy is:
- Use price channel to determine the higher timeframe trend direction
- Use fast MA to determine short-term trend and generate trading signals
- Combine additional candle filter to avoid wrong signals during consolidations
By judging trend across timeframes, market noise can be effectively filtered and trend direction confirmed.
Advantage Analysis
The Dual Moving Average Trend Tracking Strategy has the following advantages:
- The dual MA system can effectively identify trends and determine the major trend direction
- The fast MA generates trading signals to timely capture trend reversals
- The price channel determines higher timeframe trend to avoid being misled by short-term market noise
- The red/green candle filters lower the probability of wrong signals during consolidations
- Adjustable parameters allow optimization for different markets to improve robustness
- Stop loss strategies can be added to effectively control risk per trade
In conclusion, this strategy has relatively good overall stability and performs well in strong trending markets.
Risk Analysis
The Dual Moving Average Trend Tracking Strategy also has some risks, mainly:
- During prolonged consolidations, it is prone to generating wrong signals and consecutive small losses
- Improper parameter settings may lag trading signals and miss best entry opportunities
- Without effective stop loss, per trade risk is difficult to control
Corresponding measures to reduce risks include:
- Adjust red/green candle filter settings to lower trade frequency in consolidating markets
- Optimize fast MA parameters to ensure timely trading signal generation
- Add moving or percentage stop loss to strictly control per trade loss
Optimization Directions
There is room for further optimization of the strategy, mainly in directions like:
- Incorporate volatility indicators like ATR to auto adjust stop loss
- Utilize machine learning to auto optimize parameters
- Add neural network modules to determine trend direction
- Build ensemble systems combining multiple indicators and filters
These optimization directions can further improve the stability, adaptiveness and intelligence level of the strategy.
Conclusion
In conclusion, the Dual Moving Average Trend Tracking strategy is a relatively robust trend following strategy. It combines moving averages and price channels to determine trend direction and strength, generating trading signals with the fast MA. The additional candle filters also help avoid wrong signals. The adjustable parameters allow adaptation to different market environments. There is also ample room for further optimizations to build a reliable, intelligent automated trading strategy.
Parameters
| Name | Default | What it controls |
|---|---|---|
| v_input_1 | true | long |
| v_input_2 | true | short |
| v_input_3 | false | stops |
| v_input_4 | 5 | Stop, % |
| v_input_5 | false | Use OHLC4 |
| v_input_6 | true | Use fast MA Filter |
| v_input_7 | 5 | fast MA Period |
| v_input_8 | 21 | slow MA Period |
| v_input_9 | 2 | Bars Q |
| v_input_10 | false | Need trend Background? |
| v_input_11 | false | Need entry arrows? |
Source Pine Script
/*backtest
start: 2023-12-24 00:00:00
end: 2024-01-23 00:00:00
period: 1d
basePeriod: 1h
exchanges: [{"eid":"Futures_Binance","currency":"BTC_USDT"}]
*/

//@version=2
strategy(title = "Noro's Trend MAs Strategy v1.8", shorttitle = "Trend MAs str 1.8", overlay=true, default_qty_type = strategy.percent_of_equity, default_qty_value=100.0, pyramiding=0)

//Settings
needlong = input(true, "long")
needshort = input(true, "short")
needstops = input(false, "stops")
stoppercent = input(5, defval = 5, minval = 1, maxval = 50, title = "Stop, %")
useohlc4 = input(false, defval = false, title = "Use OHLC4")
usefastsma = input(true, "Use fast MA Filter")
fastlen = input(5, defval = 5, minval = 1, maxval = 50, title = "fast MA Period")
slowlen = input(21, defval = 20, minval = 2, maxval = 200, title = "slow MA Period")
bars = input(2, defval = 2, minval = 0, maxval = 3, title = "Bars Q")
needbg = input(false, defval = false, title = "Need trend Background?")
needarr = input(false, defval = false, title = "Need entry arrows?")

src = useohlc4 == true ? ohlc4 : close
fastsma = ema(src, 5)

//PriceChannel 1
lasthigh = highest(src, slowlen)
lastlow = lowest(src, slowlen)
center = (lasthigh + lastlow) / 2

//PriceChannel 2
lasthigh2 = highest(src, fastlen)
lastlow2 = lowest(src, fastlen)
center2 = (lasthigh2 + lastlow2) / 2

//Trend
//ma = type == 1 ? sma(src, len) : type == 2 ? ema(src, len) : type == 3 ? vwma(src, len) : type == 4 ? dema : type == 5 ? tema : type == 6 ? kama : type == 7 ? center : 0
//trend = low > ma and low[1] > ma[1] and low[2] > ma[2] ? 1 : high < ma and high[1] < ma[1] ? -1 : trend[1]

trend1 = low > center and low[1] > center[1] ? 1 : high < center and high[1] < center[1] ? -1 : trend1[1]
trend2 = low > center2 and low[1] > center2[1] ? 1 : high < center2 and high[1] < center2[1] ? -1 : trend1[1]
trend = trend1 == 1 and trend2 == 1 ? 1 : trend2 == -1 and trend2 == -1 ? -1 : trend[1]

//Bars
bar = close > open ? 1 : close < open ? -1 : 0
redbars = bars == 0 ? 1 : bars == 1 and bar == -1 ? 1 : bars == 2 and bar == -1 and bar[1] == -1 ? 1 : bars == 3 and bar == -1 and bar[1] == -1 and bar[2] == -1 ? 1 : 0
greenbars = bars == 0 ? 1 : bars == 1 and bar == 1 ? 1 : bars == 2 and bar == 1 and bar[1] == 1 ? 1 : bars == 3 and bar == 1 and bar[1] == 1 and bar[2] == 1 ? 1 : 0

//Signals
up = trend == 1 and (low < center2 or usefastsma == false) and (redbars == 1) ? 1 : 0
dn = trend == -1 and (high > center2 or usefastsma == false) and (greenbars == 1) ? 1 : 0

//Lines
colorfastsma = usefastsma == true ? red : na
plot(fastsma, color = colorfastsma, title = "Fast MA")
plot(center, color = blue, linewidth = 3, transp = 0, title = "Slow MA")
plot(center2, color = red, linewidth = 3, transp = 0, title = "PriceChannel 2")

//Arrows
plotarrow(up == 1 and needarr == true ? 1 : 0, colorup = black, colordown = black, transp = 0)
plotarrow(dn == 1 and needarr == true ? -1 : 0, colorup = black, colordown = black, transp = 0)

//Background
col = needbg == false ? na : trend == 1 ? lime : red
bgcolor(col, transp = 90)

//Alerts
alertcondition(up == 1, title='buy', message='Uptrend')
alertcondition(dn == 1, title='sell', message='Downtrend')

//Trading
stoplong = up == 1 and needstops == true ? close - (close / 100 * stoppercent) : stoplong[1]
stopshort = dn == 1 and needstops == true ? close + (close / 100 * stoppercent) : stopshort[1]

longCondition = up == 1
if (longCondition)
    strategy.entry("Long", strategy.long, needlong == false ? 0 : na)
    strategy.exit("Stop Long", "Long", stop = stoplong)

shortCondition = dn == 1
if (shortCondition)
    strategy.entry("Short", strategy.short, needshort == false ? 0 : na)
strategy.exit("Stop Short", "Short", stop = stopshort)Published by ChaoZhang on the FMZ strategy square · last modified 2024-01-24. Collected in the Quant Trading Vault. Unvalidated research: re-test with your own data and costs before trusting it.
Build this with AgenKit
A spec is not a trading system. Paste this into your coding agent and AgenKit runs a specialist team — architecture, test-first build, risk gates, review — with paper trading on by default.
/agenkit build a production-grade trading bot with a backtest engine, risk controls and paper trading by default from strategies/Dual-Moving-Average-Trend-Tracking-Strategy.md- npx agenkit install engineering-kit in your project
- Paste the command into your agent and approve each phase
- Get tests, backtest, risk controls and a paper-trading switch
Understand it first
Before you run this, read the lesson behind the idea and how to backtest it honestly. Specs like this one are the survivors of an unknown number of trials; deflate their results accordingly.
Related specs
- ADX MA and EMA Long Only Trend Tracking StrategyPine Script · Trend following · 1d
- ATR and Moving Average Crossover Hybrid StrategyPine Script · Trend following · 1h
- Bollinger Band Moving Average Crossover StrategyPine Script · Trend following · 1h
- Bollinger Bands and EMA Trend Following StrategyPine Script · Trend following · 1h
- Bollinger Bands and RSI Trend Following StrategyPine Script · Trend following · 1h
- Candlestick Pattern Trend Filter StrategyPine Script · Trend following · 1d