Dual Moving Average With Momentum Breakout Strategy
This strategy uses the golden cross of 12-day EMA and 26-day EMA as the entry signal. To filter false breakouts, MACD is applied to judge market trend and RSI for overbought/oversold levels. Price breakout above…
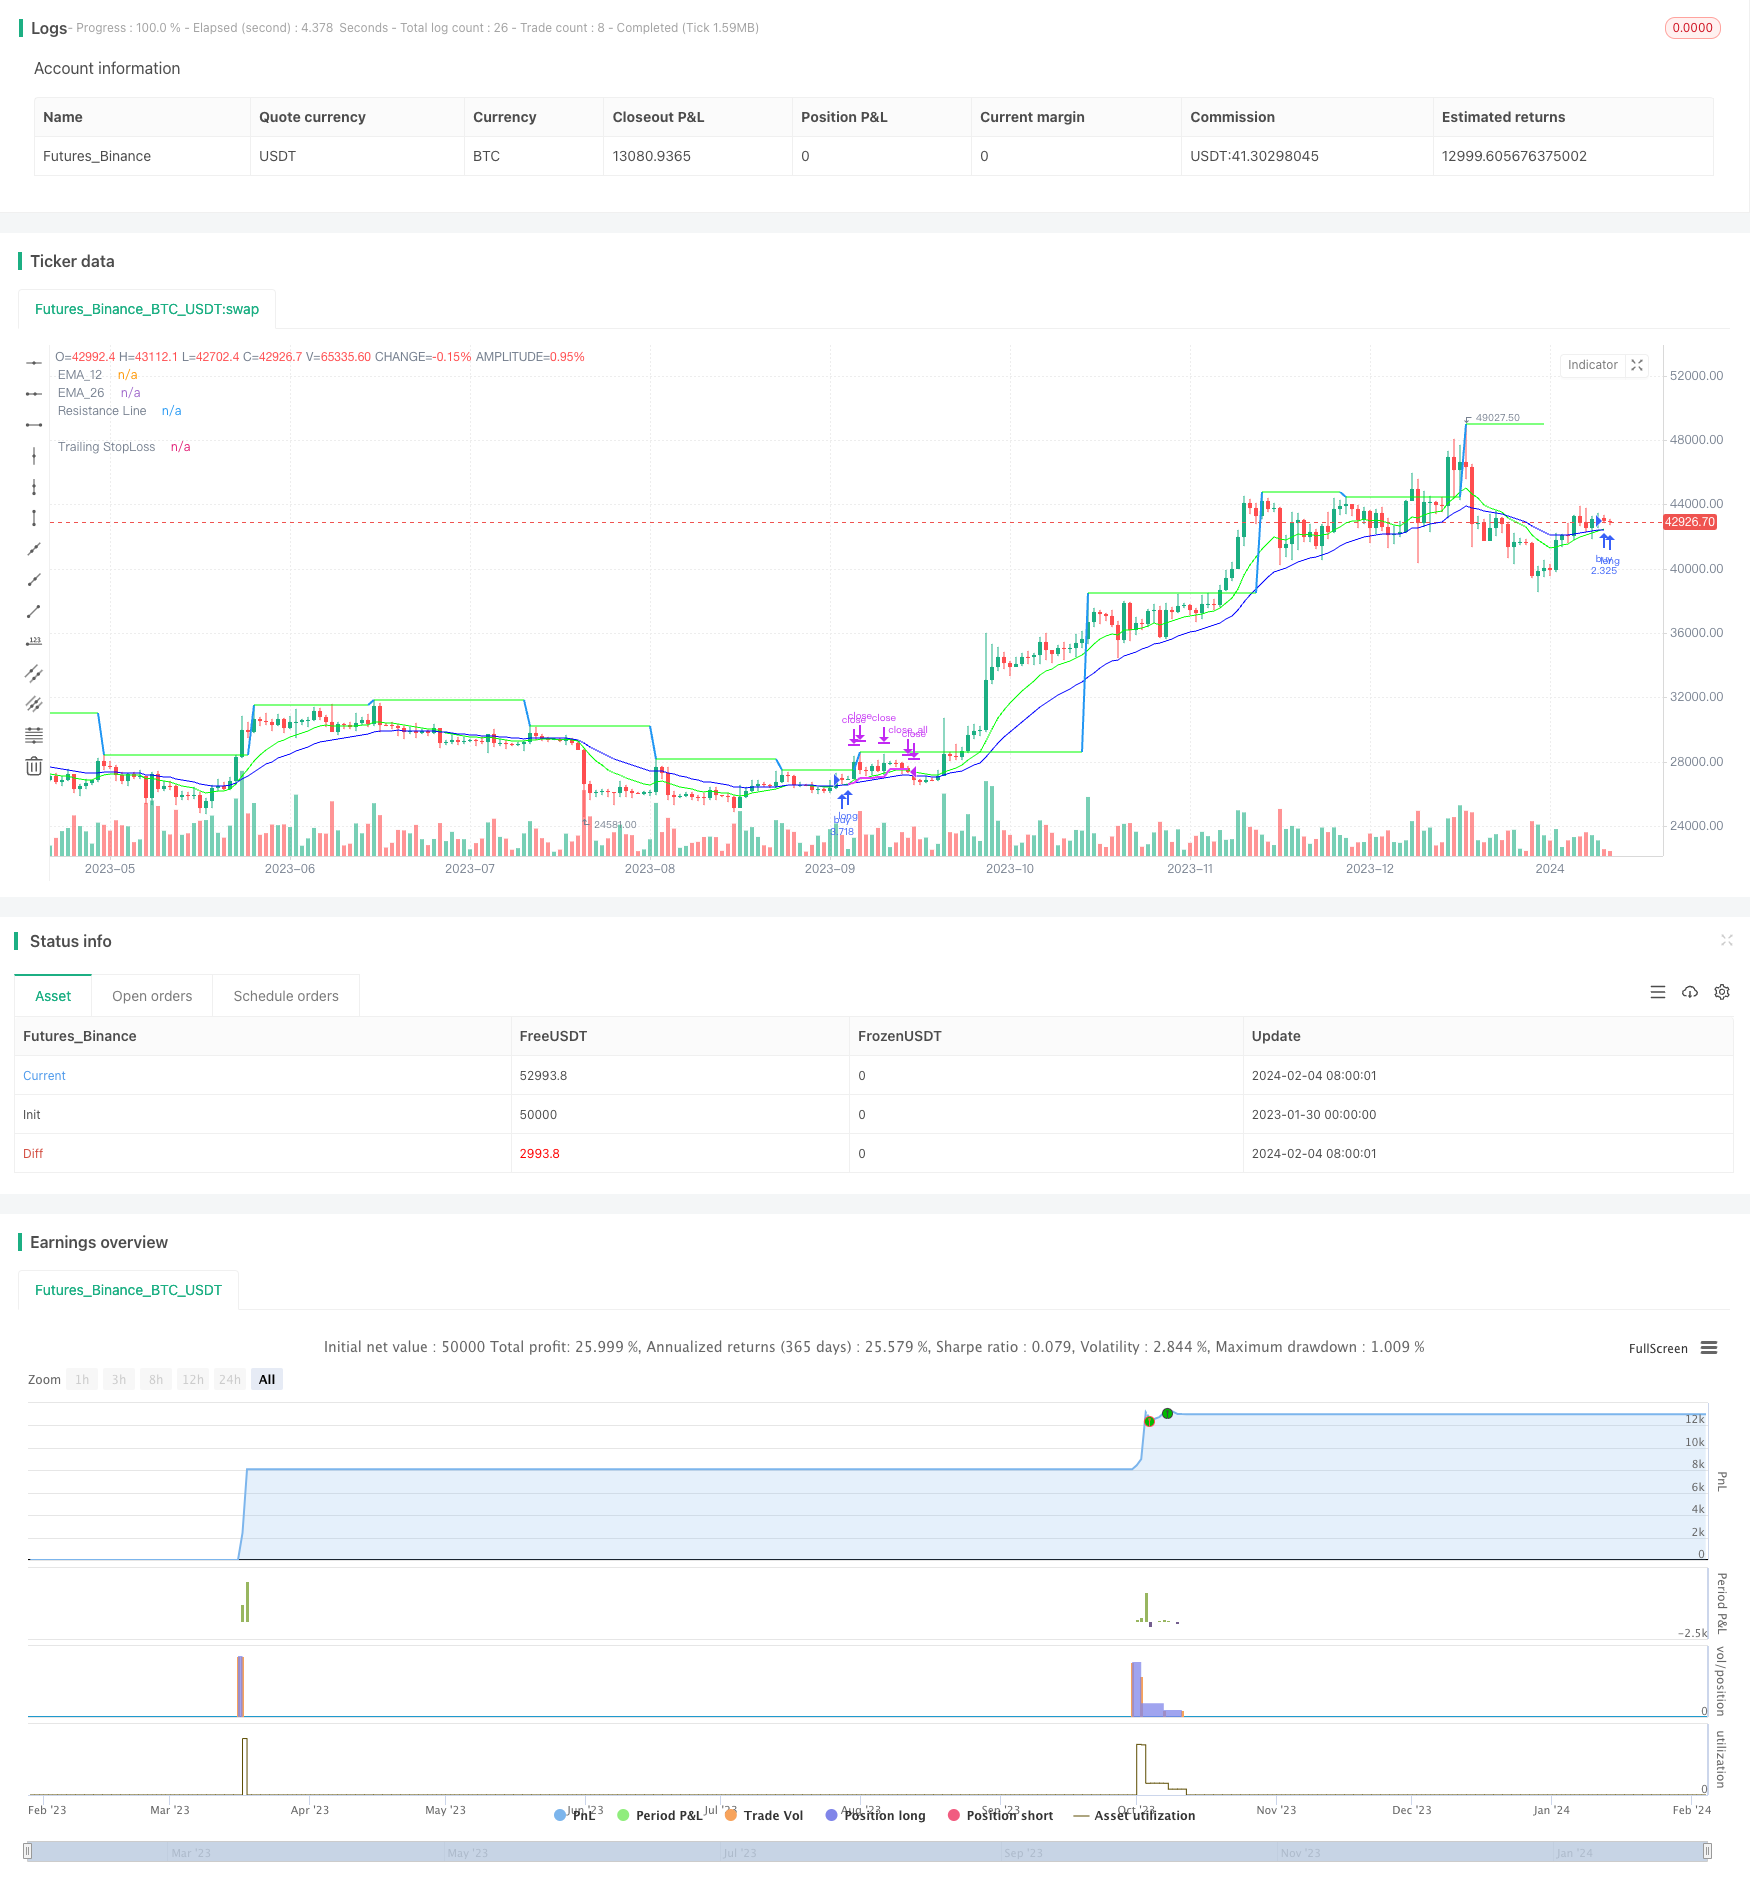
Overview
This strategy uses the golden cross of 12-day EMA and 26-day EMA as the entry signal. To filter false breakouts, MACD is applied to judge market trend and RSI for overbought/oversold levels. Price breakout above resistance is also used as confirmation.
The strategy provides three optional stop loss methods: trailing stop loss, moving average stop and moving average crossover stop. Two take profit targets are set.
Strategy Logic
- Entry Signal
- Golden cross between 12-day EMA and 26-day EMA
- MACD is positive and MACD line above Signal line
- RSI within preset range
- Entry Confirmation
- Optional: Price breakout above dynamic resistance
- Stop Loss
- Trailing stop loss based on entry price and preset percentage
- Close below 7-day SMA
- Bearish cross between 12-day and 26-day EMA
- Take Profit
- Two staged take profit targets, exit partial position on first target and all on second
Advantages
- MA system filters false signals, improves entry accuracy
- Multiple stop loss options for different trader style
- Dynamic trailing stop controls risks
- Take profit in stages locks in some profit
Risks
- More false signals when market oscillates
- Trailing stop may be penetrated after strong run
- Fail to exit timely on trend reversal
Solutions:
- Use MACD to judge real trend
- Adjust trailing percentage
- Use other stop methods or combine stops
Enhancement
- Optimize MA parameters for best performance
- Test different stops and find best method
- Adjust take profit levels for better reward
- Add filters with other indicators
- Customize for different products and timeframes
Conclusion
The strategy uses MA system for entry signal, with additional filters by MACD, RSI etc. Both stops and profit targets are optimized for matching different trader style. There is still large room for optimization on entry timing, stop method, take profit level etc. to further improve performance.
Parameters
| Name | Default | What it controls |
|---|---|---|
| v_input_5 | 100000 | BUYVALUE |
| v_input_bool_1 | true | (?Entry_Exit Criteria)Show_Only_12_26_Crossover_Entry |
| v_input_bool_2 | false | Show_12_26_Crossover_and_resistance_Entry |
| v_input_bool_3 | true | Show_TSL_StopLoss |
| v_input_bool_4 | true | Show_Crossdown_StopLoss |
| v_input_bool_5 | false | Show_SMA7_StopLoss |
| v_input_float_1 | 5 | (?Target-1)Target (%) |
| v_input_int_1 | 50 | Target1_exit_qty |
| v_input_float_2 | 10 | (?Target-2)Target (%) |
| v_input_int_2 | 100 | Target2_exit_qty |
| v_input_1_low | 0 | (?Trailing StopLoss)TSL Source: low | high | close | open | hl2 | hlc3 | hlcc4 | ohlc4 |
| v_input_float_3 | true | Trail Long Loss (%) |
| v_input_int_3 | 10 | (?RESISTANCE)CrossOverLookbackCandles |
| v_input_2_high | 0 | resistanceSRC: high | close | low | open | hl2 | hlc3 | hlcc4 | ohlc4 |
| v_input_3 | 10 | resistanceLEFT |
| v_input_4 | 10 | resistanceRIGHT |
| v_input_int_4 | 50 | (?RSI)RSILowerRange |
| v_input_int_5 | 70 | RSIUpperRange |
Source Pine Script
/*backtest
start: 2023-01-30 00:00:00
end: 2024-02-05 00:00:00
period: 1d
basePeriod: 1h
exchanges: [{"eid":"Futures_Binance","currency":"BTC_USDT"}]
*/

// This source code is subject to the terms of the Mozilla Public License 2.0 at https://mozilla.org/MPL/2.0/
// © AbdulRahimShama
//@version=5


strategy('12/26-IT strategy', overlay=true,initial_capital = 100000)


Show_Only_12_26_Crossover_Entry = input.bool(true, group = "Entry_Exit Criteria")
Show_12_26_Crossover_and_resistance_Entry = input.bool(false, group = "Entry_Exit Criteria")


Show_TSL_StopLoss = input.bool(true, group = "Entry_Exit Criteria")
Show_Crossdown_StopLoss = input.bool(true, group = "Entry_Exit Criteria")
Show_SMA7_StopLoss = input.bool(false, group = "Entry_Exit Criteria")


////////////////////////////////////////////////
////////////////TARGETS INPUT
////////////////////////////////////////////////

////////Target1

TargetPerc1 = input.float(title="Target (%)", minval=0,defval=5, group="Target-1") / 100
TargetPrice1 = strategy.position_avg_price * (1 + TargetPerc1)
Target1_exit_qty = input.int(50, group="Target-1",tooltip = "% qty to sell when Target1 is reached")


////////Target2

TargetPerc2 = input.float(title="Target (%)", minval=0,defval=10, group="Target-2") / 100
TargetPrice2 = strategy.position_avg_price * (1 + TargetPerc2)
Target2_exit_qty = input.int(100, group="Target-2",tooltip = "% qty to sell when Target2 is reached")


////////////////////////////////////////////////
////////////////TRAILING STOP LOSS
////////////////////////////////////////////////


TSLsource = input(low, title="TSL Source", group="Trailing StopLoss")

longTrailPerc = input.float(title='Trail Long Loss (%)', minval=0.0, step=0.1, defval=1, group="Trailing StopLoss") * 0.01

TrailStopPrice = 0.0

TrailStopPrice := if strategy.position_size > 0
    sPIVOT_highValue = TSLsource * (1 - longTrailPerc)
    math.max(sPIVOT_highValue, TrailStopPrice[1])
else
    0

TSL = close < TrailStopPrice
plot(series=strategy.position_size > 0 and Show_TSL_StopLoss ? TrailStopPrice : na, color=color.new(color.fuchsia, 0), style=plot.style_linebr, linewidth=2, title='Trailing StopLoss')


////////////////////////////////////////////////
////////////////Moving Averages
////////////////////////////////////////////////


EMA_12=ta.ema(close, 12)
EMA_26=ta.ema(close, 26)
EMA_21=ta.ema(close,21)

plot(EMA_12, title="EMA_12", color=color.rgb(0, 255, 0), offset=0, linewidth=1)
plot(EMA_26, title="EMA_26", color=color.rgb(0, 0, 255), offset=0, linewidth=1)
plot(Show_SMA7_StopLoss ? ta.sma(close,7) : na, title="SMA_7", color=color.rgb(255, 0, 0), offset=0, linewidth=1)


////////////////////////////////////////////////
////////////////RESISTANCE INPUT and PLOTTING
////////////////////////////////////////////////

CrossOverLookbackCandles = input.int(10, group= "RESISTANCE")

resistanceSRC = input(high, group= "RESISTANCE")
resistanceLEFT = input(10, group= "RESISTANCE")
resistanceRIGHT = input(10, group= "RESISTANCE")

hih = ta.pivothigh(resistanceSRC, resistanceLEFT, resistanceRIGHT)
top = ta.valuewhen(hih, resistanceSRC[resistanceRIGHT], 0)

res = plot(top, color=top != top[1] ? na : color.new(#00ff00, 50), offset=-resistanceLEFT, linewidth=2, title="Resistance Line")

EMA_12_Low = ta.lowest(EMA_12, CrossOverLookbackCandles)
EMA_26_Low = ta.lowest(EMA_26, CrossOverLookbackCandles)


////////////////////////////////////////////////
////////////////RSI INPUT and PLOTTING
////////////////////////////////////////////////
RSI = ta.rsi(close, 14)
RSILowerRange = input.int(50, tooltip = "RSI value should be ABOVE this value for entry", group = "RSI")
RSIUpperRange = input.int(70, tooltip = "RSI value should be BELOW this value for entry", group = "RSI")


////////////////////////////////////////////////
////////////////MACD
////////////////////////////////////////////////
fast_length = 12
slow_length = 26
MACD_src = close
signal_length = 9

fast_ma = ta.ema(MACD_src, fast_length)
slow_ma = ta.ema(MACD_src, slow_length)
macd = fast_ma - slow_ma
signal = ta.ema(macd, signal_length)
hist = macd - signal


////////////////////////////////////////////////
////////////////ENTRY CRITERIA
////////////////////////////////////////////////


BUYVALUE= input(100000, tooltip = "Buy qty displayed on chart will be based on this value")

BASEENTRY = macd > signal and RSI > RSILowerRange and RSI < RSIUpperRange and close > EMA_21 and close > ta.sma(close, 7)


Entry= ta.crossover(EMA_12, EMA_26) and BASEENTRY
Entry2 = ta.crossover(close, top) and EMA_12_Low < EMA_26_Low and EMA_12 > EMA_26 and RSI < 70

////////////////////////////////////////////////
////////////////BUY SELL STRATEGY
////////////////////////////////////////////////

if ((Entry and Show_Only_12_26_Crossover_Entry))
    strategy.entry("buy", strategy.long, qty=BUYVALUE/close)

if (Entry2 and Show_12_26_Crossover_and_resistance_Entry)
    strategy.entry("buy", strategy.long, qty=BUYVALUE/close)

strategy.exit("Tg1", "buy", limit=TargetPrice1, qty_percent = Target1_exit_qty)
strategy.exit("Tg2", "buy", limit=TargetPrice2, qty_percent = Target2_exit_qty)


if TSL and Show_TSL_StopLoss and close < EMA_12
    strategy.close_all ("sl")

if ta.crossunder(EMA_12, EMA_26) and Show_Crossdown_StopLoss
    strategy.close_all ("sl")

if ta.crossunder(close, ta.sma(close, 7)) and Show_SMA7_StopLoss
    strategy.close_all ("sl")
Published by ChaoZhang on the FMZ strategy square · last modified 2024-02-06. Collected in the Quant Trading Vault. Unvalidated research: re-test with your own data and costs before trusting it.
Build this with AgenKit
A spec is not a trading system. Paste this into your coding agent and AgenKit runs a specialist team — architecture, test-first build, risk gates, review — with paper trading on by default.
/agenkit build a production-grade trading bot with a backtest engine, risk controls and paper trading by default from strategies/Dual-Moving-Average-With-Momentum-Breakout-Strategy.md- npx agenkit install engineering-kit in your project
- Paste the command into your agent and approve each phase
- Get tests, backtest, risk controls and a paper-trading switch
Understand it first
Before you run this, read the lesson behind the idea and how to backtest it honestly. Specs like this one are the survivors of an unknown number of trials; deflate their results accordingly.
Related specs
- Momentum Breakout Moving Average StrategyPine Script · Breakout · 1d
- Moving Average Crossover and Upper Rail Breakthrough Impulse StrategyPine Script · Breakout · 1m
- Quantitative Trading Strategy Based on Ichimoku with Multiple SignalsPine Script · Breakout · 1h
- Dual Moving Average and MACD Combination Short term Trading StrategyPine Script · Breakout · 1h
- Moving Average Tracking Trading StrategyPine Script · Breakout · 3h
- Multi Period Dynamic Signal Integration ICT Smart Structure Breakthrough StrategyPine Script · Breakout · 2d