Dual RSI Breakthrough Strategy
The dual RSI breakout strategy is an algorithmic trading strategy that identifies price reversal points using the RSI indicator. It generates trading signals by comparing the RSI indicator with preset upper and lower…
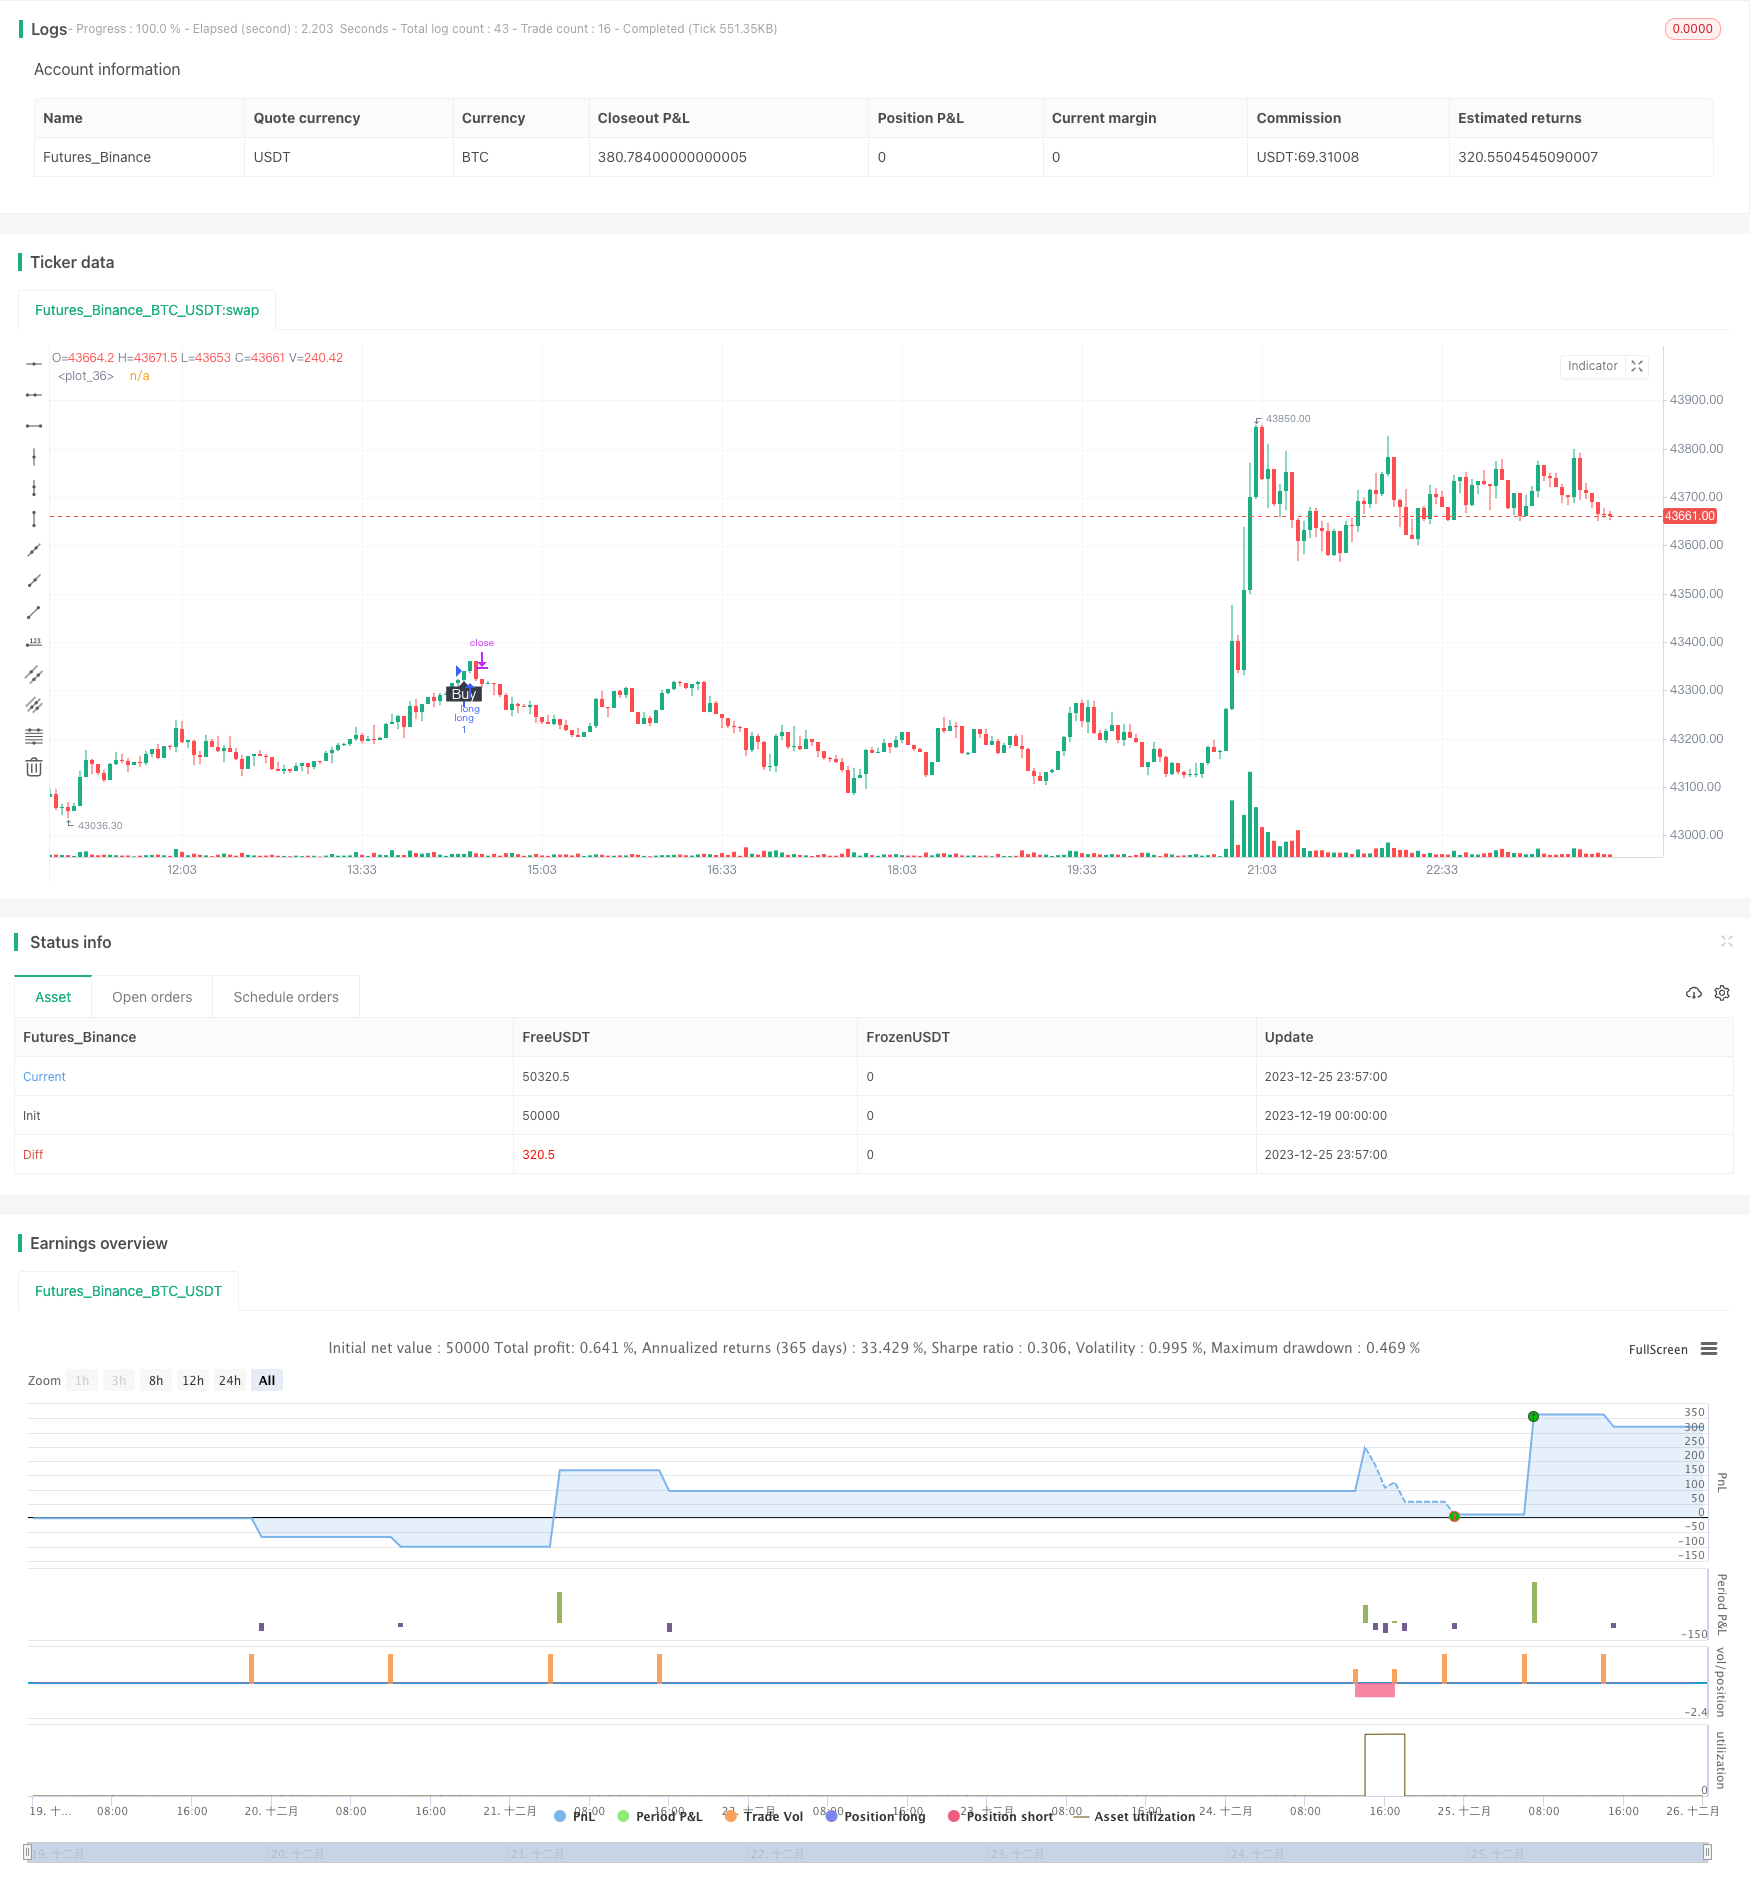
Overview
The dual RSI breakout strategy is an algorithmic trading strategy that identifies price reversal points using the RSI indicator. It generates trading signals by comparing the RSI indicator with preset upper and lower threshold values to determine whether the market is overbought or oversold.
Strategy Logic
This strategy mainly relies on the RSI indicator to judge the market condition. The RSI indicator is calculated based on the changes in closing prices over a certain period, reflecting the buying and selling momentum of the stock. When the RSI crosses above the preset upper threshold (default 75), it indicates the stock has entered the overbought zone. When the RSI falls below the preset lower threshold (default 25), it indicates the stock has entered the oversold zone.
The judgment rules are:
- When RSI crosses above the upper threshold, go short;
- When RSI crosses below the lower threshold, go long;
- Close position when reaching stop loss or take profit.
Its trading logic is simple and clear, with reasonable reference parameter settings, large configuration space, and is suitable for capturing larger trends in the market.
Advantage Analysis
The advantages of this strategy include:
- Simple logic that is easy to understand and implement;
- Reasonable reference parameter settings that can be personalized;
- Configurable reverse trading logic that can flexibly respond to market conditions;
- Can effectively identify price reversal points and capture major trends.
In general, with reasonable reference parameter settings, simple implementation, and the ability to effectively determine price reversals through RSI, this strategy is suitable for medium- to long-term trend capturing and is easy to grasp and use as a quantitative strategy.
Risk Analysis
Although this strategy is relatively simple and reliable, we cannot ignore the potential risks it faces:
- Relatively high probability of RSI indicators triggering false signals. RSI cannot perfectly predict price reversals, which may lead to misjudgements.
- Possibility of continuous stop loss in a trending market. RSI finds it difficult to distinguish normal range-bound adjustments from trend reversals.
- More losses likely in a ranging market. RSI is unable to effectively determine ranging trends, leading to greater losses in this environment.
To control risks, we need to pay attention to the following:
- Adjust parameters appropriately to prevent excessive misjudgement rates.
- Confirm trading signals with other indicators to improve accuracy.
- Increase the profit taking ratio and reduce single stop loss size.
- Avoid trading in ranging markets.
Optimization Directions
Considering the main risks faced by this strategy are reversal misjudgements and losses in ranging markets, we can optimize from the following aspects:
- Filter signals with other indicators. Indicators like KDJ and MACD can play a filtering role to avoid misjudgements.
- Increase the threshold for single stop loss amounts. Appropriately expanding the single stop loss space can help the strategy follow big trends.
- Set open position frequency limits. Add logic restricting entries to once or N times per certain period to control overly frequent position opening.
- Set market condition judgements. Ensure strategy only runs in trending markets, avoiding ranging markets, which can significantly optimize the strategy's risk-reward ratio.
Conclusion
In summary, the dual RSI breakout strategy is a simple and practical quantitative strategy. It identifies price reversals via RSI to achieve simple trend following. Although certain misjudgement risks exist, optimizations like parameter tuning, signal filtering can help mitigate this and allow it to play an important role in catching medium- to long-term trends. Its logic is straightforward, making it suitable for beginner quants to reference and learn from. With further optimizations, this strategy shows promise in obtaining relatively stable quantitative returns.
Parameters
| Name | Default | What it controls |
|---|---|---|
| v_input_1 | 14 | Period |
| v_input_2 | 75 | Upper Threshold |
| v_input_3 | 25 | Lower Threshold |
| v_input_4 | false | Imverse Algorthim |
| v_input_5 | true | Show Lines |
| v_input_6 | true | Show Labels |
| v_input_7 | 2 | Risk % |
| v_input_8 | false | Is this a 2 digit pair? (JPY, XAU, XPD... |
| v_input_9 | 250 | stop loss pips |
| v_input_10 | 2500 | take profit pips |
Source Pine Script
/*backtest
start: 2023-12-19 00:00:00
end: 2023-12-26 00:00:00
period: 3m
basePeriod: 1m
exchanges: [{"eid":"Futures_Binance","currency":"BTC_USDT"}]
*/

//@version=4
strategy("RSI Algo", overlay=true)

// Calculate start/end date and time condition
DST = 1 //day light saving for usa
//--- Europe
London = iff(DST==0,"0000-0900","0100-1000")
//--- America
NewYork = iff(DST==0,"0400-1500","0500-1600")
//--- Pacific
Sydney = iff(DST==0,"1300-2200","1400-2300")
//--- Asia
Tokyo = iff(DST==0,"1500-2400","1600-0100")

//-- Time In Range
timeinrange(res, sess) => time(res, sess) != 0

london = timeinrange(timeframe.period, London)
newyork = timeinrange(timeframe.period, NewYork)

time_cond = true


myPeriod = input(defval=14, type=input.integer, title="Period")
myThresholdUp = input(defval=75, type=input.float, title="Upper Threshold")
myThresholdDn = input(defval=25, type=input.float, title="Lower Threshold")
myAlgoFlipToggle = input(defval=false, type=input.bool, title="Imverse Algorthim")
myLineToggle = input(defval=true, type=input.bool, title="Show Lines")
myLabelToggle = input(defval=true, type=input.bool, title="Show Labels")
myRSI=rsi(close, myPeriod)
buy = myAlgoFlipToggle ? falling(myRSI,1) and cross(myRSI, myThresholdDn) : rising(myRSI, 1) and cross(myRSI,myThresholdUp) //and time_cond
sell = myAlgoFlipToggle ? rising(myRSI, 1) and cross(myRSI,myThresholdUp) : falling(myRSI,1) and cross(myRSI, myThresholdDn) //and time_cond
myPosition = 0
myPosition := buy==1 ? 0 : sell==1 or myPosition[1]==1 ? 1 : 0
trendColor = buy ? color.red : sell ? color.green : na
plot(myLineToggle ? buy and myPosition[1]==1 ? low - 0.004: sell and myPosition[1]==0 ? high + 0.004 : na : na, color=trendColor, style=plot.style_line, linewidth=4, editable=false)
plotshape(myLabelToggle ? buy and myPosition[1]==1 ? low - 0.005 : na : na, style=shape.labelup, location=location.absolute, text="Buy", transp=0, textcolor = color.white, color=color.black, editable=false)
plotshape(myLabelToggle ? sell and myPosition[1]==0 ? high + 0.005 : na : na, style=shape.labeldown, location=location.absolute, text="Sell", transp=0, textcolor = color.white, color=color.black, editable=false)

strategy.initial_capital = 50000
    //Calculate the size of the next trade
balance = strategy.netprofit + strategy.initial_capital //current balance
floating = strategy.openprofit          //floating profit/loss
risk = input(2,type=input.float,title="Risk %")/100           //risk % per trade
isTwoDigit = input(false,"Is this a 2 digit pair? (JPY, XAU, XPD...")


stop = input(250, title="stop loss pips")
tp = input(2500, title="take profit pips")
if(isTwoDigit)
    stop := stop/100

temp01 = balance * risk     //Risk in USD
temp02 = temp01/stop        //Risk in lots
temp03 = temp02*100000      //Convert to contracts
size = 1

strategy.entry("long",1,size,when=buy and myPosition[1]==1 )
strategy.entry("short",0,size,when=sell and myPosition[1]==0)

strategy.exit("exit_long","long",loss=stop, profit=tp)      //Long exit (stop loss)
strategy.exit("exit_short","short",loss=stop, profit=tp)      //Short exit (stop loss)

//strategy.close_all(when= not time_cond)
Published by ChaoZhang on the FMZ strategy square · last modified 2023-12-27. Collected in the Quant Trading Vault. Unvalidated research: re-test with your own data and costs before trusting it.
Build this with AgenKit
A spec is not a trading system. Paste this into your coding agent and AgenKit runs a specialist team — architecture, test-first build, risk gates, review — with paper trading on by default.
/agenkit build a production-grade trading bot with a backtest engine, risk controls and paper trading by default from strategies/Dual-RSI-Breakthrough-Strategy.md- npx agenkit install engineering-kit in your project
- Paste the command into your agent and approve each phase
- Get tests, backtest, risk controls and a paper-trading switch
Understand it first
Before you run this, read the lesson behind the idea and how to backtest it honestly. Specs like this one are the survivors of an unknown number of trials; deflate their results accordingly.
Related specs
- Bollinger Band Channel Breakout Trading StrategyPine Script · Breakout · 1d
- Bollinger Bands Dynamic Breakout StrategyPine Script · Breakout · 1h
- Bull Market Tracking SystemPine Script · Breakout · 1h
- Cross boundary Dynamic Range Quantitative Trading Strategy Based on Bollinger BandsPine Script · Breakout · 3h
- Cross period Value Area Breakout StrategyPine Script · Breakout · 1d
- Darvas Box Breakout and Risk Management Strategy DarvasPine Script · Breakout · 1d