Strategy vault / Trend following
Dual RSI Strategy Advanced Trend Capture System Combining Divergence and Crossover
The Dual RSI Strategy is an advanced quantitative trading approach that combines two classic RSI-based trading methods: RSI divergence and RSI crossover. This strategy aims to capture more reliable buy and sell…
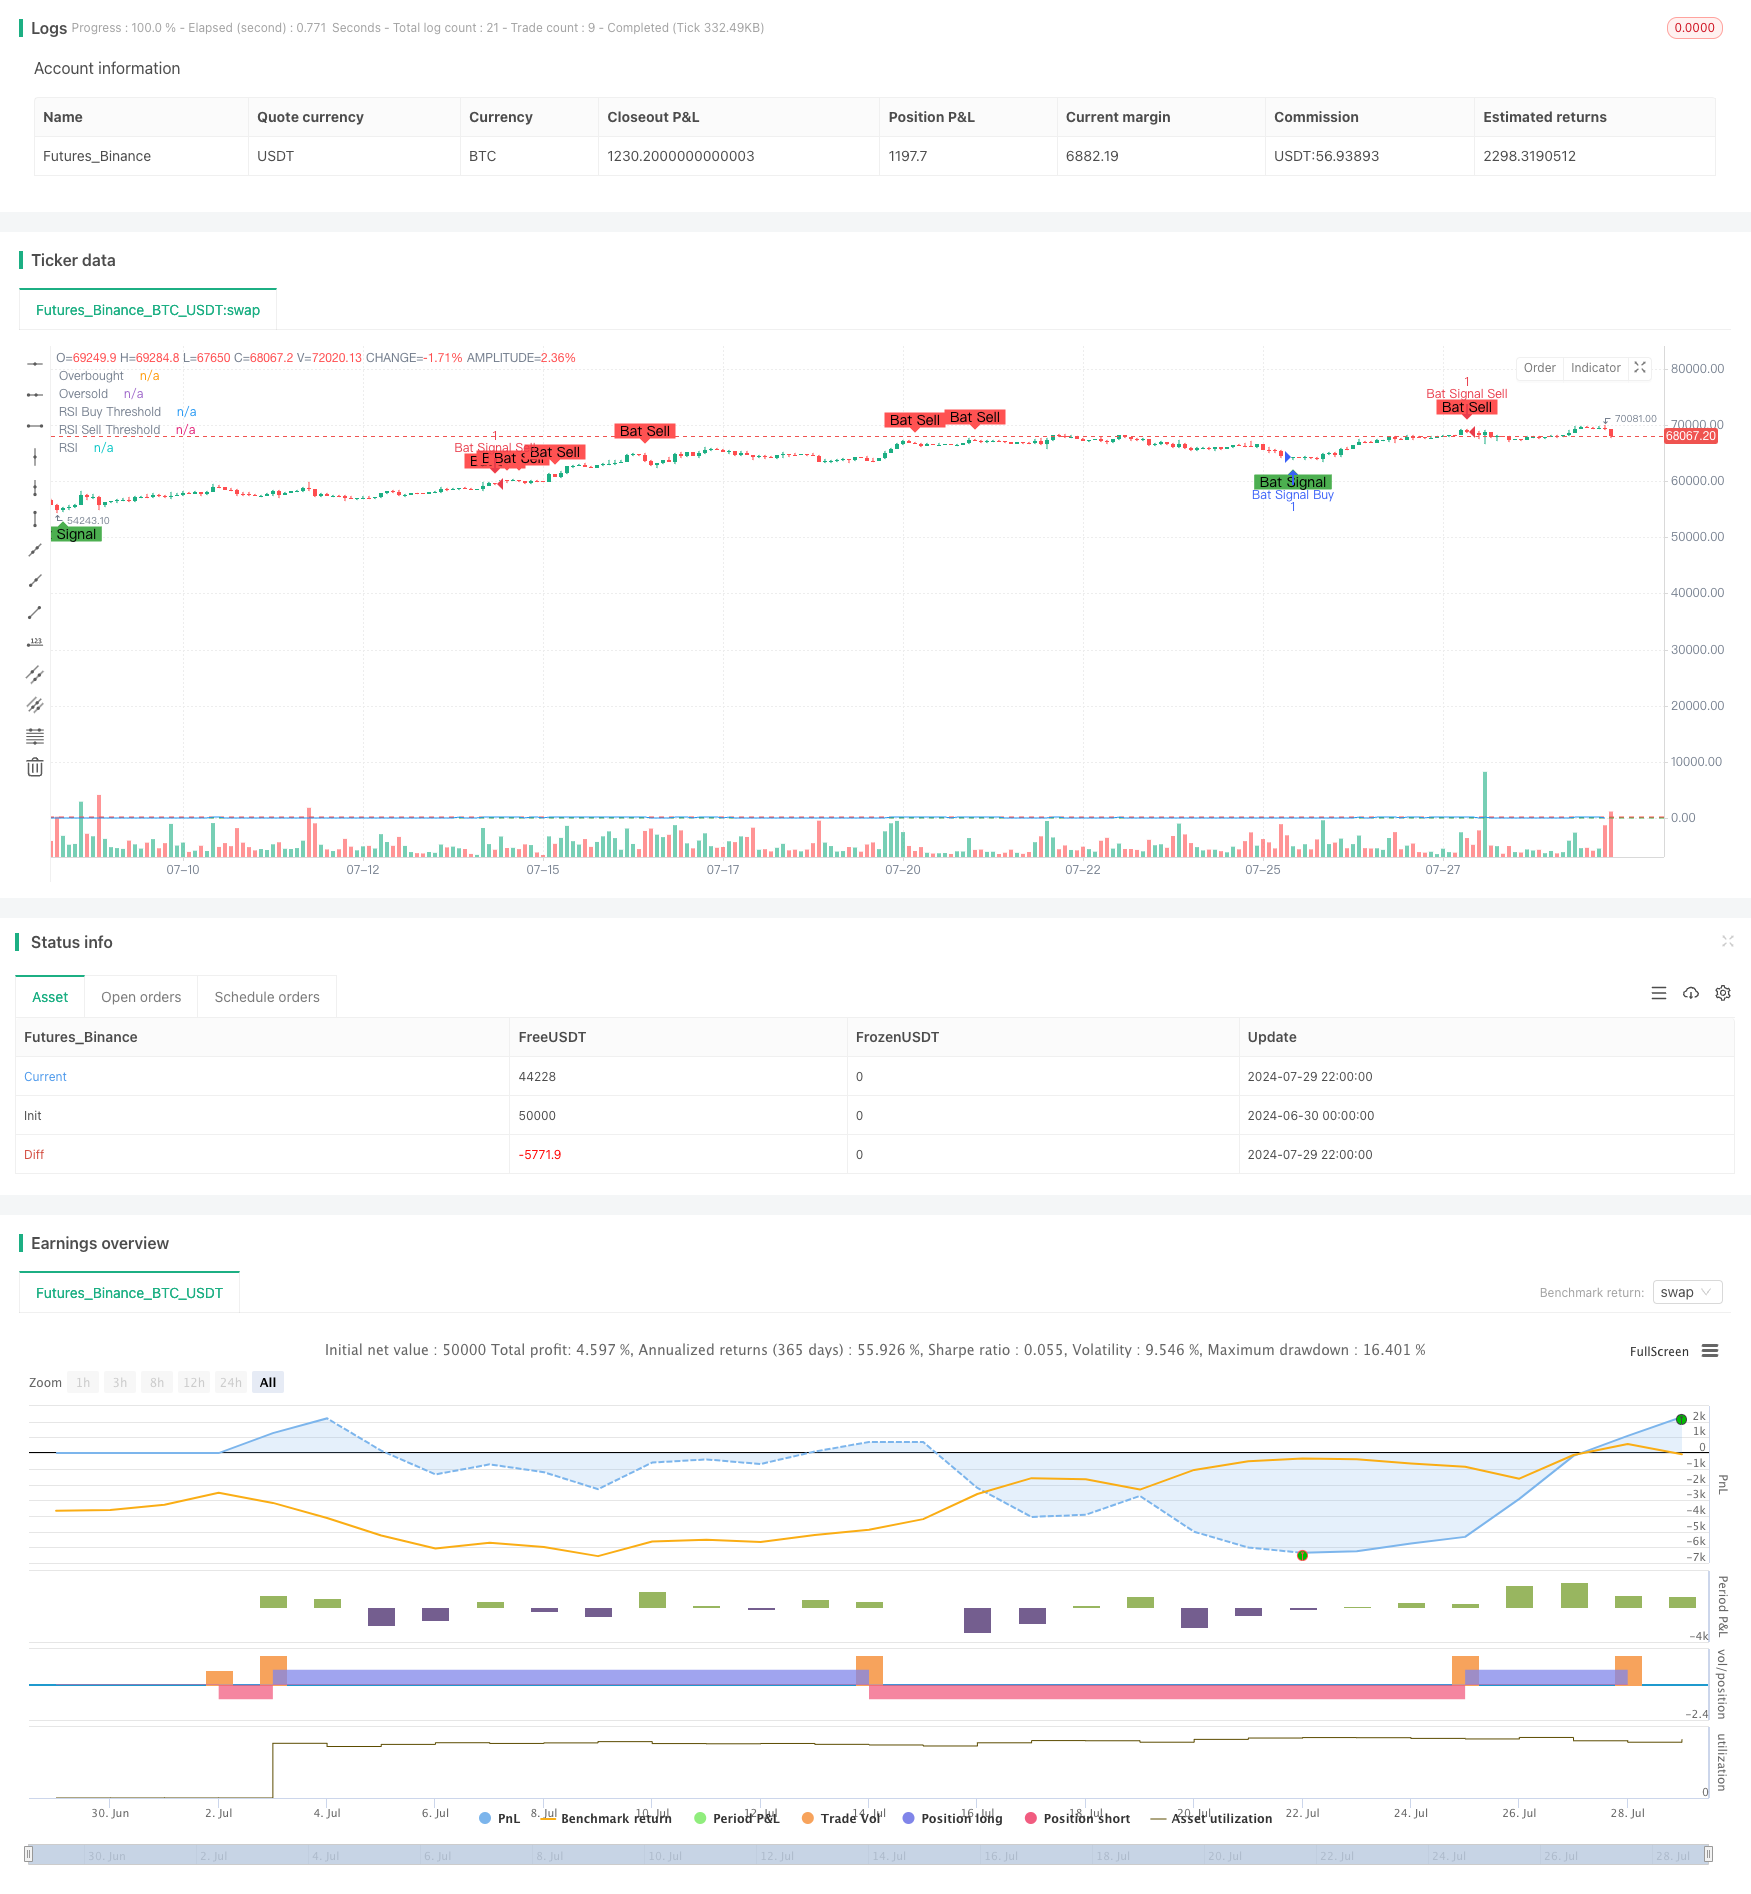
Overview
The Dual RSI Strategy is an advanced quantitative trading approach that combines two classic RSI-based trading methods: RSI divergence and RSI crossover. This strategy aims to capture more reliable buy and sell signals in the market by simultaneously monitoring both divergence and crossover signals from the RSI indicator. The core idea is to generate trading signals only when both RSI divergence and RSI crossover occur simultaneously, providing a double confirmation mechanism that enhances the accuracy and reliability of trades.
Strategy Principles
RSI Divergence:
- Bullish Divergence: Occurs when price makes a new low, but RSI fails to make a new low.
- Bearish Divergence: Occurs when price makes a new high, but RSI fails to make a new high.
RSI Crossover:
- Buy Signal: RSI crosses above the oversold level (30).
- Sell Signal: RSI crosses below the overbought level (70).
Signal Generation:
- Buy Condition: Bullish RSI divergence AND RSI crosses above the oversold level.
- Sell Condition: Bearish RSI divergence AND RSI crosses below the overbought level.
Parameter Settings:
- RSI Period: 14 (adjustable)
- Overbought Level: 70 (adjustable)
- Oversold Level: 30 (adjustable)
- Divergence Lookback Period: 90 bars (adjustable)
Strategy Advantages
High Reliability: By combining RSI divergence and crossover signals, the strategy significantly improves the reliability of trading signals and reduces the risk of false signals.
Trend Capture: Effectively identifies market trend reversal points, suitable for medium to long-term trading.
Flexibility: Key parameters are adjustable, allowing adaptation to different market environments and trading instruments.
Risk Control: The strict double confirmation mechanism effectively controls trading risk.
Visual Support: The strategy provides clear chart markings, facilitating intuitive understanding of market conditions.
Strategy Risks
Lag: Due to the need for double confirmation, the strategy may miss the early stages of some rapid market movements.
Over-reliance on RSI: In certain market conditions, a single indicator may not fully reflect market dynamics.
Parameter Sensitivity: Different parameter settings can lead to vastly different trading results, requiring careful optimization.
False Signal Risk: Although the double confirmation mechanism reduces false signal risk, it can still occur in highly volatile markets.
Lack of Stop-Loss Mechanism: The strategy itself does not include a built-in stop-loss mechanism, requiring traders to set additional risk management measures.
Strategy Optimization Directions
Multi-Indicator Integration: Introduce other technical indicators (e.g., MACD, Bollinger Bands) for cross-validation to further improve signal reliability.
Adaptive Parameters: Dynamically adjust RSI period and thresholds based on market volatility to adapt to different market environments.
Implement Stop-Loss: Design a stop-loss strategy based on ATR or fixed percentage to control single trade risk.
Time Filtering: Add trading time window restrictions to avoid trading during unfavorable periods.
Volatility Filtering: Suppress trading signals in low volatility environments to reduce false breakout risks.
Volume Analysis: Incorporate volume analysis to increase signal credibility.
Machine Learning Optimization: Use machine learning algorithms to optimize parameter selection and improve strategy adaptability.
Conclusion
The Dual RSI Strategy cleverly combines RSI divergence and crossover signals to create a powerful and flexible trading system. It not only effectively captures important turning points in market trends but also significantly improves the reliability of trading signals through its double confirmation mechanism. While the strategy has certain risks such as lag and parameter sensitivity, these issues can be effectively mitigated through proper optimization and risk management. In the future, by introducing advanced techniques such as multi-indicator cross-validation, adaptive parameters, and machine learning, this strategy has great potential for improvement. For quantitative traders seeking a robust and reliable trading system, the Dual RSI Strategy is undoubtedly a worthy choice for in-depth study and practice.
Source Pine Script
/*backtest
start: 2024-06-30 00:00:00
end: 2024-07-30 00:00:00
period: 2h
basePeriod: 15m
exchanges: [{"eid":"Futures_Binance","currency":"BTC_USDT"}]
*/

//@version=4
strategy("Combined RSI Strategies", overlay=true)

// Input parameters for the first strategy (RSI Divergences)
len = input(14, minval=1, title="RSI Length")
ob = input(defval=70, title="Overbought", type=input.integer, minval=0, maxval=100)
os = input(defval=30, title="Oversold", type=input.integer, minval=0, maxval=100)
xbars = input(defval=90, title="Div lookback period (bars)?", type=input.integer, minval=1)

// Input parameters for the second strategy (RSI Crossover)
rsiBuyThreshold = input(30, title="RSI Buy Threshold")
rsiSellThreshold = input(70, title="RSI Sell Threshold")

// RSI calculation
rsi = rsi(close, len)

// Calculate highest and lowest bars for divergences
hb = abs(highestbars(rsi, xbars))
lb = abs(lowestbars(rsi, xbars))

// Initialize variables for divergences
var float max = na
var float max_rsi = na
var float min = na
var float min_rsi = na
var bool pivoth = na
var bool pivotl = na
var bool divbear = na
var bool divbull = na

// Update max and min values for divergences
max := hb == 0 ? close : na(max[1]) ? close : max[1]
max_rsi := hb == 0 ? rsi : na(max_rsi[1]) ? rsi : max_rsi[1]
min := lb == 0 ? close : na(min[1]) ? close : min[1]
min_rsi := lb == 0 ? rsi : na(min_rsi[1]) ? rsi : min_rsi[1]

// Compare current bar's high/low with max/min values for divergences
if close > max
    max := close
if rsi > max_rsi
    max_rsi := rsi
if close < min
    min := close
if rsi < min_rsi
    min_rsi := rsi

// Detect pivot points for divergences
pivoth := (max_rsi == max_rsi[2]) and (max_rsi[2] != max_rsi[3]) ? true : na
pivotl := (min_rsi == min_rsi[2]) and (min_rsi[2] != min_rsi[3]) ? true : na

// Detect divergences
if (max[1] > max[2]) and (rsi[1] < max_rsi) and (rsi <= rsi[1])
    divbear := true
if (min[1] < min[2]) and (rsi[1] > min_rsi) and (rsi >= rsi[1])
    divbull := true

// Conditions for RSI crossovers
isRSICrossAboveThreshold = crossover(rsi, rsiBuyThreshold)
isRSICrossBelowThreshold = crossunder(rsi, rsiSellThreshold)

// Combined buy and sell conditions
buyCondition = divbull and isRSICrossAboveThreshold
sellCondition = divbear and isRSICrossBelowThreshold

// Generate buy/sell signals
if buyCondition
    strategy.entry("Bat Signal Buy", strategy.long)
if sellCondition
    strategy.entry("Bat Signal Sell", strategy.short)

// Plot RSI
plot(rsi, "RSI", color=color.blue)
hline(ob, title="Overbought", color=color.red)
hline(os, title="Oversold", color=color.green)
hline(rsiBuyThreshold, title="RSI Buy Threshold", color=color.green)
hline(rsiSellThreshold, title="RSI Sell Threshold", color=color.red)

// Plot signals
plotshape(series=buyCondition, title="Bat Signal", location=location.belowbar, color=color.green, style=shape.labelup, text="Bat Signal")
plotshape(series=sellCondition, title="Bat Sell", location=location.abovebar, color=color.red, style=shape.labeldown, text="Bat Sell")
Published by ChaoZhang on the FMZ strategy square · last modified 2024-07-31. Collected in the Quant Trading Vault. Unvalidated research: re-test with your own data and costs before trusting it.
Build this with AgenKit
A spec is not a trading system. Paste this into your coding agent and AgenKit runs a specialist team — architecture, test-first build, risk gates, review — with paper trading on by default.
/agenkit build a production-grade trading bot with a backtest engine, risk controls and paper trading by default from strategies/Dual-RSI-Strategy-Advanced-Trend-Capture-System-Combining-Divergence-and-Crossover.md- npx agenkit install engineering-kit in your project
- Paste the command into your agent and approve each phase
- Get tests, backtest, risk controls and a paper-trading switch
Understand it first
Before you run this, read the lesson behind the idea and how to backtest it honestly. Specs like this one are the survivors of an unknown number of trials; deflate their results accordingly.
Related specs
- EMA AROON ASHPine Script · Trend following · 3m
- Fixed Range Volume Profile And Anchored VWAP Trend Identification Strategy With Dynamic Stop LossPine Script · Trend following · 1h
- Incremental Order Size Fibonacci Retracement Trend Following StrategyPine Script · Trend following · 1d
- Multi Indicator Dynamic Trend Prediction Trading SystemPine Script · Trend following · 1h
- Pivot Detector Oscillator Trend Trading StrategyPine Script · Trend following · 1d
- Trend Detection Strategy Based on Gaussian Channel and Stochastic RSI FilterPine Script · Trend following · 1h