Dual track Bollinger Band Momentum Trading Strategy
This strategy is based on the concept of Bollinger Bands, setting upper and lower rails for the price channel and using them for trend judgment and trade signal generation. Specifically, it calculates the average…
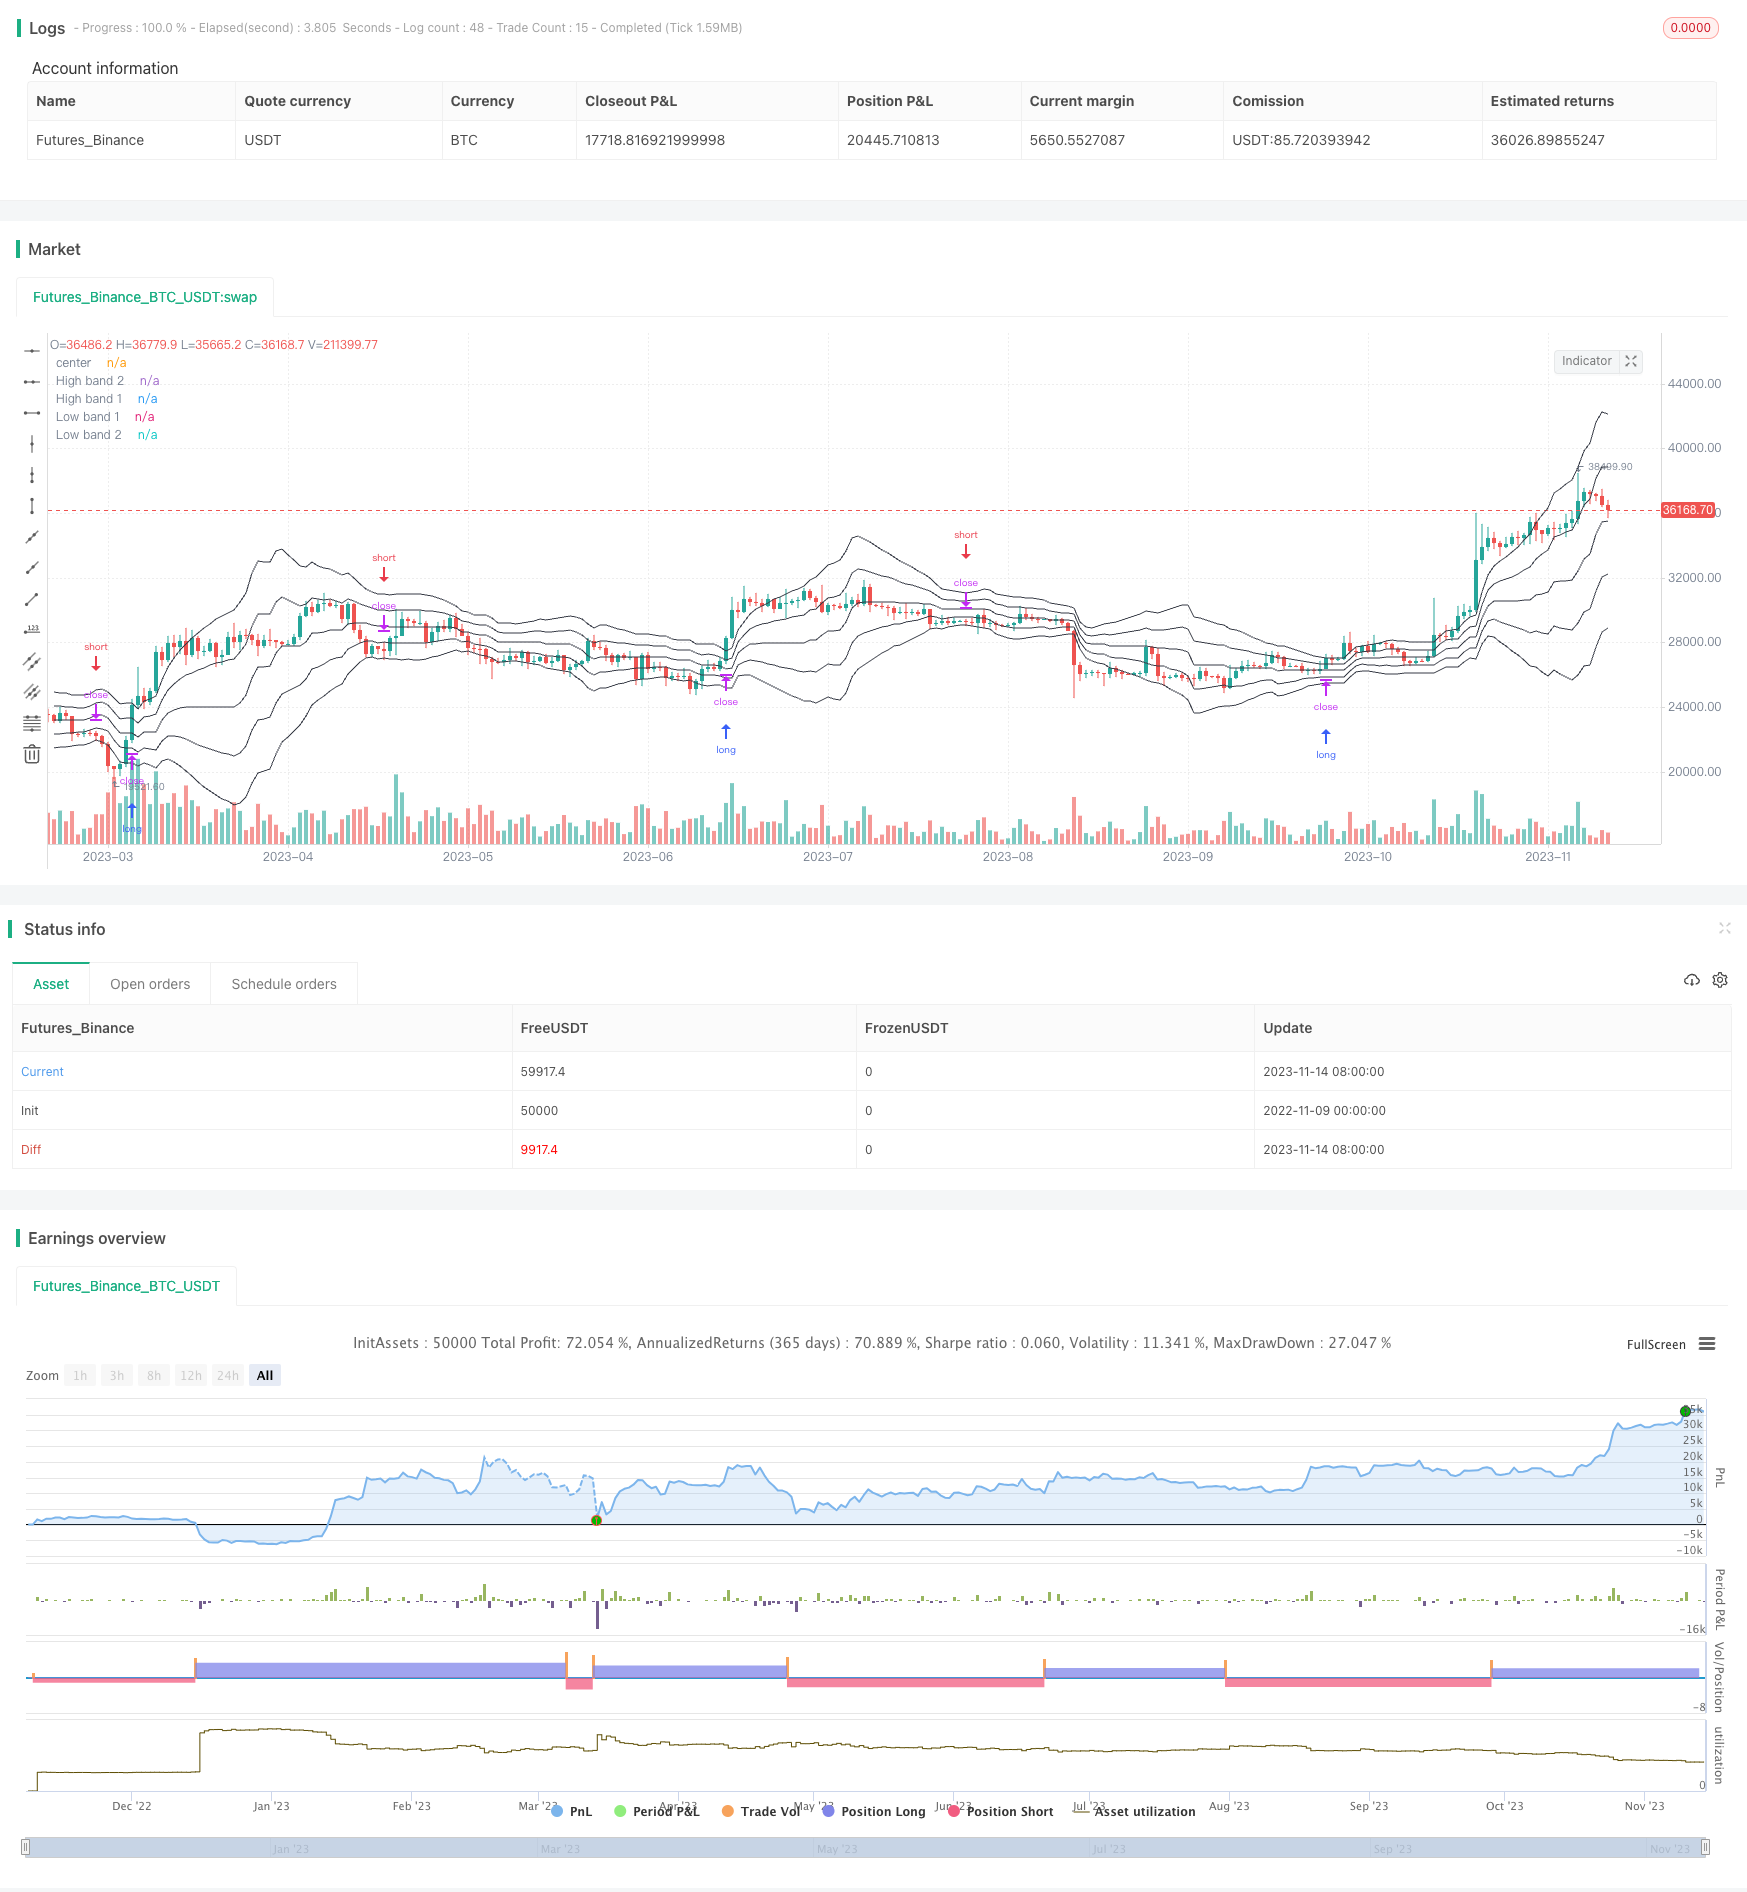
Overview
This strategy is based on the concept of Bollinger Bands, setting upper and lower rails for the price channel and using them for trend judgment and trade signal generation. Specifically, it calculates the average absolute deviation of the price as the channel bandwidth. The middle rail of the channel is the simple moving average of the price, and the upper and lower rails are the middle rail plus or minus 1 or 2 times the channel bandwidth. When the price breaks through the upper rail, go long. When it breaks through the lower rail, go short.
Principle
The main points of this strategy include:
Calculate the middle rail of the price, which is the simple moving average of the price.
Calculate the simple moving average of the absolute deviation of the price as the channel bandwidth.
Determine the upper and lower rails according to the middle rail and bandwidth. The upper rail is the middle rail plus 1 or 2 times the bandwidth. The lower rail is the middle rail minus 1 or 2 times the bandwidth.
Calculate the trend judgment indicator for long and short. When the price is above the upper rail 2, it is long. When the price is below the lower rail 2, it is short.
Generate trading signals. When the price crosses above the upper rail 2, go long. When it crosses below the lower rail 2, go short.
Set stop loss line. The stop loss line for long orders is the lower rail 1, and for short orders it is the upper rail 1.
Calculate the position size according to capital management requirements.
The strategy integrates the ideas of using moving averages to judge trends, Bollinger Bands to judge overbought and oversold, and breakouts to make reversals. The difference between the double rails is used to judge the strength of the trend, while the regression function of Bollinger Bands is utilized to form a relatively stable trading system.
Advantage Analysis
The main advantages of this strategy are:
The dual-rail system can better judge the strength of the trend.
Bollinger Bands have a strong regression function to effectively avoid false breakouts.
The difference between the dual rails combined with the regression of Bollinger Bands forms relatively stable trading signals.
There is a clear stop loss/exit logic to control risks.
The position sizing follows capital management requirements, avoiding super leverage.
The strategy idea is clear and easy to understand and optimize.
Flexible parameter settings make it adaptable for different markets.
Risk Analysis
The strategy also has some risks:
Improper Bollinger Bands parameters may cause ditching effects, failing to effectively track prices.
The difference between dual rails cannot completely avoid erroneous trend judgments.
It may generate more invalid signals in range-bound markets.
Losses may occur in false breakout situations.
There is some time lag, possibly missing cycle turning points.
The risk/reward ratio is limited by the stop loss point, unable to unlimitedly chase trends.
Corresponding risk management measures:
Optimize parameters to make Bollinger Bands adaptable to different cycles.
Combine other indicators for confirmation to avoid misjudgment.
Reduce position size to control single loss.
Optimize stop loss points to ensure risk/reward ratio.
Appropriately shorten cycle to reduce lag.
Risk control should be robust, no unlimited chasing.
Optimization Directions
The strategy can be optimized in the following directions:
Optimize Bollinger Bands parameters for better price tracking. Adaptive parameters can be introduced.
Try different moving averages like EMA, DWMA, etc.
Add trend filtering to avoid trading in range-bound markets. MACD can be considered.
Add aggressive exit methods to capture more trend profits. Trailing stop loss, exit signals etc. can be considered.
Introduce multiple time frames for combination, suitable for different market conditions.
Add additional conditions like volume surges to avoid false breakouts.
Consider reverse Bollinger Bands, selling upper band, buying lower band.
Perform parameter optimization for best parameter combinations.
Summary
The overall idea of this strategy is clear and stable. There is also room for improvement via parameter optimization, logic enhancement, risk management etc. to further refine it into a very practical quantitative trading strategy. The strategy provides a good reference for beginners in quantitative trading.
Parameters
| Name | Default | What it controls |
|---|---|---|
| v_input_1 | true | Long |
| v_input_2 | true | Short |
| v_input_3 | 100 | Lot, % |
| v_input_4 | 20 | Length |
| v_input_5_ohlc4 | 0 | Source: ohlc4 | high | low | open | hl2 | hlc3 | hlcc4 | close |
| v_input_6 | true | Show Bands |
| v_input_7 | true | Show Offset |
| v_input_8 | false | Show Background |
| v_input_9 | 1900 | From Year |
| v_input_10 | 2100 | To Year |
| v_input_11 | true | From Month |
| v_input_12 | 12 | To Month |
| v_input_13 | true | From day |
| v_input_14 | 31 | To day |
Source Pine Script
/*backtest
start: 2022-11-09 00:00:00
end: 2023-11-15 00:00:00
period: 1d
basePeriod: 1h
exchanges: [{"eid":"Futures_Binance","currency":"BTC_USDT"}]
*/

// This source code is subject to the terms of the Mozilla Public License 2.0 at https://mozilla.org/MPL/2.0/
// © noro

//@version=4
strategy(title = "Noro's Bands Strategy", shorttitle = "Bands", overlay = true, default_qty_type = strategy.percent_of_equity, default_qty_value = 100, pyramiding = 0, commission_value = 0.1)

//Sattings
needlong = input(true, defval = true, title = "Long")
needshort = input(true, defval = true, title = "Short")
lotsize = input(100, defval = 100, minval = 1, maxval = 10000, title = "Lot, %")
len = input(20, defval = 20, minval = 1, maxval = 1000, title = "Length")
src = input(ohlc4, title = "Source")
showbb = input(true, title = "Show Bands")
showof = input(true, title = "Show Offset")
showbg = input(false, title = "Show Background")
fromyear = input(1900, defval = 1900, minval = 1900, maxval = 2100, title = "From Year")
toyear = input(2100, defval = 2100, minval = 1900, maxval = 2100, title = "To Year")
frommonth = input(01, defval = 01, minval = 01, maxval = 12, title = "From Month")
tomonth = input(12, defval = 12, minval = 01, maxval = 12, title = "To Month")
fromday = input(01, defval = 01, minval = 01, maxval = 31, title = "From day")
today = input(31, defval = 31, minval = 01, maxval = 31, title = "To day")

//PriceChannel
lasthigh = highest(src, len)
lastlow = lowest(src, len)
center = (lasthigh + lastlow) / 2

//Distance
dist = abs(src - center)
distsma = sma(dist, len)
hd = center + distsma
ld = center - distsma
hd2 = center + distsma * 2
ld2 = center - distsma * 2

//Trend
trend = 0
trend := high > hd2 ? 1 : low < ld2 ? -1 : trend[1]
bgcol = showbg == false ? na : trend == 1 ? color.lime : color.red
bgcolor(bgcol, transp = 70)

//Lines
colo = showbb == false ? na : color.black
offset = showof ? 1 : 0
plot(hd2, color = colo, linewidth = 1, transp = 0, offset = offset, title = "High band 2")
plot(hd, color = colo, linewidth = 1, transp = 0, offset = offset, title = "High band 1")
plot(center, color = colo, linewidth = 1, transp = 0, offset = offset, title = "center")
plot(ld, color = colo, linewidth = 1, transp = 0, offset = offset, title = "Low band 1")
plot(ld2, color = colo, linewidth = 1, transp = 0, offset = offset, title = "Low band 2")

//Trading
size = strategy.position_size
needstop = needlong == false or needshort == false
truetime = time > timestamp(fromyear, frommonth, fromday, 00, 00) and time < timestamp(toyear, tomonth, today, 23, 59)
lot = 0.0
lot := size != size[1] ? strategy.equity / close * lotsize / 100 : lot[1]
if distsma > 0
    strategy.entry("Long", strategy.long, lot, stop = hd2, when = truetime and needlong)
    strategy.entry("Short", strategy.short, lot, stop = ld2, when = truetime and needshort)
sl = size > 0 ? ld2 : size < 0 ? hd2 : na
if size > 0 and needstop
    strategy.exit("Stop Long", "Long", stop = sl)
if size < 0 and needstop
    strategy.exit("Stop Short", "Short", stop = sl)
if time > timestamp(toyear, tomonth, today, 23, 59)
    strategy.close_all()
    strategy.cancel("Long")
strategy.cancel("Short")Published by ChaoZhang on the FMZ strategy square · last modified 2023-11-16. Collected in the Quant Trading Vault. Unvalidated research: re-test with your own data and costs before trusting it.
Build this with AgenKit
A spec is not a trading system. Paste this into your coding agent and AgenKit runs a specialist team — architecture, test-first build, risk gates, review — with paper trading on by default.
/agenkit build a production-grade trading bot with a backtest engine, risk controls and paper trading by default from strategies/Dual-track-Bollinger-Band-Momentum-Trading-Strategy.md- npx agenkit install engineering-kit in your project
- Paste the command into your agent and approve each phase
- Get tests, backtest, risk controls and a paper-trading switch
Understand it first
Before you run this, read the lesson behind the idea and how to backtest it honestly. Specs like this one are the survivors of an unknown number of trials; deflate their results accordingly.
Related specs
- ADX Momentum Trend StrategyPine Script · Momentum · 10m
- Bollinger Bands Momentum Trend Following Quantitative StrategyPine Script · Momentum · 1d
- Momentum Oscillator Bollinger Band RSI Trading StrategyPine Script · Momentum · 1m
- Moving Average Candle Regression StrategyPine Script · Momentum · 15m
- Multi Timeframe Unified Strategy Based on Quantitative Momentum and Convergence DivergencePine Script · Momentum · 1d
- Adaptive Trading Strategy Based on Momentum IndicatorsPine Script · Momentum · 1d