Strategy vault / Trend following
Dynamic ATR Trailing Stop Loss Strategy
This strategy is based on the dynamic trailing stop loss mechanism designed with the ATR indicator to adjust the stop loss in real time while ensuring effective stop loss to maximize profits.
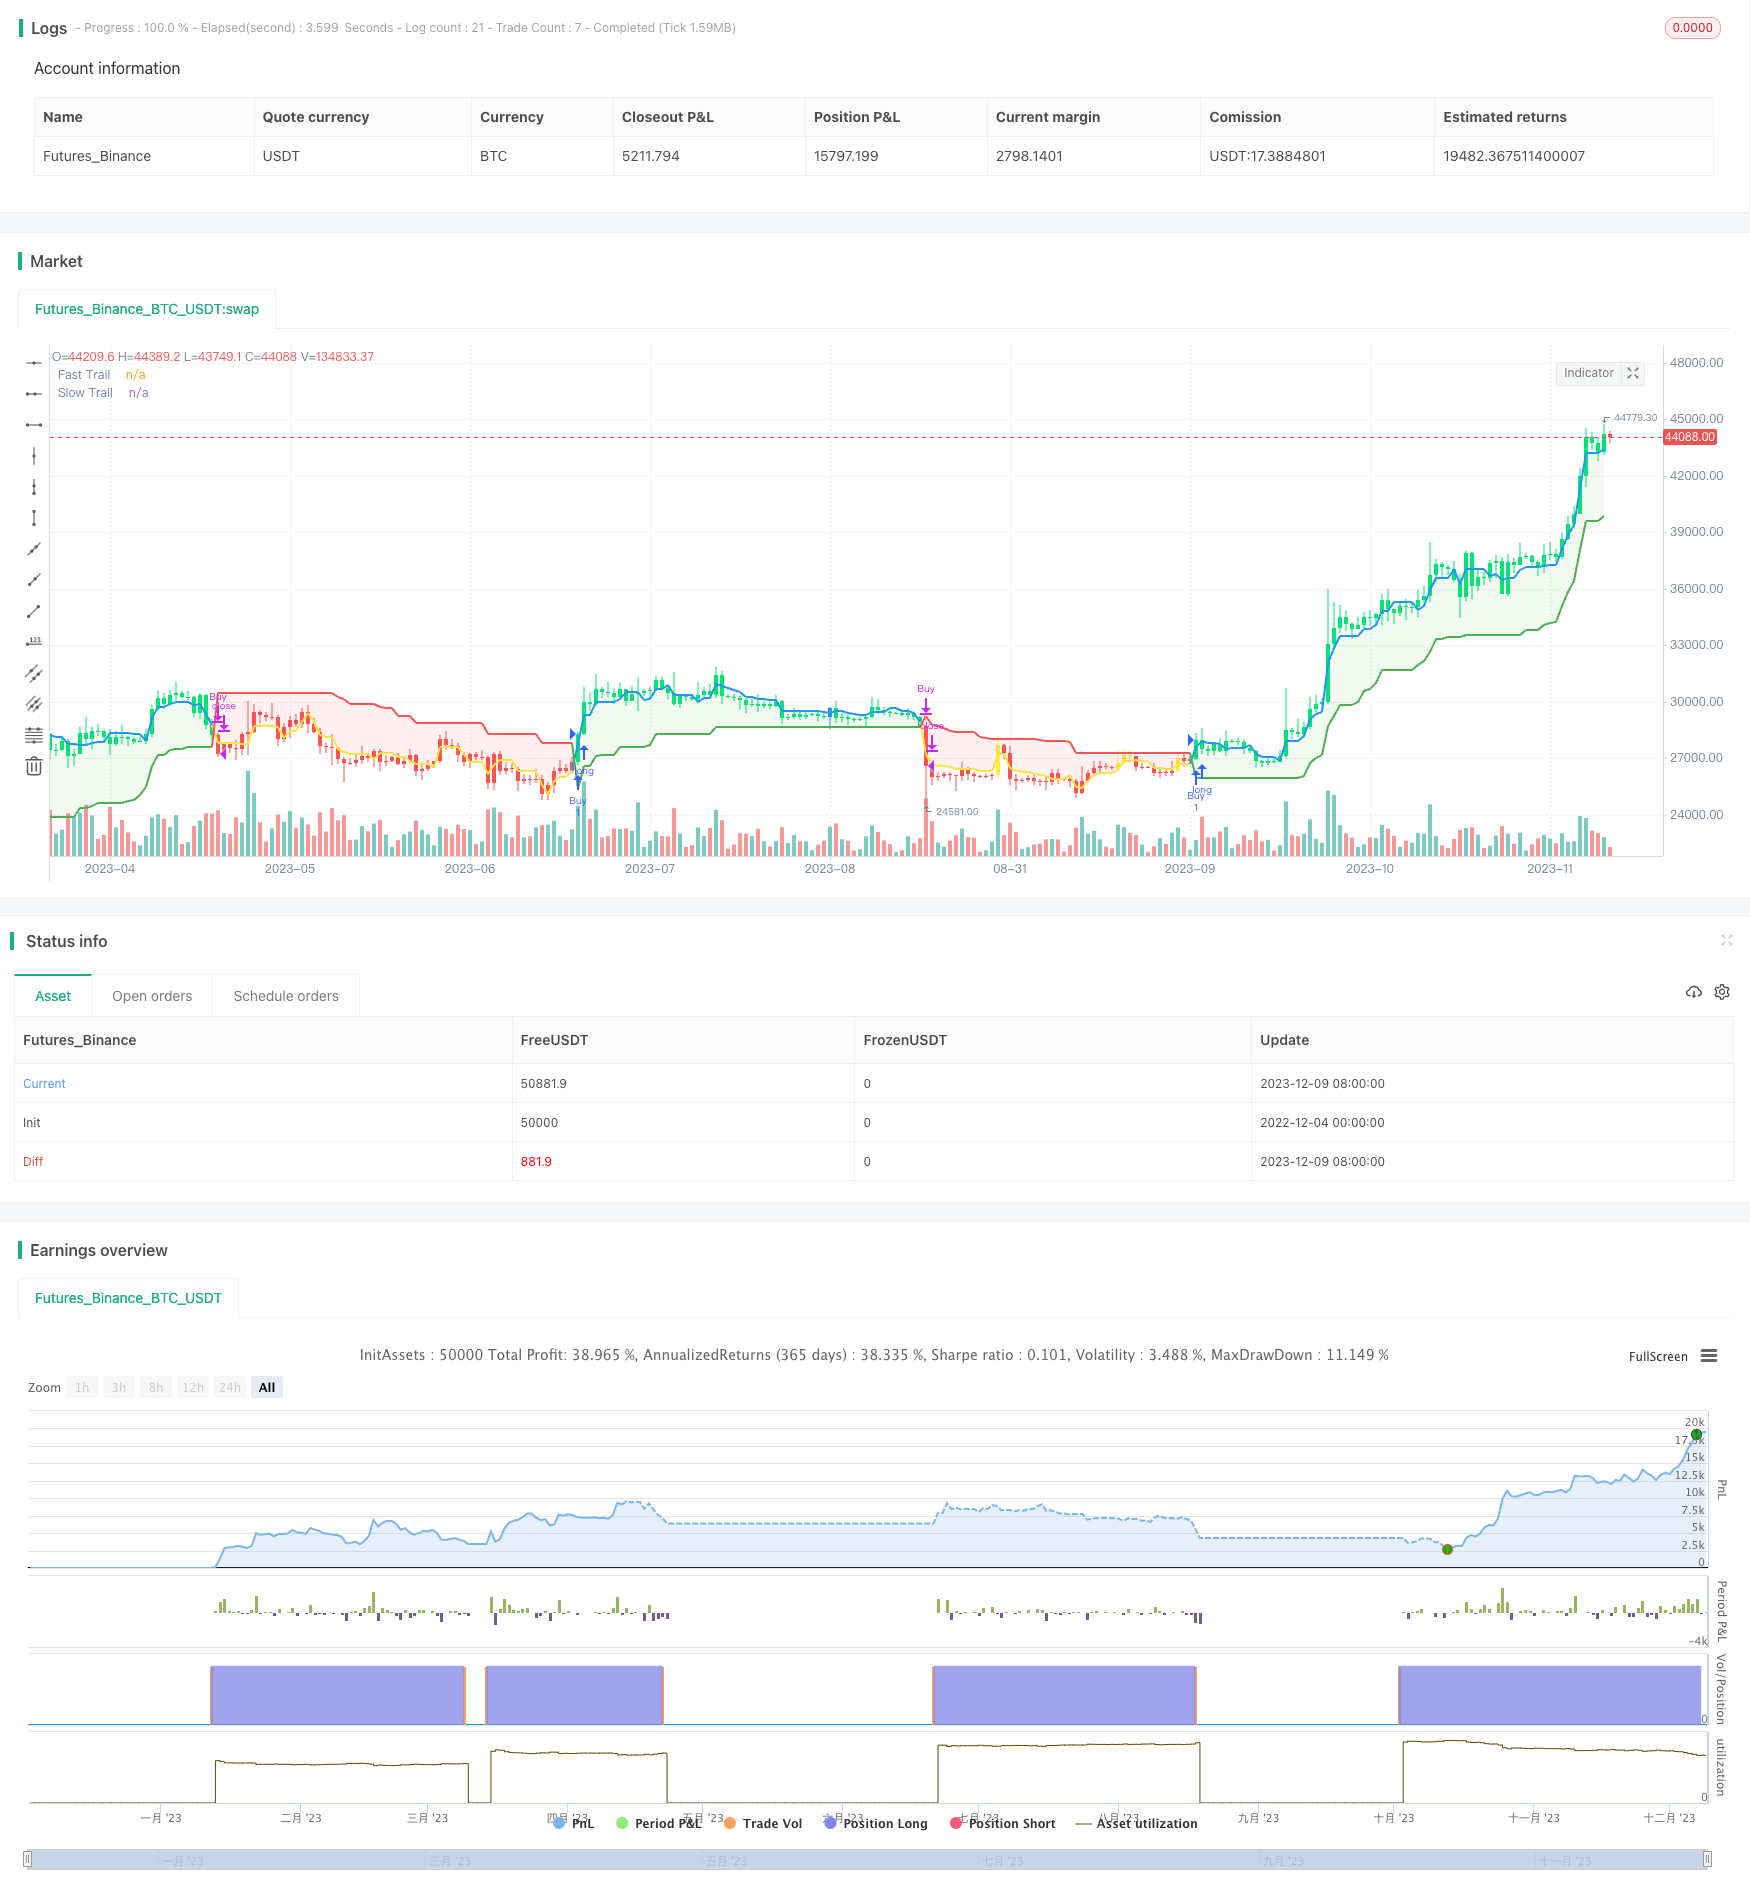
Overview
This strategy is based on the dynamic trailing stop loss mechanism designed with the ATR indicator to adjust the stop loss in real time while ensuring effective stop loss to maximize profits.
Strategy Logic
The strategy uses fast ATR period 5 and slow ATR period 10 to build a dual-layer dynamic trailing stop loss. When price runs in a favorable direction, the fast layer will activate trailing stop first to tighten the stop loss; when there is a short-term pullback, the slow layer stop loss can avoid premature stop out. Meanwhile, the crossover between the fast and slow layers serves as the trading signal.
Specifically, the stop loss distance of the fast layer is 0.5 times the 5-period ATR, and the stop loss distance of the slow layer is 3 times the 10-period ATR. A buy signal is generated when the fast layer breaks above the slow layer, and a sell signal is generated when the fast layer breaks below the slow layer. The stop loss line is also updated in real time and plotted below the price curve.
Advantage Analysis
The biggest advantage of this strategy is that it can dynamically adjust the stop loss position to maximize profits while ensuring effective stop loss. Compared with fixed stop loss distance, the dynamic ATR stop loss line can make adjustments based on the fluctuation of the market to reduce the probability of stop loss being triggered.
In addition, the dual-layer ATR design balances the sensitivity of stop loss. The fast layer responds quickly and the slow layer can filter out short-term noise to avoid premature stop loss.
Risk Analysis
The main risk of this strategy lies in whether the setting of stop loss distance is reasonable. If the ATR multiplier is set too high, the stop loss range will not keep up with the price movement. If the ATR multiplier is too small, it is prone to be stopped out by short-term noises. Therefore, parameters need to be adjusted according to the characteristics of different varieties.
In addition, in a range-bound market, the ATR value is smaller and the stop loss line is closer, which can easily lead to frequent stop loss. Therefore, this strategy is more suitable for varieties with certain volatility.
Optimization Directions
Different combinations of ATR cycle parameters can be tried to find the optimal balance. It can also consider combining with other indicators, such as trend indicators to judge the market stage, so as to dynamically adjust the size of ATR multiplier.
It is also possible to study alternatives to the ATR indicator, replacing ATR with DKVOL, HRANGE or ATR Percentage, etc may achieve better stop loss effect.
Summary
This strategy designs a dual-layer dynamic trailing mechanism based on the ATR indicator to maximize profits while avoiding excessive stop loss. It is suitable for users who have higher requirements for stop loss. This strategy can flexibly adjust parameters according to market and variety characteristics to achieve optimal stop loss effect.
Parameters
| Name | Default | What it controls |
|---|---|---|
| v_input_1_close | 0 | Source: close | high | low | open | hl2 | hlc3 | hlcc4 | ohlc4 |
| v_input_2 | 5 | Fast ATR period |
| v_input_3 | 0.5 | Fast ATR multiplier |
| v_input_4 | 10 | Slow ATR period |
| v_input_5 | 3 | Slow ATR multiplier |
| v_input_6 | true | Paint color on chart |
Source Pine Script
/*backtest
start: 2022-12-04 00:00:00
end: 2023-12-10 00:00:00
period: 1d
basePeriod: 1h
exchanges: [{"eid":"Futures_Binance","currency":"BTC_USDT"}]
*/

//@version=4
strategy("ATR Trailing Stop Strategy by ceyhun", overlay=true)

/////////notes////////////////////////////////////////
// This is based on the ATR trailing stop indicator //
// width addition of two levels of stops and        //
// different interpretation.                        //
// This is a fast-reacting system and is better     //
// suited for higher volatility markets             //
//////////////////////////////////////////////////////

SC = input(close, "Source", input.source)

// Fast Trail //
AP1 = input(5, "Fast ATR period", input.integer)  // ATR Period
AF1 = input(0.5, "Fast ATR multiplier", input.float)  // ATR Factor
SL1 = AF1 * atr(AP1)  // Stop Loss
Trail1 = 0.0
Trail1 := iff(SC > nz(Trail1[1], 0) and SC[1] > nz(Trail1[1], 0), max(nz(Trail1[1], 0), SC - SL1), iff(SC < nz(Trail1[1], 0) and SC[1] < nz(Trail1[1], 0), min(nz(Trail1[1], 0), SC + SL1), iff(SC > nz(Trail1[1], 0), SC - SL1, SC + SL1)))

// Slow Trail //
AP2 = input(10, "Slow ATR period", input.integer)  // ATR Period
AF2 = input(3, "Slow ATR multiplier", input.float)  // ATR Factor
SL2 = AF2 * atr(AP2)  // Stop Loss
Trail2 = 0.0
Trail2 := iff(SC > nz(Trail2[1], 0) and SC[1] > nz(Trail2[1], 0), max(nz(Trail2[1], 0), SC - SL2), iff(SC < nz(Trail2[1], 0) and SC[1] < nz(Trail2[1], 0), min(nz(Trail2[1], 0), SC + SL2), iff(SC > nz(Trail2[1], 0), SC - SL2, SC + SL2)))

// Bar color for trade signal //
Green = Trail1 > Trail2 and close > Trail2 and low > Trail2
Blue = Trail1 > Trail2 and close > Trail2 and low < Trail2
Red = Trail2 > Trail1 and close < Trail2 and high < Trail2
Yellow = Trail2 > Trail1 and close < Trail2 and high > Trail2

// Signals //
Bull = barssince(Green) < barssince(Red)

Buy = crossover(Trail1, Trail2)
Sell = crossunder(Trail1, Trail2)

TS1 = plot(Trail1, "Fast Trail", style=plot.style_line, color=Trail1 > Trail2 ? color.blue : color.yellow, linewidth=2, display=display.none)
TS2 = plot(Trail2, "Slow Trail", style=plot.style_line, color=Trail1 > Trail2 ? color.green : color.red, linewidth=2)
fill(TS1, TS2, Bull ? color.new(color.green, 90) : color.new(color.red, 90))

plotcolor = input(true, "Paint color on chart", input.bool)

bcl = iff(plotcolor == 1, Blue ? color.blue : Green ? color.lime : Yellow ? color.yellow : Red ? color.red : color.white, na)
barcolor(bcl)

if Buy
    strategy.entry("Buy", strategy.long, comment="Buy")

if Sell
    strategy.close("Buy")
Published by ChaoZhang on the FMZ strategy square · last modified 2023-12-11. Collected in the Quant Trading Vault. Unvalidated research: re-test with your own data and costs before trusting it.
Build this with AgenKit
A spec is not a trading system. Paste this into your coding agent and AgenKit runs a specialist team — architecture, test-first build, risk gates, review — with paper trading on by default.
/agenkit build a production-grade trading bot with a backtest engine, risk controls and paper trading by default from strategies/Dynamic-ATR-Trailing-Stop-Loss-Strategy.md- npx agenkit install engineering-kit in your project
- Paste the command into your agent and approve each phase
- Get tests, backtest, risk controls and a paper-trading switch
Understand it first
Before you run this, read the lesson behind the idea and how to backtest it honestly. Specs like this one are the survivors of an unknown number of trials; deflate their results accordingly.
Related specs
- ATR Dynamic Profit Target and Stop Loss StrategyPine Script · Trend following · 1d
- ATR Dynamic Trend Following and EMA Crossover Trading StrategyPine Script · Trend following · 1d
- ATR and Moving Average Crossover Hybrid StrategyPine Script · Trend following · 1h
- ATR and T3 Moving Average StrategyPine Script · Trend following · 5m
- Adaptive ATR and RSI Trend Following Strategy with Trailing Stop LossPine Script · Trend following · 1h
- Adaptive Risk Management Strategy Based on Dynamic ATR and Moving Average CrossoverPine Script · Trend following · 2h