Strategy vault / Machine learning
Dynamic RSI Oscillation Trading Strategy
This strategy combines dynamic support/resistance levels and the relative strength index (RSI) indicator. It sets overbought/oversold thresholds for RSI and generates buy/sell signals when price breaks the dynamic…
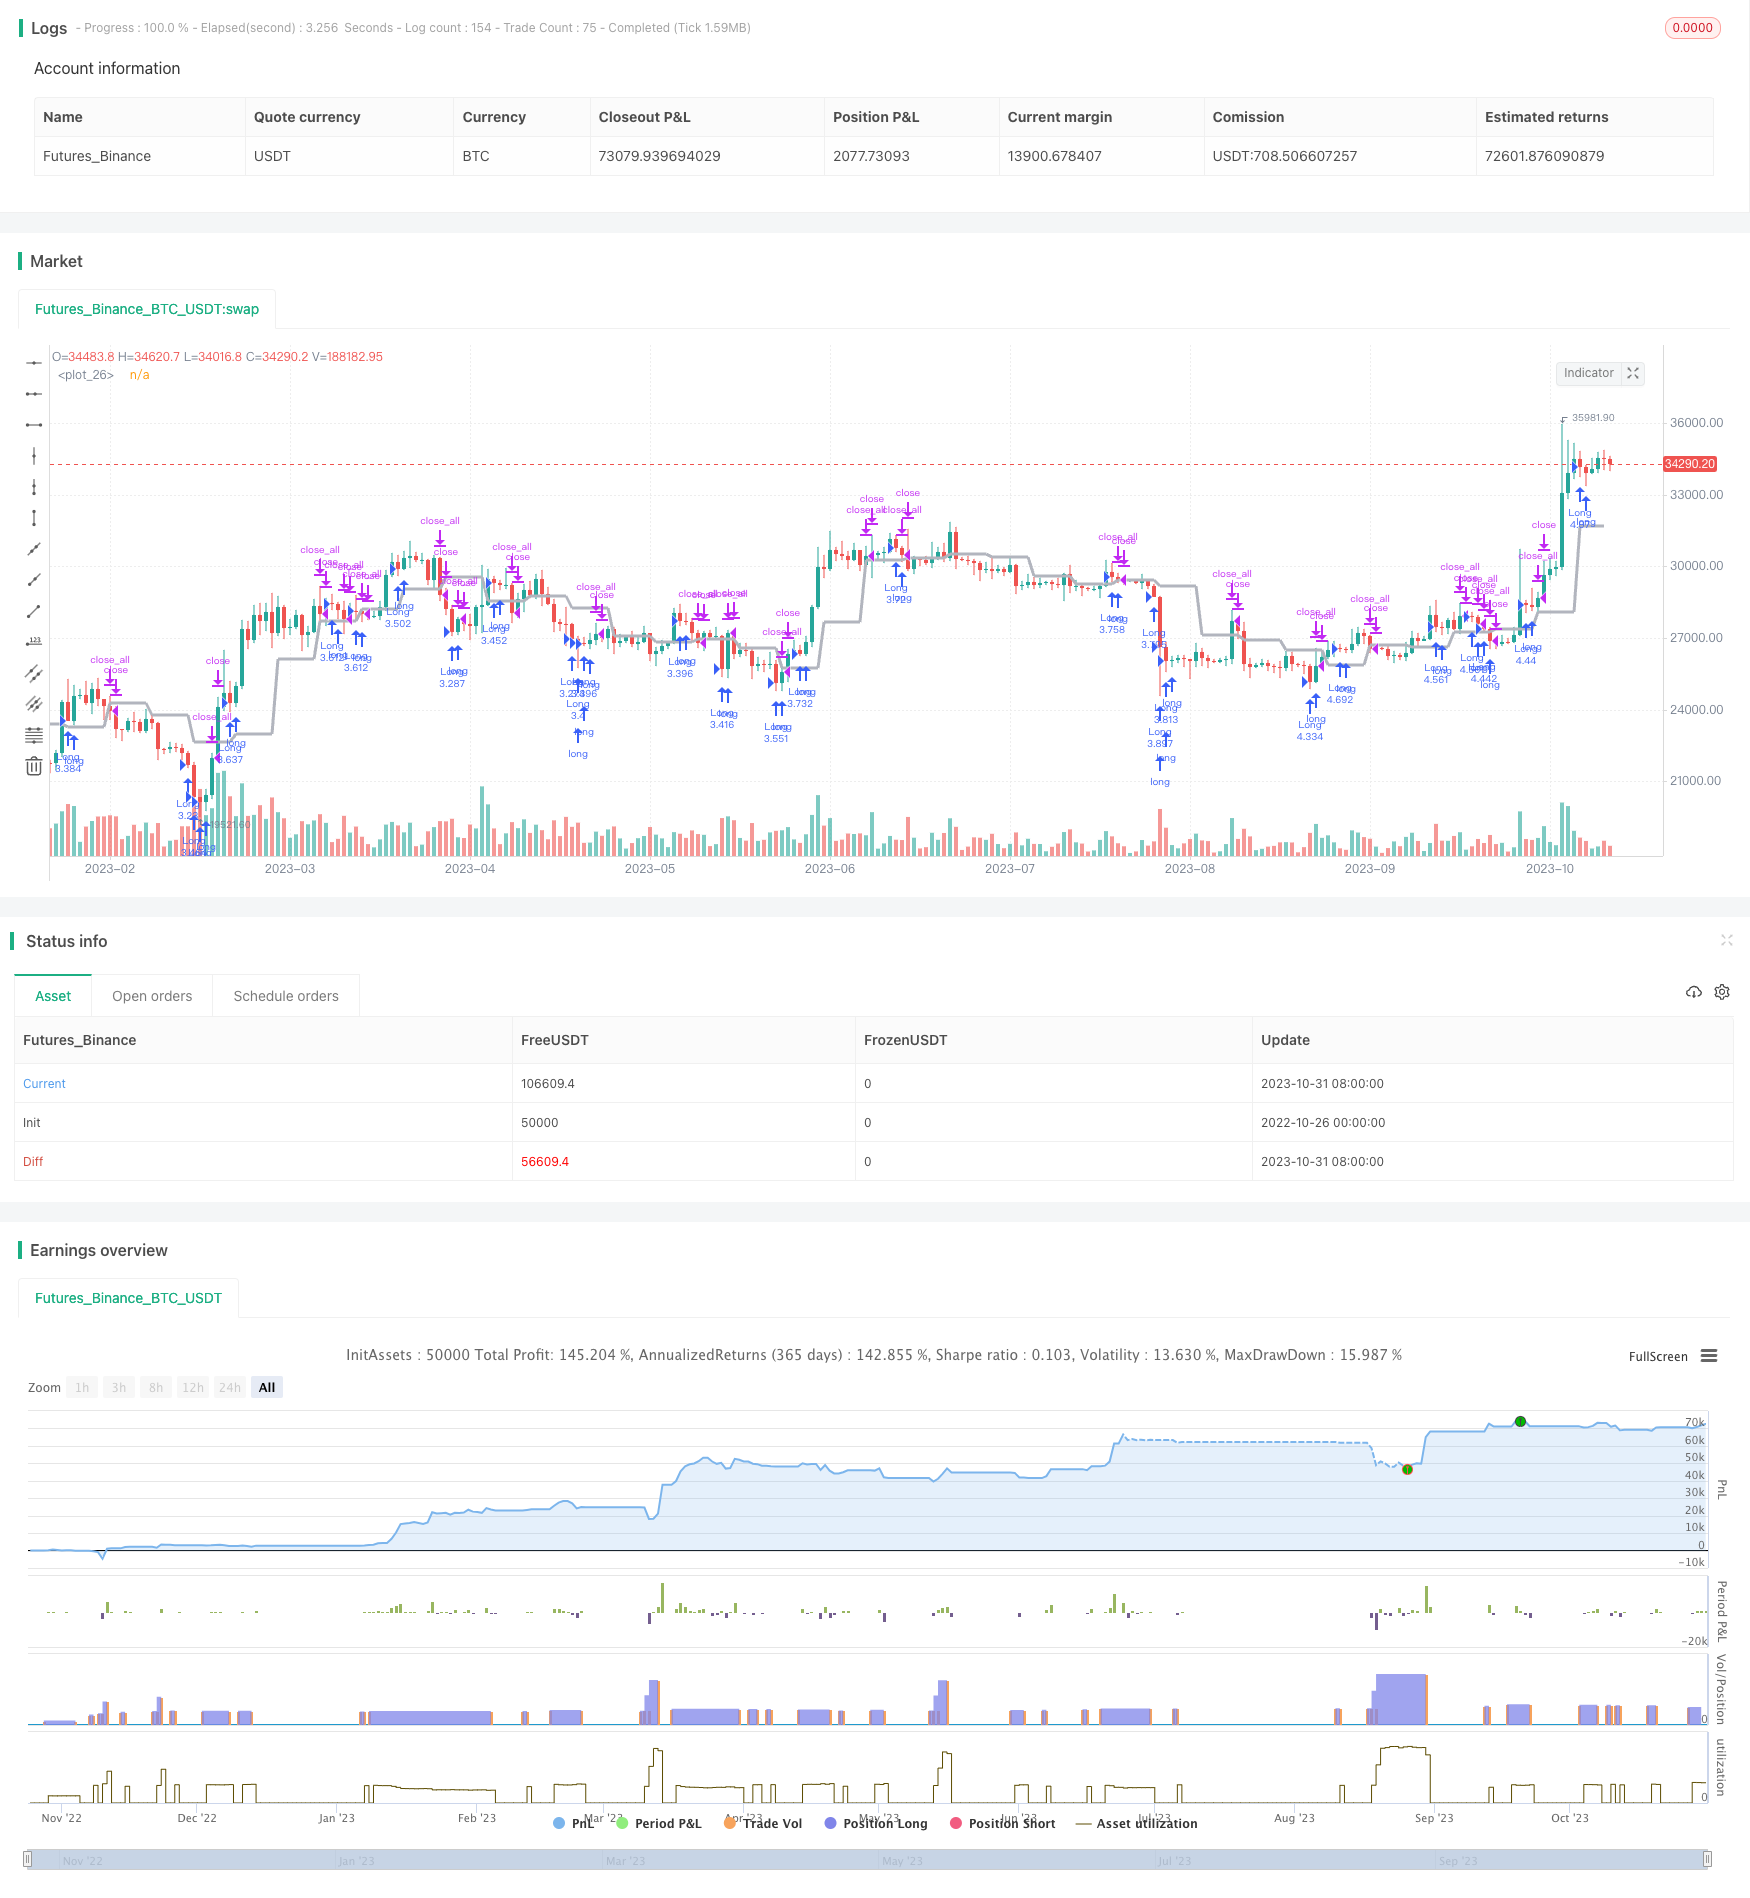
Overview
This strategy combines dynamic support/resistance levels and the relative strength index (RSI) indicator. It sets overbought/oversold thresholds for RSI and generates buy/sell signals when price breaks the dynamic support/resistance levels while RSI is not in the overbought/oversold area.
Principles
1. Dynamic Support/Resistance
Use the security function to get closing price as dynamic support/resistance levels. Trading signals are generated when price breaks through these dynamic levels.
2. RSI Indicator
Calculate the average gain and average loss over a certain period to generate RSI values and determine if RSI reaches the overbought/oversold area.
3. Trading Signals
When price breaks the dynamic levels, if RSI is not in the overbought/oversold area, buy/sell signals are generated. Otherwise, the breakout signals are ignored.
4. Exit Signals
Close positions when price falls back to the dynamic level, or when RSI returns to normal range.
Advantage Analysis
Use dynamic support/resistance to determine trend direction for higher winning rate.
RSI filters out false breakouts and avoids false entries.
Combining trend and indicator makes the strategy adaptable to different market conditions.
Simple and clear rules make it easy to implement.
Risks and Solutions
Multiple tests of dynamic levels may generate false signals. Widen the breakout range to filter.
Solo RSI may cause misjudgement. Add other indicators for combo filtering.
Frequent trading in range-bound market leads to higher costs. Widen RSI's normal range to lower frequency.
Improper parameter settings lead to missing or false signals. Optimize parameters based on different assets.
Optimization Directions
Use machine learning to auto optimize RSI parameters.
Add stop loss/profit taking strategy to lock in profits and reduce losses.
Incorporate more indicators for combo filtering to improve stability.
Add volatility indicator to lower position size when volatility is low.
Optimize position sizing algorithm to dynamically adjust positions for different market environments.
Summary
This strategy combines trend judgment and indicator filtering to effectively identify trend reversal around key levels while controlling risks. Further optimizations on parameter tuning, stop loss/profit taking, more indicators etc. can improve its stability and adaptability to generate steady profits in a wider range of markets.
Parameters
| Name | Default | What it controls |
|---|---|---|
| v_input_1 | true | Long |
| v_input_2 | true | Short |
| v_input_3 | 100 | Capital, % |
| v_input_4 | W | timeframe 1 |
| v_input_5_ohlc4 | 0 | Source: ohlc4 | high | low | open | hl2 | hlc3 | hlcc4 | close |
| v_input_6 | true | antipila |
| v_input_7 | true | color filter |
| v_input_8 | 7 | RSI Period |
| v_input_9 | 30 | RSI Limit |
| v_input_10 | 1900 | From Year |
| v_input_11 | 2100 | To Year |
| v_input_12 | true | From Month |
| v_input_13 | 12 | To Month |
| v_input_14 | true | From day |
| v_input_15 | 31 | To day |
Source Pine Script
/*backtest
start: 2022-10-26 00:00:00
end: 2023-11-01 00:00:00
period: 1d
basePeriod: 1h
exchanges: [{"eid":"Futures_Binance","currency":"BTC_USDT"}]
*/

//Noro
//2018

//@version=2
strategy(title = "Noro's Levels+RSI Strategy v1.0", shorttitle = "Levels+RSI str 1.0", overlay = true, default_qty_type = strategy.percent_of_equity, default_qty_value = 100, pyramiding = 3)

//Settings
needlong = input(true, defval = true, title = "Long")
needshort = input(true, defval = true, title = "Short")
capital = input(100, defval = 100, minval = 1, maxval = 10000, title = "Capital, %")
tf = input('W', title = "timeframe 1")
src = input(ohlc4, "Source")
ap = input(true, defval = true, title = "antipila")
cf = input(true, defval = true, title = "color filter")
rsiperiod = input(7, defval = 7, minval = 2, maxval = 100, title = "RSI Period")
rsilimit = input(30, defval = 30, minval = 1, maxval = 50, title = "RSI Limit")
fromyear = input(1900, defval = 1900, minval = 1900, maxval = 2100, title = "From Year")
toyear = input(2100, defval = 2100, minval = 1900, maxval = 2100, title = "To Year")
frommonth = input(01, defval = 01, minval = 01, maxval = 12, title = "From Month")
tomonth = input(12, defval = 12, minval = 01, maxval = 12, title = "To Month")
fromday = input(01, defval = 01, minval = 01, maxval = 31, title = "From day")
today = input(31, defval = 31, minval = 01, maxval = 31, title = "To day")

//Level
level = request.security(syminfo.tickerid, tf, src[1])
plot(level, linewidth = 3, color = silver)

//RSI
uprsi = rma(max(change(close), 0), rsiperiod)
dnrsi = rma(-min(change(close), 0), rsiperiod)
rsi = dnrsi == 0 ? 100 : uprsi == 0 ? 0 : 100 - (100 / (1 + uprsi / dnrsi))

//Level Signals
ls = close > level and ap == false ? true : low > level ? true : false
up1 = strategy.position_size == 0 and ls and (close < open or cf == false)
exit1 = close < level and ap == false ? true : high < level ? true : false

//RSI Signal

up2 = rsi < rsilimit and (close < open or cf == false)
exit2 = rsi > rsilimit and ls == false

//Trading
lot = strategy.position_size != strategy.position_size[1] ? strategy.equity / close * capital / 100 : lot[1]

if up1 or up2
    strategy.entry("Long", strategy.long, needlong == false ? 0 : lot)

if  (exit1 and rsi > rsilimit) or exit2
    strategy.close_all()
Published by ChaoZhang on the FMZ strategy square · last modified 2023-11-02. Collected in the Quant Trading Vault. Unvalidated research: re-test with your own data and costs before trusting it.
Build this with AgenKit
A spec is not a trading system. Paste this into your coding agent and AgenKit runs a specialist team — architecture, test-first build, risk gates, review — with paper trading on by default.
/agenkit build a production-grade trading bot with a backtest engine, risk controls and paper trading by default from strategies/Dynamic-RSI-Oscillation-Trading-Strategy.md- npx agenkit install engineering-kit in your project
- Paste the command into your agent and approve each phase
- Get tests, backtest, risk controls and a paper-trading switch
Understand it first
Before you run this, read the lesson behind the idea and how to backtest it honestly. Specs like this one are the survivors of an unknown number of trials; deflate their results accordingly.
Related specs
- AI Powered Volatility Price System Divergence Trading StrategyPine Script · Machine learning · 1h
- Double Decker RSI Trading StrategyPine Script · Machine learning · 1h
- Fibonacci HMA AI Buy Sell Signal StrategyPine Script · Machine learning · 1d
- High Frequency Hybrid Technical Analysis Quantitative StrategyPine Script · Machine learning · 15m
- Multi indicator Assisted StrategyPine Script · Machine learning · 1d
- Quantitative Trading Strategy Based on 5 day Moving Average Band and GBS Buy Sell SignalsPine Script · Machine learning · 4h