Strategy vault / Trend following
Dynamic RSI Quantitative Trading Strategy with Multiple Moving Average Crossover
This is a quantitative trading strategy that combines the Relative Strength Index (RSI) with multiple moving averages. The strategy primarily identifies market trends by monitoring crossover signals between different…
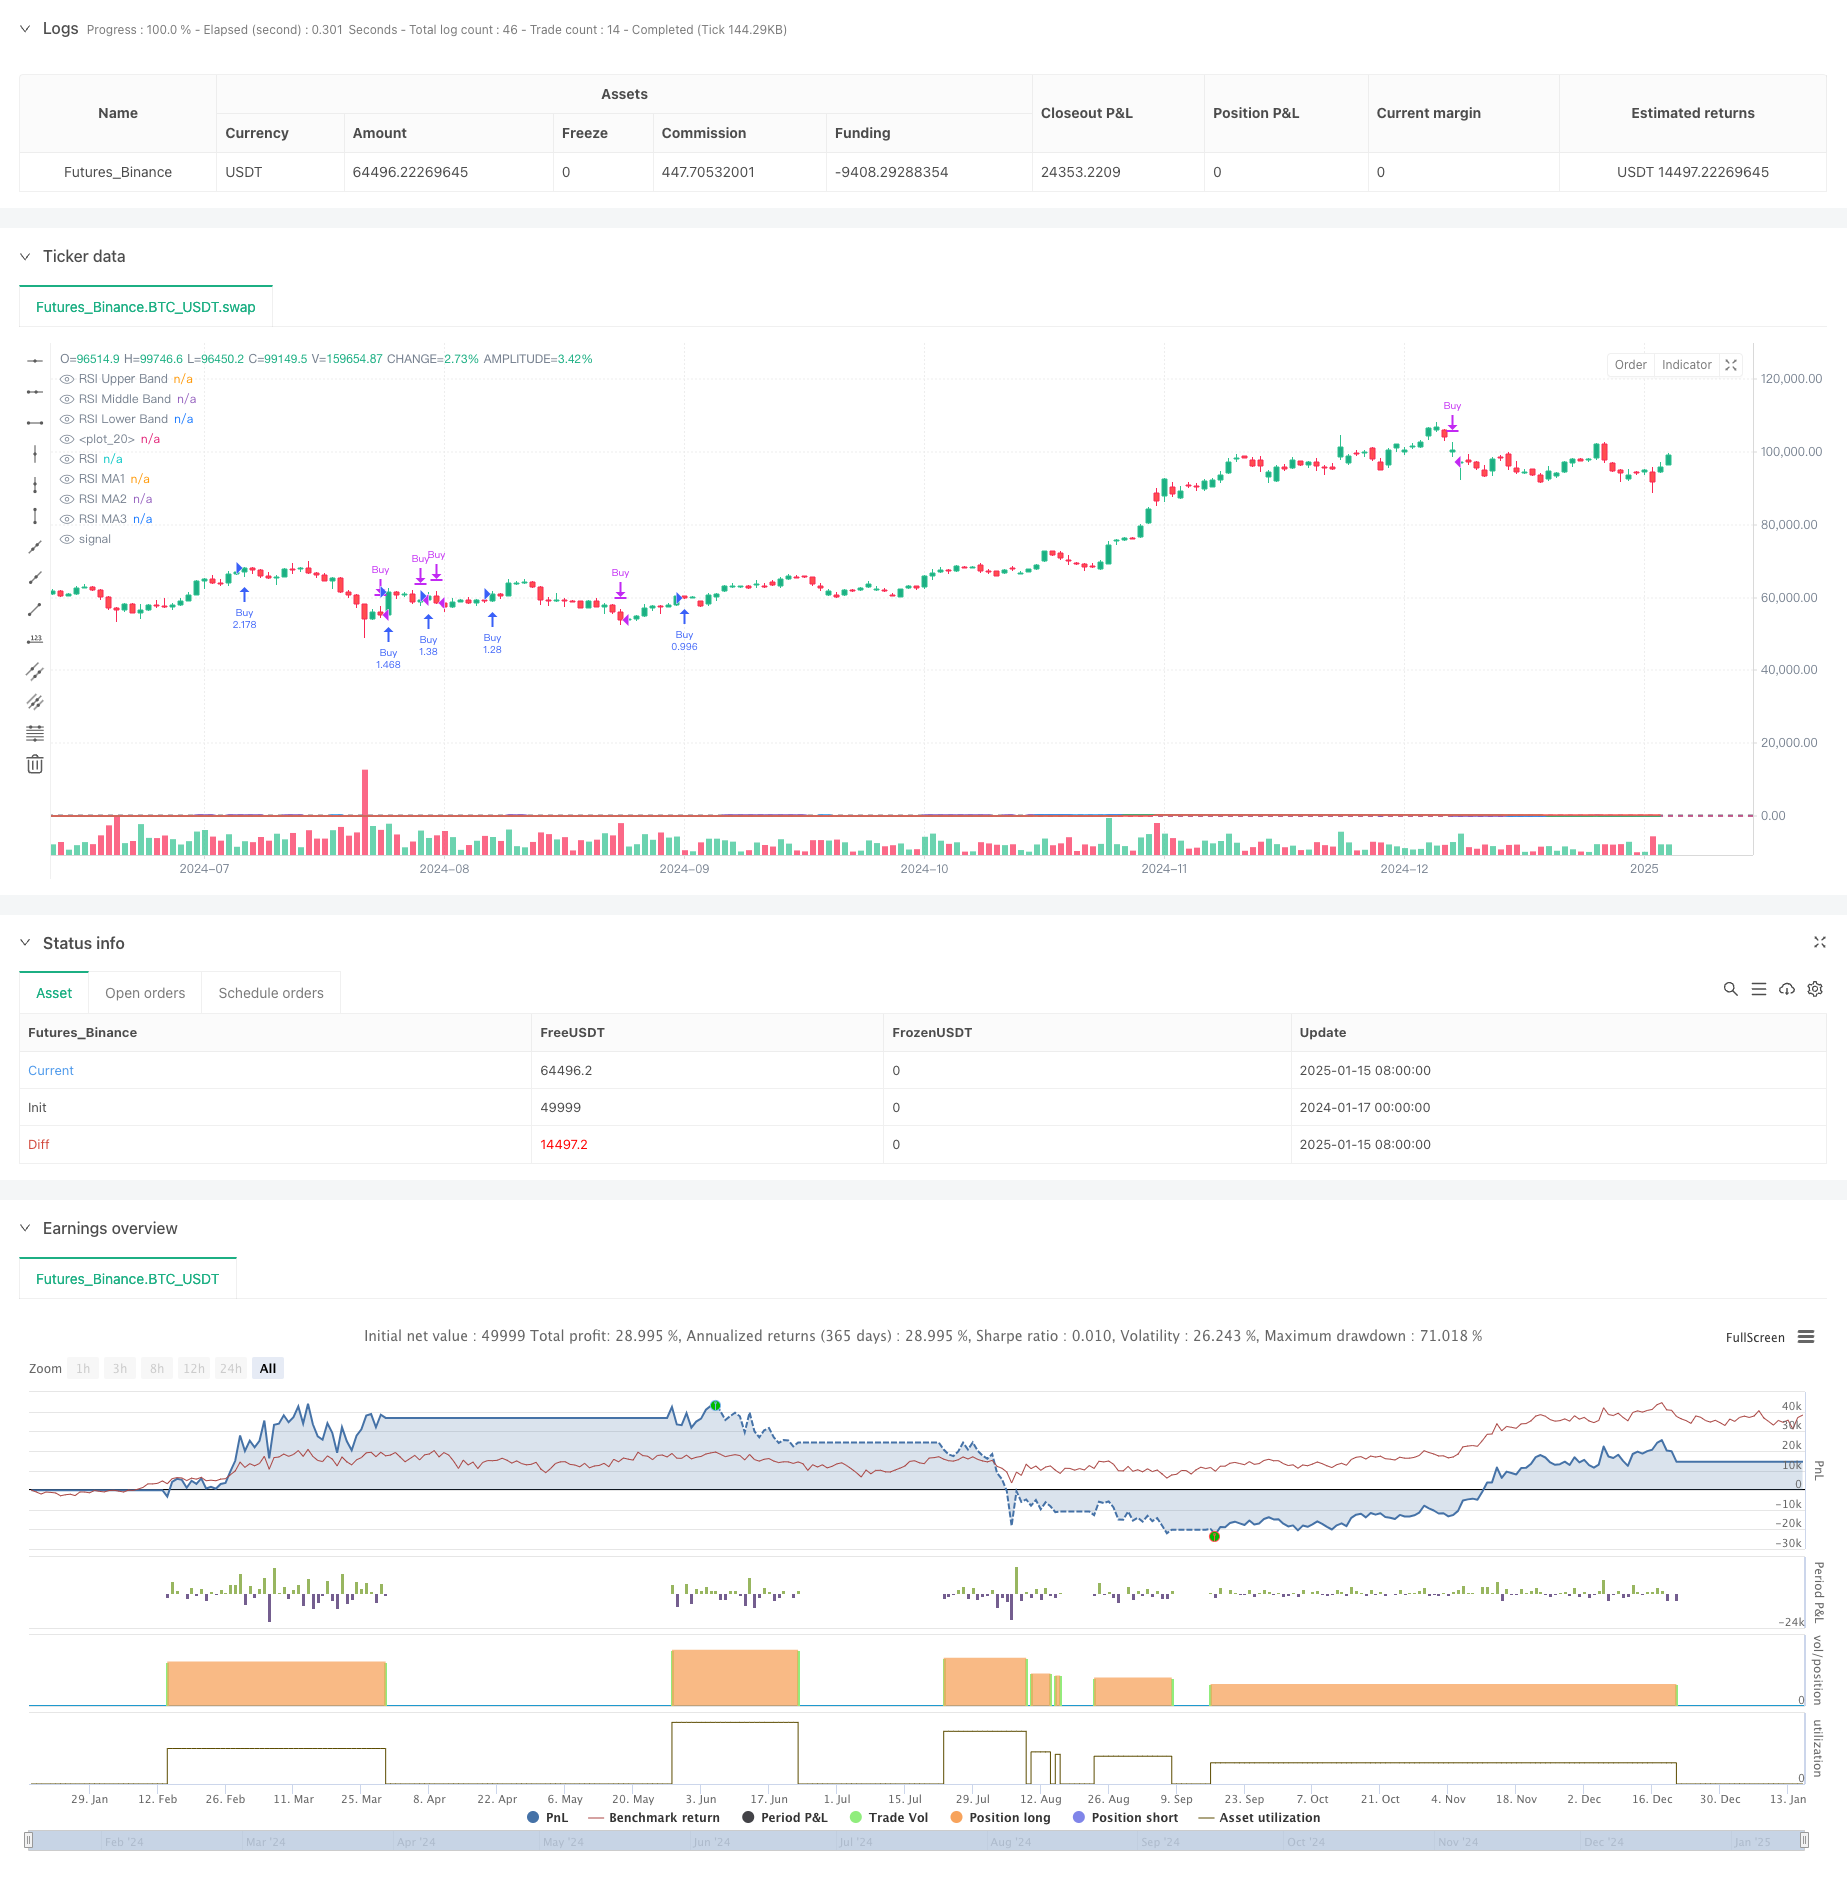
Overview
This is a quantitative trading strategy that combines the Relative Strength Index (RSI) with multiple moving averages. The strategy primarily identifies market trends by monitoring crossover signals between different types of moving averages (including SMA, EMA, WMA, and SMMA) on the RSI indicator, while using RSI's overbought and oversold zones as supplementary decision criteria.
Strategy Principles
The strategy includes several key calculation steps:
- Calculate 14-period RSI with overbought level at 70 and oversold level at 30
- Calculate three different moving averages on the RSI curve:
- MA1: 20-period, choice of SMA/EMA/WMA/SMMA
- MA2: 50-period, choice of SMA/EMA/WMA/SMMA
- MA3: 100-period, choice of SMA/EMA/WMA/SMMA
- Trading signal generation rules:
- Buy signal: When MA2 crosses above MA3
- Sell signal: When MA2 crosses below MA3
- Simultaneously detect RSI divergences for additional reference
Strategy Advantages
- Multiple technical indicator cross-validation improves signal reliability
- Flexible moving average types and parameters
- RSI divergence detection helps identify market turning points early
- Percentage-based position management for effective risk control
- Excellent visualization for analysis and backtesting
Strategy Risks
- Moving average crossovers may have lag effects
- False signals may occur in ranging markets
- RSI distortion under certain market conditions
- Improper parameter selection may lead to excessive or insufficient trading signals Risk mitigation:
- Recommend cross-validation with market trends and volume
- Optimize trading frequency through moving average parameter adjustment
- Set stop-loss and take-profit levels for risk control
Strategy Optimization Directions
- Signal filtering optimization:
- Add trend confirmation indicators
- Incorporate volume analysis
- Parameter dynamic optimization:
- Automatically adjust RSI and MA parameters based on market volatility
- Introduce adaptive period calculation methods
- Risk control optimization:
- Develop dynamic stop-loss and take-profit mechanisms
- Design dynamic position management system
Summary
The strategy builds an adaptive trading system by combining RSI and multiple moving averages. Its core advantages lie in the cross-validation of multiple technical indicators and flexible parameter configuration, while attention must be paid to moving average lag and market condition impacts on strategy performance. Through continuous optimization and risk control, this strategy shows promise for stable performance in actual trading.
Source Pine Script
/*backtest
start: 2024-01-17 00:00:00
end: 2025-01-16 00:00:00
period: 1d
basePeriod: 1d
exchanges: [{"eid":"Futures_Binance","currency":"BTC_USDT","balance":49999}]
*/

//@version=6
strategy(title="Relative Strength Index with MA Strategy", shorttitle="RSI-MA Strategy", overlay=true, default_qty_type=strategy.percent_of_equity, default_qty_value=200)

// RSI Inputs
rsiLengthInput = input.int(14, minval=1, title="RSI Length", group="RSI Settings")
rsiSourceInput = input.source(close, "Source", group="RSI Settings")
calculateDivergence = input.bool(false, title="Calculate Divergence", group="RSI Settings", tooltip="Calculating divergences is needed in order for divergence alerts to fire.")

// RSI Calculation
change_rsi = ta.change(rsiSourceInput)
up = ta.rma(math.max(change_rsi, 0), rsiLengthInput)
down = ta.rma(-math.min(change_rsi, 0), rsiLengthInput)
rsi = down == 0 ? 100 : up == 0 ? 0 : 100 - (100 / (1 + up / down))

// RSI Plot
plot(rsi, "RSI", color=#7E57C2)
hline(70, "RSI Upper Band", color=#787B86)
hline(50, "RSI Middle Band", color=color.new(#787B86, 50))
hline(30, "RSI Lower Band", color=#787B86)
fill(hline(70), hline(30), color=color.rgb(126, 87, 194, 90), title="RSI Background Fill")

// RSI-based MA Inputs
grpRSIMovingAverages = "RSI Moving Averages"
ma1Length = input.int(20, title="MA1 Length", group=grpRSIMovingAverages)
ma2Length = input.int(50, title="MA2 Length", group=grpRSIMovingAverages)
ma3Length = input.int(100, title="MA3 Length", group=grpRSIMovingAverages)
ma1Type = input.string("SMA", title="MA1 Type", options=["SMA", "EMA", "WMA", "SMMA"], group=grpRSIMovingAverages)
ma2Type = input.string("EMA", title="MA2 Type", options=["SMA", "EMA", "WMA", "SMMA"], group=grpRSIMovingAverages)
ma3Type = input.string("WMA", title="MA3 Type", options=["SMA", "EMA", "WMA", "SMMA"], group=grpRSIMovingAverages)

// MA Calculation Function
calcMA(source, length, type) =>
    switch type
        "SMA" => ta.sma(source, length)
        "EMA" => ta.ema(source, length)
        "WMA" => ta.wma(source, length)
        "SMMA" => ta.rma(source, length)

// MA Calculations
ma1 = calcMA(rsi, ma1Length, ma1Type)
ma2 = calcMA(rsi, ma2Length, ma2Type)
ma3 = calcMA(rsi, ma3Length, ma3Type)

// MA Plots
plot(ma1, title="RSI MA1", color=color.blue)
plot(ma2, title="RSI MA2", color=color.green)
plot(ma3, title="RSI MA3", color=color.red)

// Divergence (Retained from original script)
lookbackRight = 5
lookbackLeft = 5
rangeUpper = 60
rangeLower = 5
bearColor = color.red
bullColor = color.green
textColor = color.white
noneColor = color.new(color.white, 100)

_inRange(bool cond) =>
    bars = ta.barssince(cond)
    rangeLower <= bars and bars <= rangeUpper

plFound = false
phFound = false

bullCond = false
bearCond = false

rsiLBR = rsi[lookbackRight]

if calculateDivergence
    // Regular Bullish
    plFound := not na(ta.pivotlow(rsi, lookbackLeft, lookbackRight))
    rsiHL = rsiLBR > ta.valuewhen(plFound, rsiLBR, 1) and _inRange(plFound[1])
    lowLBR = low[lookbackRight]
    priceLL = lowLBR < ta.valuewhen(plFound, lowLBR, 1)
    bullCond := priceLL and rsiHL and plFound

    // Regular Bearish
    phFound := not na(ta.pivothigh(rsi, lookbackLeft, lookbackRight))
    rsiLH = rsiLBR < ta.valuewhen(phFound, rsiLBR, 1) and _inRange(phFound[1])
    highLBR = high[lookbackRight]
    priceHH = highLBR > ta.valuewhen(phFound, highLBR, 1)
    bearCond := priceHH and rsiLH and phFound

// plot(
//      plFound ? rsiLBR : na,
//      offset=-lookbackRight,
//      title="Regular Bullish",
//      linewidth=2,
//      color=(bullCond ? bullColor : noneColor),
//      display = display.pane
//      )

plotshape(
     bullCond ? rsiLBR : na,
     offset=-lookbackRight,
     title="Regular Bullish Label",
     text=" Bull ",
     style=shape.labelup,
     location=location.absolute,
     color=bullColor,
     textcolor=textColor
     )

// plot(
//      phFound ? rsiLBR : na,
//      offset=-lookbackRight,
//      title="Regular Bearish",
//      linewidth=2,
//      color=(bearCond ? bearColor : noneColor),
//      display = display.pane
//      )

plotshape(
     bearCond ? rsiLBR : na,
     offset=-lookbackRight,
     title="Regular Bearish Label",
     text=" Bear ",
     style=shape.labeldown,
     location=location.absolute,
     color=bearColor,
     textcolor=textColor
     )

alertcondition(bullCond, title='Regular Bullish Divergence', message="Found a new Regular Bullish Divergence, `Pivot Lookback Right` number of bars to the left of the current bar.")
alertcondition(bearCond, title='Regular Bearish Divergence', message='Found a new Regular Bearish Divergence, `Pivot Lookback Right` number of bars to the left of the current bar.')

// ----- MUA/BÁN -----

// Điều kiện Mua: MA2 cắt lên MA3 và MA3 < 55
buyCondition = ta.crossover(ma2, ma3)

// Điều kiện Bán: MA2 cắt xuống MA3 và MA3 > 40
sellCondition = ta.crossunder(ma2, ma3)

// Thực hiện lệnh Mua/Bán
if (buyCondition)
    strategy.entry("Buy", strategy.long, comment="Buy Signal")

if (sellCondition)
    strategy.close("Buy", comment="Sell Signal")


// ----- KẾT THÚC -----
Published by ChaoZhang on the FMZ strategy square · last modified 2025-01-17. Collected in the Quant Trading Vault. Unvalidated research: re-test with your own data and costs before trusting it.
Build this with AgenKit
A spec is not a trading system. Paste this into your coding agent and AgenKit runs a specialist team — architecture, test-first build, risk gates, review — with paper trading on by default.
/agenkit build a production-grade trading bot with a backtest engine, risk controls and paper trading by default from strategies/Dynamic-RSI-Quantitative-Trading-Strategy-with-Multiple-Moving-Average-Crossover.md- npx agenkit install engineering-kit in your project
- Paste the command into your agent and approve each phase
- Get tests, backtest, risk controls and a paper-trading switch
Understand it first
Before you run this, read the lesson behind the idea and how to backtest it honestly. Specs like this one are the survivors of an unknown number of trials; deflate their results accordingly.
Related specs
- EMA AROON ASHPine Script · Trend following · 3m
- Fixed Range Volume Profile And Anchored VWAP Trend Identification Strategy With Dynamic Stop LossPine Script · Trend following · 1h
- Trend Tracking and Short term Trading Strategy Based on ADX IndicatorPine Script · Trend following · 1d
- Multi Period Trend Confirmation Dynamic Risk Control Quantitative Trading StrategyPine Script · Trend following · 1h
- Multi indicator Adaptive Trend Trading StrategyPine Script · Trend following · 1d
- MOST Indicator Dual Position Adaptive StrategyPine Script · Trend following · 4h