Strategy vault / Trend following
Dynamic Trend Following Strategy
This strategy utilizes the Supertrend indicator to capture market trends. The Supertrend indicator combines price and volatility, with a green line indicating an uptrend and a red line indicating a downtrend. The…
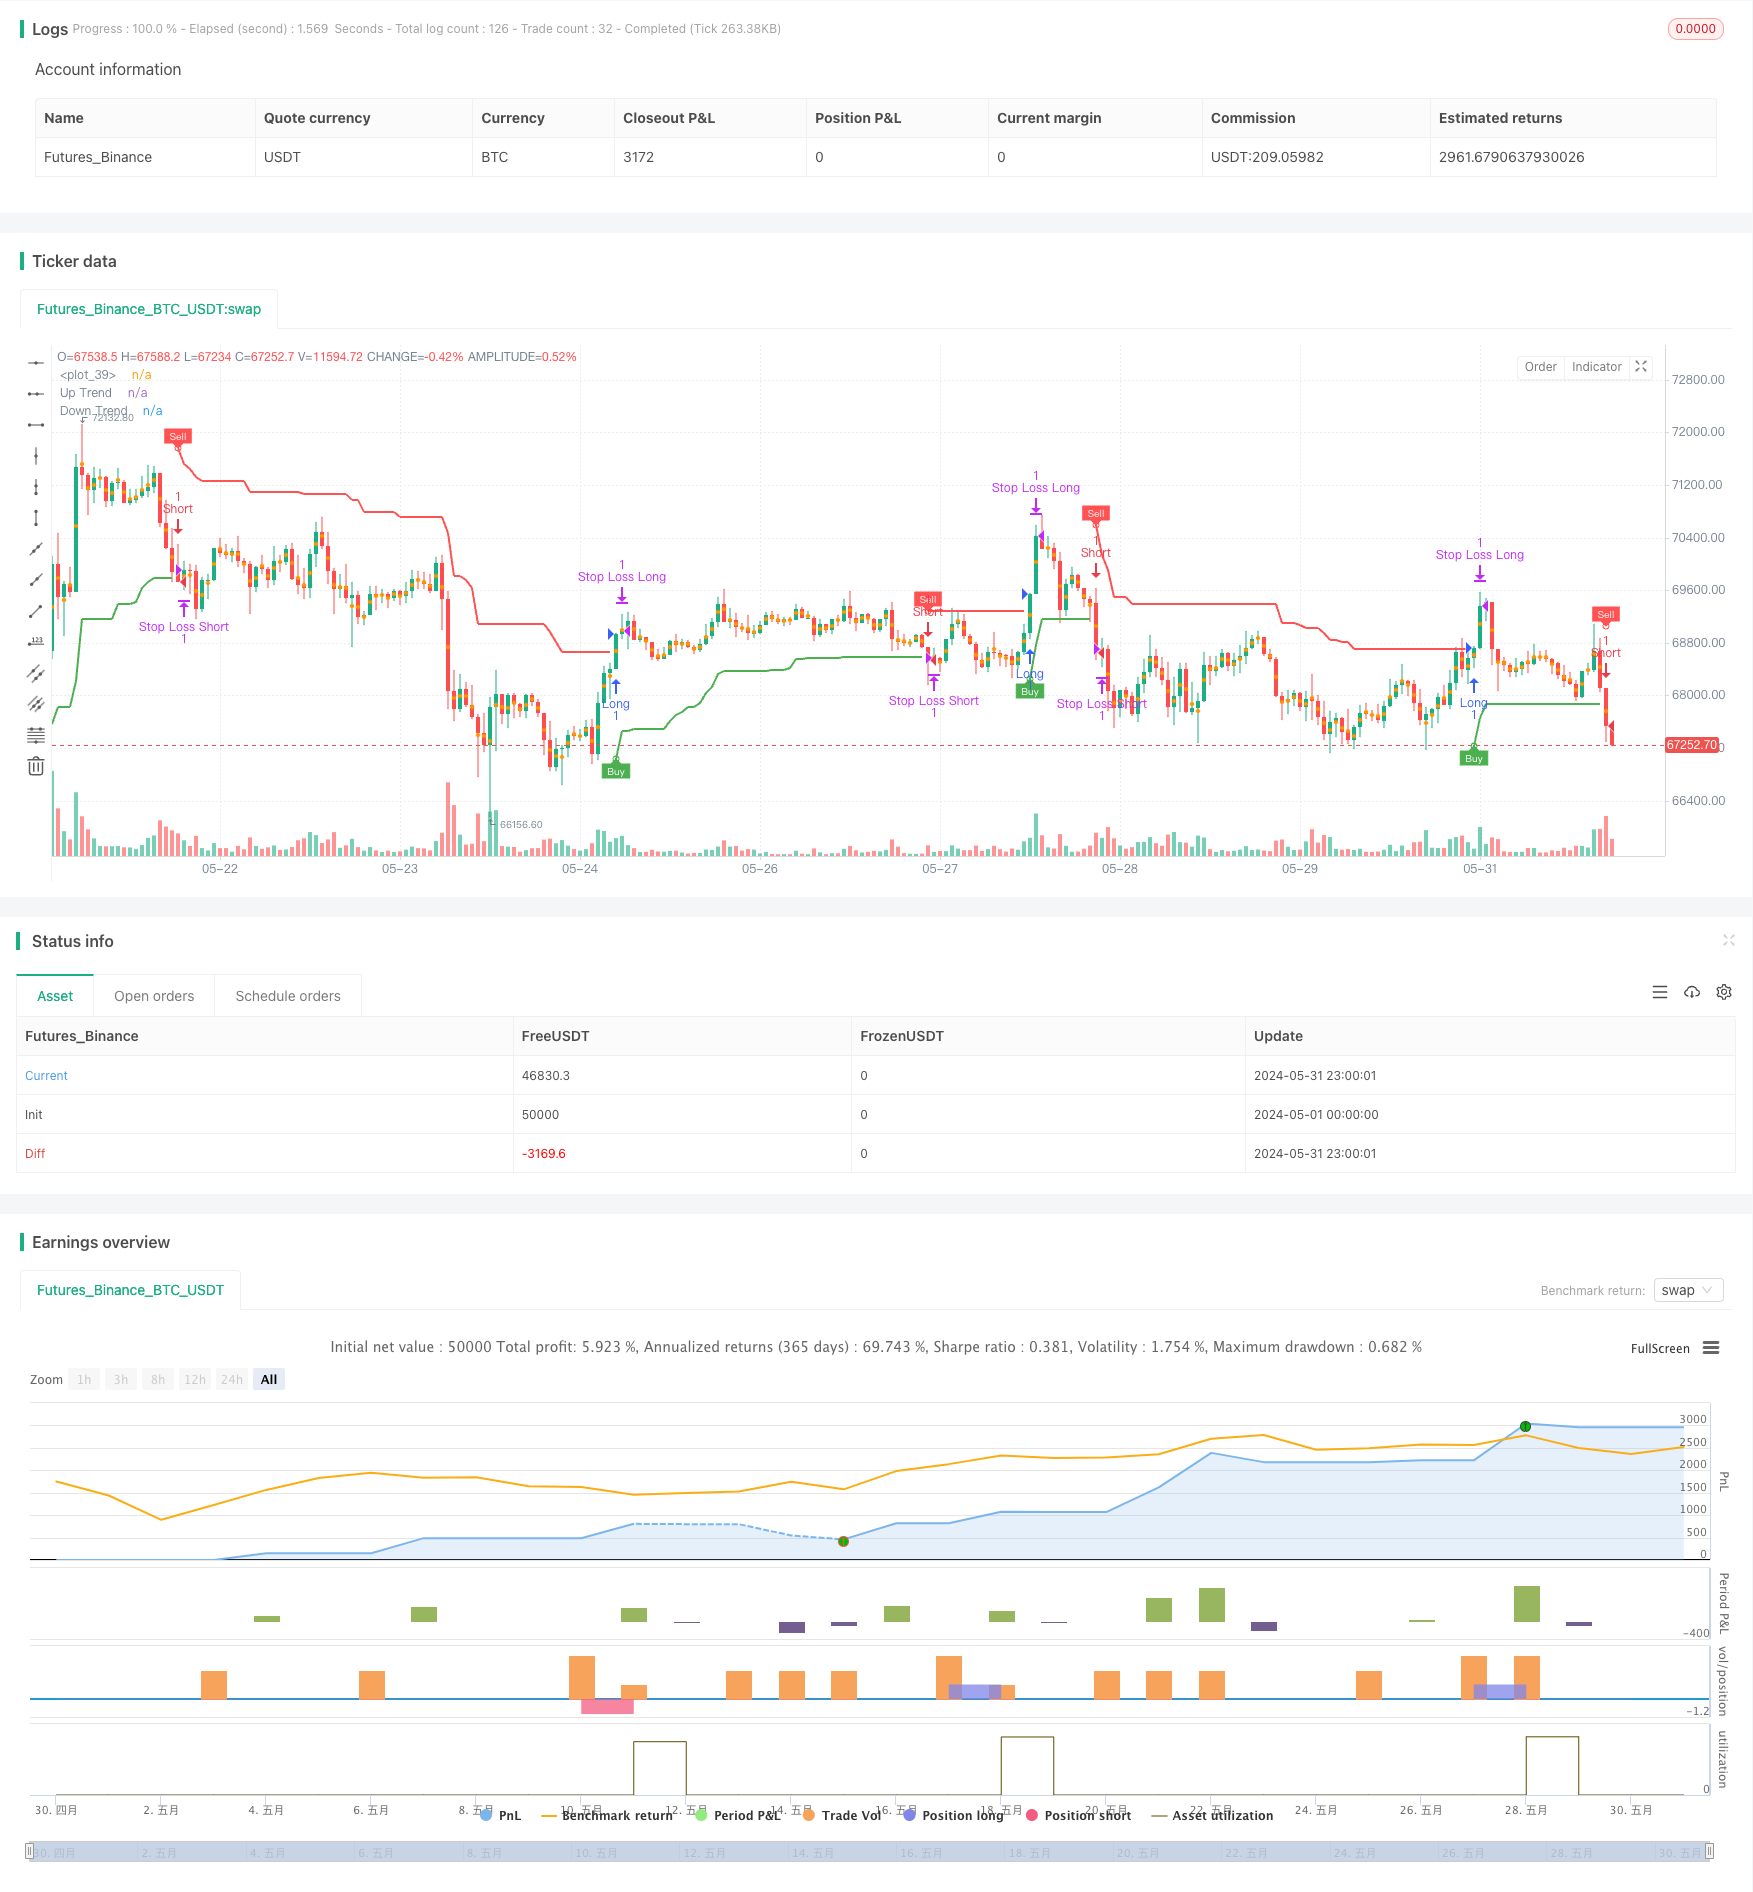
Overview
This strategy utilizes the Supertrend indicator to capture market trends. The Supertrend indicator combines price and volatility, with a green line indicating an uptrend and a red line indicating a downtrend. The strategy generates buy and sell signals by detecting changes in the color of the indicator line, while using the indicator line as a dynamic stop-loss level. The strategy also incorporates trailing stop-loss and fixed take-profit logic to optimize performance.
Strategy Principle
- Calculate the upper (up) and lower (dn) bands of the Supertrend indicator and determine the current trend direction (trend) based on the relationship between the closing price and the upper and lower bands.
- Generate a buy signal (buySignal) when the trend changes from downward (-1) to upward (1), and generate a sell signal (sellSignal) when the trend changes from upward (1) to downward (-1).
- When a buy signal is generated, open a long position and set the lower band (dn) as the stop-loss level; when a sell signal is generated, open a short position and set the upper band (up) as the stop-loss level.
- Introduce trailing stop-loss logic, where the stop-loss level is moved up/down when the price rises/falls by a certain number of points (trailingValue), providing stop-loss protection.
- Introduce fixed take-profit logic, closing the position for profit when the trend changes.
Strategy Advantages
- Adaptability: The Supertrend indicator combines price and volatility, enabling it to adapt to different market conditions and trading instruments.
- Dynamic stop-loss: Using the indicator line as a dynamic stop-loss level can effectively control risk and reduce losses.
- Trailing stop-loss: Introducing trailing stop-loss logic can protect profits when the trend continues, enhancing the strategy's profitability.
- Clear signals: The buy and sell signals generated by the strategy are clear and easy to operate and execute.
- Flexible parameters: The strategy's parameters (such as ATR period, ATR multiplier, etc.) can be adjusted based on market characteristics and trading style, improving adaptability.
Strategy Risks
- Parameter risk: Different parameter settings may lead to significant differences in strategy performance, requiring thorough backtesting and parameter optimization.
- Choppy market risk: In choppy markets, frequent trend changes may cause the strategy to generate excessive trading signals, increasing transaction costs and slippage risk.
- Sudden trend change risk: When market trends suddenly change, the strategy may not be able to adjust positions in a timely manner, leading to increased losses.
- Over-optimization risk: Over-optimizing the strategy may lead to curve fitting, resulting in poor performance in future markets.
Strategy Optimization Directions
- Incorporate multi-timeframe analysis to confirm the stability of trends and reduce frequent trading in choppy markets.
- Combine other technical indicators or fundamental factors to improve the accuracy of trend determination.
- Optimize stop-loss and take-profit logic, such as introducing dynamic take-profit or risk-reward ratio, to improve the strategy's profit-loss ratio.
- Perform robustness testing on parameters to select parameter combinations that maintain good performance under different market conditions.
- Introduce position sizing and money management rules to control individual trade risk and overall risk.
Summary
The Dynamic Trend Following Strategy utilizes the Supertrend indicator to capture market trends, controlling risk through dynamic stop-loss and trailing stop-loss, while locking in profits with fixed take-profit. The strategy is adaptable, has clear signals, and is easy to operate. However, in practical application, attention should be paid to parameter optimization, choppy market risk, and sudden trend change risk. By introducing multi-timeframe analysis, optimizing stop-loss and take-profit logic, conducting parameter robustness testing, and implementing other measures, the strategy's performance and stability can be further enhanced.
Source Pine Script
/*backtest
start: 2024-05-01 00:00:00
end: 2024-05-31 23:59:59
period: 1h
basePeriod: 15m
exchanges: [{"eid":"Futures_Binance","currency":"BTC_USDT"}]
*/

//@version=5
strategy('Supertrend Strategy', overlay=true, format=format.price, precision=2)
Periods = input.int(title='ATR Period', defval=10)
src = input.source(hl2, title='Source')
Multiplier = input.float(title='ATR Multiplier', step=0.1, defval=3.0)
changeATR = input.bool(title='Change ATR Calculation Method ?', defval=true)
showsignals = input.bool(title='Show Buy/Sell Signals ?', defval=true)
highlighting = input.bool(title='Highlighter On/Off ?', defval=true)

// ATR calculation
atr2 = ta.sma(ta.tr, Periods)
atr = changeATR ? ta.atr(Periods) : atr2

// Supertrend calculations
up = src - Multiplier * atr
up1 = nz(up[1], up)
up := close[1] > up1 ? math.max(up, up1) : up
dn = src + Multiplier * atr
dn1 = nz(dn[1], dn)
dn := close[1] < dn1 ? math.min(dn, dn1) : dn

// Trend direction
trend = 1
trend := nz(trend[1], trend)
trend := trend == -1 and close > dn1 ? 1 : trend == 1 and close < up1 ? -1 : trend

// Plotting
upPlot = plot(trend == 1 ? up : na, title='Up Trend', style=plot.style_linebr, linewidth=2, color=color.new(color.green, 0))
buySignal = trend == 1 and trend[1] == -1
plotshape(buySignal ? up : na, title='UpTrend Begins', location=location.absolute, style=shape.circle, size=size.tiny, color=color.new(color.green, 0))
plotshape(buySignal and showsignals ? up : na, title='Buy', text='Buy', location=location.absolute, style=shape.labelup, size=size.tiny, color=color.new(color.green, 0), textcolor=color.new(color.white, 0))

dnPlot = plot(trend == 1 ? na : dn, title='Down Trend', style=plot.style_linebr, linewidth=2, color=color.new(color.red, 0))
sellSignal = trend == -1 and trend[1] == 1
plotshape(sellSignal ? dn : na, title='DownTrend Begins', location=location.absolute, style=shape.circle, size=size.tiny, color=color.new(color.red, 0))
plotshape(sellSignal and showsignals ? dn : na, title='Sell', text='Sell', location=location.absolute, style=shape.labeldown, size=size.tiny, color=color.new(color.red, 0), textcolor=color.new(color.white, 0))

// Highlighting
mPlot = plot(ohlc4, title='', style=plot.style_circles, linewidth=0)
longFillColor = highlighting ? trend == 1 ? color.green : color.white : color.white
shortFillColor = highlighting ? trend == -1 ? color.red : color.white : color.white
fill(mPlot, upPlot, title='UpTrend Highligter', color=longFillColor, transp=90)
fill(mPlot, dnPlot, title='DownTrend Highligter', color=shortFillColor, transp=90)

// Alerts
alertcondition(buySignal, title='SuperTrend Buy', message='SuperTrend Buy!')
alertcondition(sellSignal, title='SuperTrend Sell', message='SuperTrend Sell!')
changeCond = trend != trend[1]
alertcondition(changeCond, title='SuperTrend Direction Change', message='SuperTrend has changed direction!')

// Pip and trailing stop calculation
pips = 50
pipValue = syminfo.mintick * pips
trailingPips = 10
trailingValue = syminfo.mintick * trailingPips

// Strategy
if (buySignal)
    strategy.entry("Long", strategy.long, stop=dn, comment="SuperTrend Buy")
if (sellSignal)
    strategy.entry("Short", strategy.short, stop=up, comment="SuperTrend Sell")

// Take profit on trend change
if (changeCond and trend == -1)
    strategy.close("Long", comment="SuperTrend Direction Change")
if (changeCond and trend == 1)
    strategy.close("Short", comment="SuperTrend Direction Change")

// Initial Stop Loss
longStopLevel = up - pipValue
shortStopLevel = dn + pipValue

// Trailing Stop Loss
var float longTrailStop = na
var float shortTrailStop = na

if (strategy.opentrades > 0)
    if (strategy.position_size > 0)  // Long position
        if (longTrailStop == na or close > strategy.position_avg_price + trailingValue)
            longTrailStop := high - trailingValue
        strategy.exit("Stop Loss Long", from_entry="Long", stop=longTrailStop)
    if (strategy.position_size < 0)  // Short position
        if (shortTrailStop == na or close < strategy.position_avg_price - trailingValue)
            shortTrailStop := low + trailingValue
        strategy.exit("Stop Loss Short", from_entry="Short", stop=shortTrailStop)

// Initial Exit
strategy.exit("Initial Stop Loss Long", from_entry="Long", stop=longStopLevel)
strategy.exit("Initial Stop Loss Short", from_entry="Short", stop=shortStopLevel)Published by ChaoZhang on the FMZ strategy square · last modified 2024-06-03. Collected in the Quant Trading Vault. Unvalidated research: re-test with your own data and costs before trusting it.
Build this with AgenKit
A spec is not a trading system. Paste this into your coding agent and AgenKit runs a specialist team — architecture, test-first build, risk gates, review — with paper trading on by default.
/agenkit build a production-grade trading bot with a backtest engine, risk controls and paper trading by default from strategies/Dynamic-Trend-Following-Strategy.md- npx agenkit install engineering-kit in your project
- Paste the command into your agent and approve each phase
- Get tests, backtest, risk controls and a paper-trading switch
Understand it first
Before you run this, read the lesson behind the idea and how to backtest it honestly. Specs like this one are the survivors of an unknown number of trials; deflate their results accordingly.
Related specs
- Multi Indicator Dynamic Trend Following Strategy Based on EMA and SMAPine Script · Trend following · 1d
- Super trend BPine Script · Trend following · 4h
- SuperTrend Dual Direction StrategyPine Script · Trend following · 3d
- Supertrend Advance StrategyPine Script · Trend following · 5m
- Supertrend and Moving Average Crossover StrategyPine Script · Trend following · 2h
- Trading the Equity Curve Position Sizing ExamplePine Script · Trend following · 15m