Strategy vault / Trend following
EMA and Supertrend Combination Quantitative Trading Strategy
This strategy combines the Exponential Moving Average (EMA) and the Supertrend indicator to generate buy and sell signals. A buy signal is generated when the price breaks above the 20-day EMA and the Supertrend…
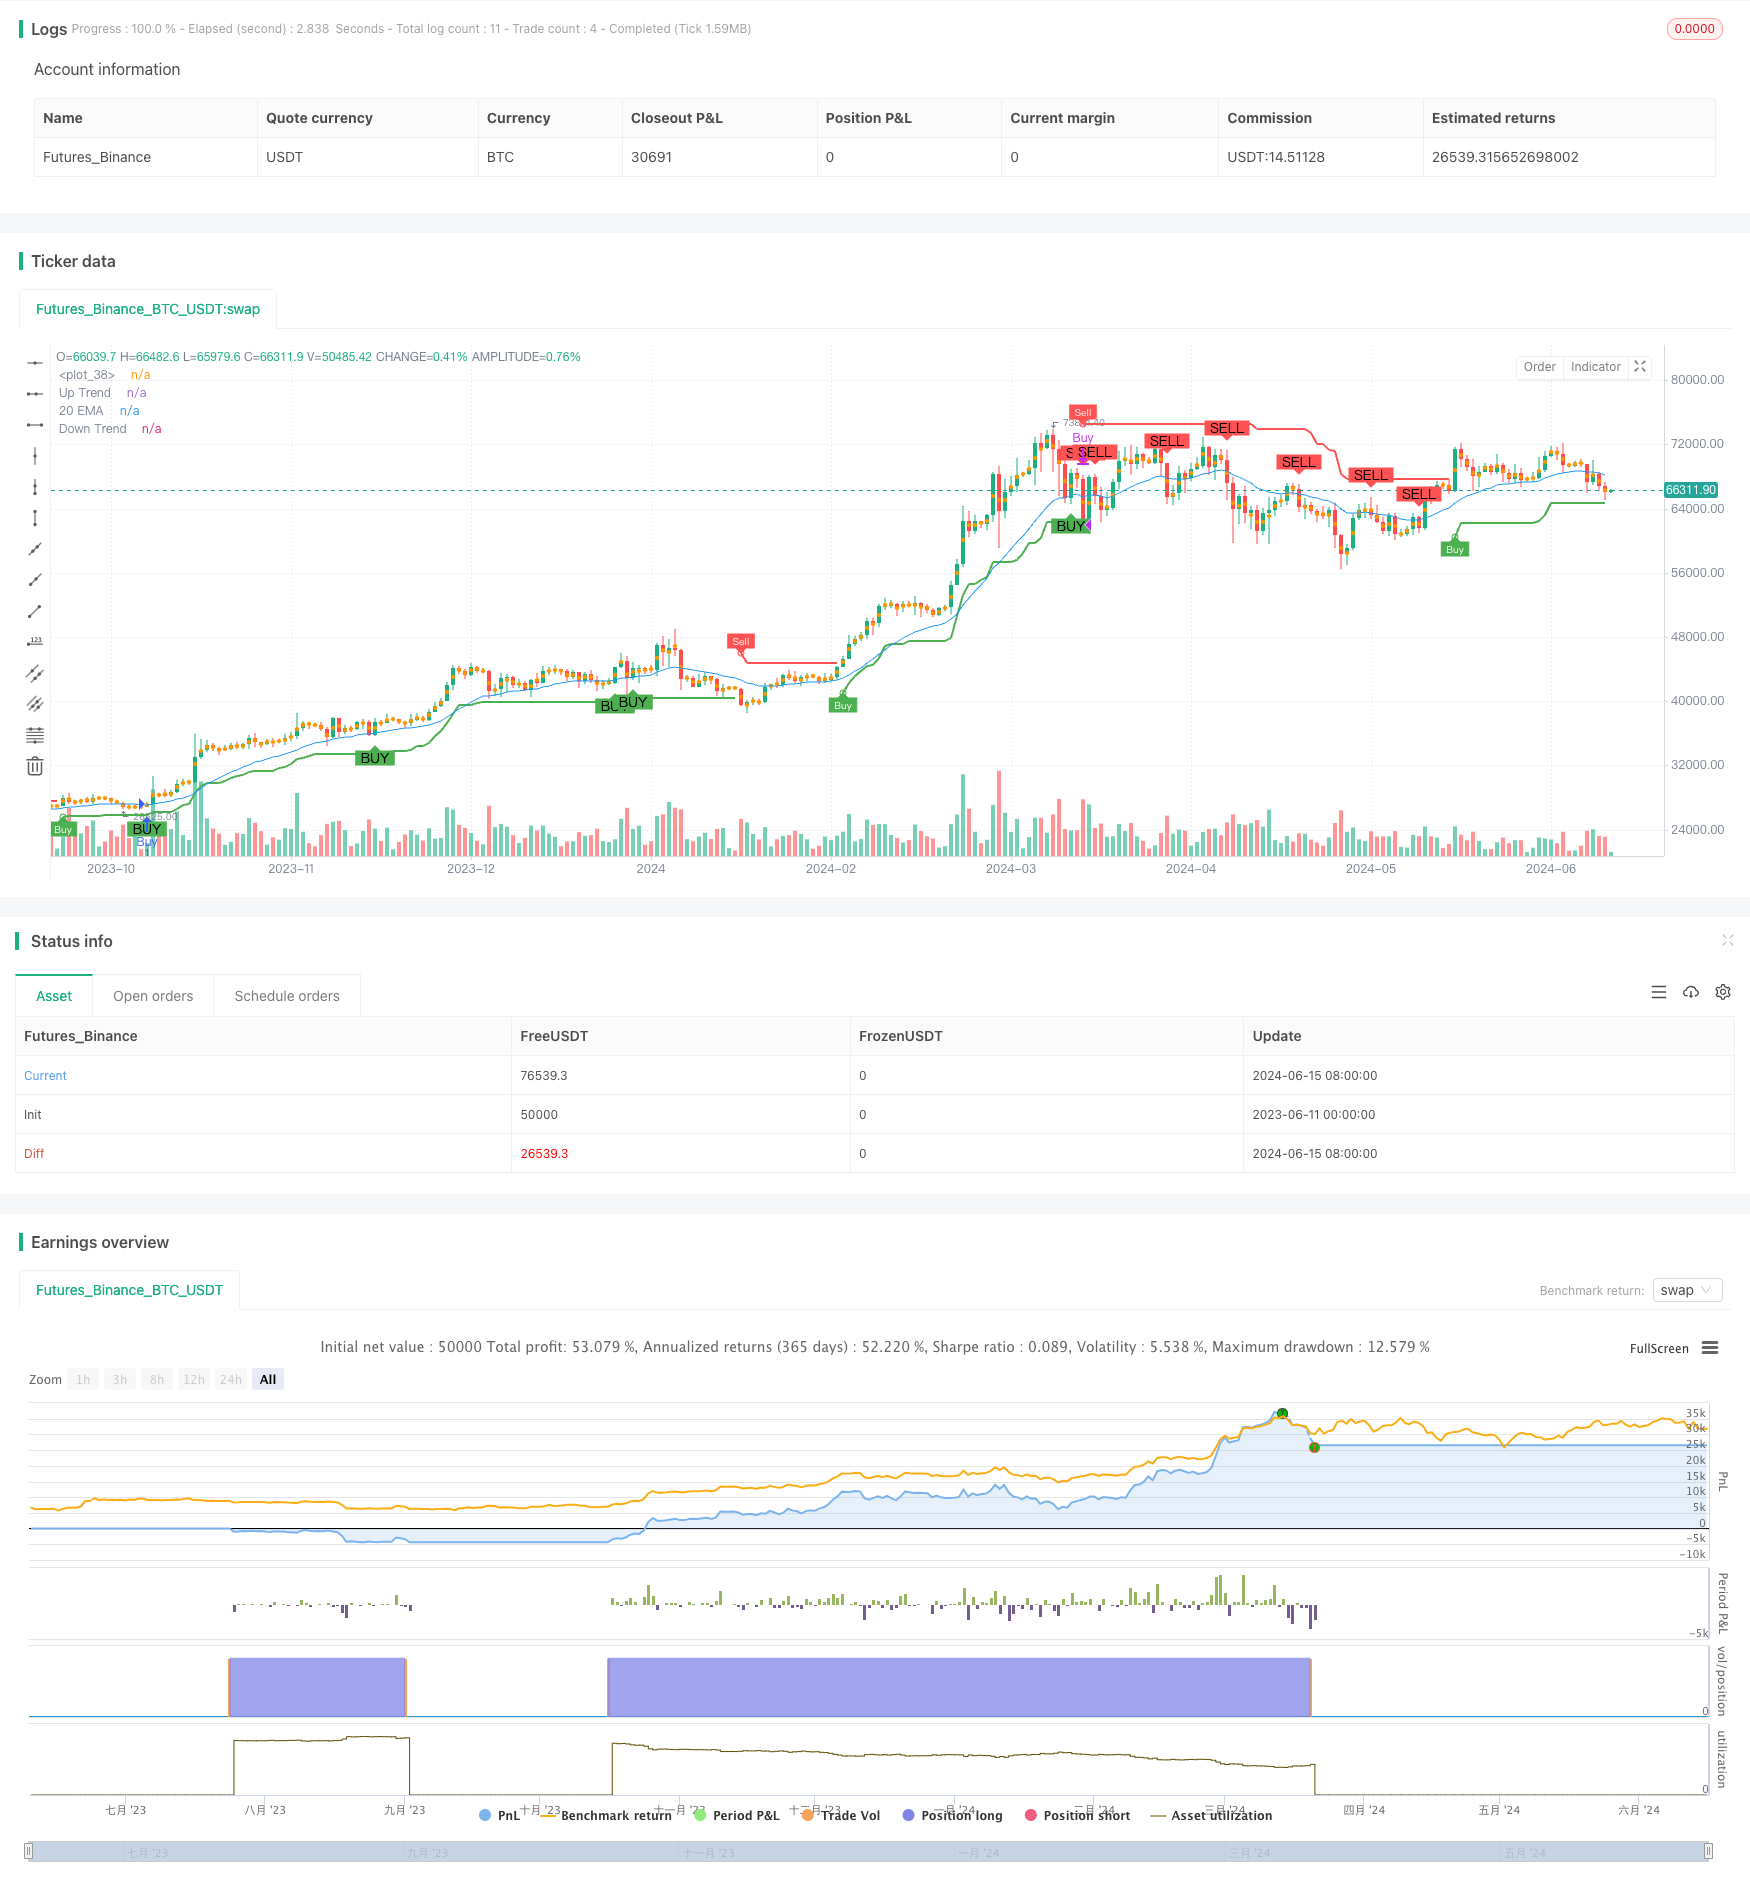
Overview
This strategy combines the Exponential Moving Average (EMA) and the Supertrend indicator to generate buy and sell signals. A buy signal is generated when the price breaks above the 20-day EMA and the Supertrend indicator is in a bullish trend. A sell signal is generated when the price breaks below the 20-day EMA and the Supertrend indicator is in a bearish trend. The strategy aims to capture trending market conditions while using the EMA as a filtering condition to reduce false signals.
Strategy Principle
- Calculate the 20-day EMA as a filtering condition for trend determination.
- Calculate the Supertrend indicator, which plots upper and lower bands based on the Average True Range (ATR) and the bullish/bearish trend.
- Generate buy and sell signals based on the trend direction of the Supertrend indicator and the relative position of the price to the 20-day EMA:
- A buy signal is generated when the price breaks above the 20-day EMA and the Supertrend indicator is in a bullish trend.
- A sell signal is generated when the price breaks below the 20-day EMA and the Supertrend indicator is in a bearish trend.
- The strategy enters a long position on a buy signal and exits on a sell signal.
Strategy Advantages
- By combining the EMA and the Supertrend indicator, the strategy can effectively capture trending market conditions while reducing false signals.
- The Supertrend indicator is based on ATR, which allows it to dynamically adjust the distance between the upper and lower bands, adapting to different market volatilities.
- Using the EMA as a filtering condition for trend determination ensures that positions are opened in the direction of the trend, increasing the win rate of the strategy.
- The strategy logic is simple and straightforward, making it easy to understand and implement.
Strategy Risks
- In a choppy market, the strategy may generate frequent buy and sell signals, leading to excessive trading and transaction cost erosion.
- The strategy relies on the EMA and the Supertrend indicator, which may become ineffective or lag in certain market conditions.
- The strategy does not consider risk management, such as stop-loss and position sizing, which may result in significant drawdowns during highly volatile market conditions.
Strategy Optimization Directions
- Incorporate a stop-loss mechanism, such as setting a dynamic stop-loss based on ATR, to control the maximum loss per trade.
- Optimize the parameters of the EMA and the Supertrend indicator, such as using parameter optimization methods to find the optimal parameter combination, enhancing the adaptability and stability of the strategy.
- Introduce position sizing by dynamically adjusting the position size based on market volatility or account profit and loss, to manage overall risk.
- Consider adding other filtering conditions, such as trading volume, volatility, etc., to further reduce false signals.
Summary
This strategy generates buy and sell signals by combining the 20-day EMA and the Supertrend indicator, aiming to capture trending market conditions. The strategy's advantages lie in its simplicity and the combination of EMA and Supertrend indicator, which can effectively reduce false signals. However, in choppy markets, the strategy may trade frequently and lacks risk management measures. Future improvements can consider incorporating stop-loss, position sizing, and parameter optimization methods to enhance the strategy. Overall, this strategy provides a simple and effective approach to trend trading, but further optimization and refinement are needed for practical application.
Source Pine Script
/*backtest
start: 2023-06-11 00:00:00
end: 2024-06-16 00:00:00
period: 1d
basePeriod: 1h
exchanges: [{"eid":"Futures_Binance","currency":"BTC_USDT"}]
*/

//@version=5
strategy("20 EMA and Supertrend Strategy", overlay=true)

// Inputs
emaLength = input(20, title="EMA Length")
supertrendMultiplier = input.float(3.0, title="Supertrend Multiplier")
supertrendPeriod = input(10, title="Supertrend Period")

// EMA Calculation
ema = ta.ema(close, emaLength)

// Supertrend Calculation
Periods = supertrendPeriod
src = hl2
Multiplier = supertrendMultiplier
changeATR= input.bool(true, title="Change ATR Calculation Method?")
showsignals = input.bool(true, title="Show Buy/Sell Signals?")
highlighting = input.bool(true, title="Highlighter On/Off?")
atr2 = ta.sma(ta.tr, Periods)
atr = changeATR ? ta.atr(Periods) : atr2
up = src - (Multiplier * atr)
up1 = na(up[1]) ? up : up[1]
up := close[1] > up1 ? math.max(up, up1) : up
dn = src + (Multiplier * atr)
dn1 = na(dn[1]) ? dn : dn[1]
dn := close[1] < dn1 ? math.min(dn, dn1) : dn
trend = 1
trend := na(trend[1]) ? trend : trend[1]
trend := trend == -1 and close > dn1 ? 1 : trend == 1 and close < up1 ? -1 : trend
upPlot = plot(trend == 1 ? up : na, title="Up Trend", style=plot.style_linebr, linewidth=2, color=color.green)
buySignal = trend == 1 and trend[1] == -1
plotshape(series=buySignal ? up : na, title="UpTrend Begins", location=location.absolute, style=shape.circle, size=size.tiny, color=color.new(color.green, 0))
plotshape(series=buySignal and showsignals ? up : na, title="Buy", text="Buy", location=location.absolute, style=shape.labelup, size=size.tiny, color=color.new(color.green, 0), textcolor=color.white)
dnPlot = plot(trend == 1 ? na : dn, title="Down Trend", style=plot.style_linebr, linewidth=2, color=color.red)
sellSignal = trend == -1 and trend[1] == 1
plotshape(series=sellSignal ? dn : na, title="DownTrend Begins", location=location.absolute, style=shape.circle, size=size.tiny, color=color.new(color.red, 0))
plotshape(series=sellSignal and showsignals ? dn : na, title="Sell", text="Sell", location=location.absolute, style=shape.labeldown, size=size.tiny, color=color.new(color.red, 0), textcolor=color.white)
mPlot = plot(ohlc4, title="", style=plot.style_circles, linewidth=1)
longFillColor = highlighting ? (trend == 1 ? color.new(color.green, 90) : color.new(color.white, 0)) : color.new(color.white, 0)
shortFillColor = highlighting ? (trend == -1 ? color.new(color.red, 90) : color.new(color.white, 0)) : color.new(color.white, 0)
fill(mPlot, upPlot, title="UpTrend Highlighter", color=longFillColor)
fill(mPlot, dnPlot, title="DownTrend Highlighter", color=shortFillColor)
alertcondition(buySignal, title="SuperTrend Buy", message="SuperTrend Buy!")
alertcondition(sellSignal, title="SuperTrend Sell", message="SuperTrend Sell!")
changeCond = trend != trend[1]
alertcondition(changeCond, title="SuperTrend Direction Change", message="SuperTrend has changed direction!")

// Buy and Sell Signals based on EMA and Supertrend
buySignalEMA = ta.crossover(close, ema) and trend == 1
sellSignalEMA = ta.crossunder(close, ema) and trend == -1

// Plot EMA
plot(ema, color=color.blue, title="20 EMA")

// Plot Buy and Sell Signals
plotshape(series=buySignalEMA, location=location.belowbar, color=color.green, style=shape.labelup, title="Buy Signal", text="BUY")
plotshape(series=sellSignalEMA, location=location.abovebar, color=color.red, style=shape.labeldown, title="Sell Signal", text="SELL")

// Strategy Entries and Exits
if (buySignalEMA)
    strategy.entry("Buy", strategy.long)

if (sellSignalEMA)
    strategy.close("Buy")
Published by ChaoZhang on the FMZ strategy square · last modified 2024-06-17. Collected in the Quant Trading Vault. Unvalidated research: re-test with your own data and costs before trusting it.
Build this with AgenKit
A spec is not a trading system. Paste this into your coding agent and AgenKit runs a specialist team — architecture, test-first build, risk gates, review — with paper trading on by default.
/agenkit build a production-grade trading bot with a backtest engine, risk controls and paper trading by default from strategies/EMA-and-Supertrend-Combination-Quantitative-Trading-Strategy.md- npx agenkit install engineering-kit in your project
- Paste the command into your agent and approve each phase
- Get tests, backtest, risk controls and a paper-trading switch
Understand it first
Before you run this, read the lesson behind the idea and how to backtest it honestly. Specs like this one are the survivors of an unknown number of trials; deflate their results accordingly.
Related specs
- Multi Indicator Dynamic Trend Following Strategy Based on EMA and SMAPine Script · Trend following · 1d
- Supertrend Advance StrategyPine Script · Trend following · 5m
- Supertrend and Moving Average Crossover StrategyPine Script · Trend following · 2h
- Trend Following Strategy Based on PMax IndicatorPine Script · Trend following · 5m
- Trend Tracking and Short term Trading Strategy Based on ADX IndicatorPine Script · Trend following · 1d
- Triple Supertrend Ichimoku Cloud Quantitative Trading StrategyPine Script · Trend following · 1d