Strategy vault / Trend following
EMA Crossover Trend Following Strategy 436779
This strategy adopts EMA crossover to track price trends. It goes long when the fast EMA crosses above the slow EMA, and closes position when the fast EMA crosses below the slow EMA. Mainly suitable for products with…
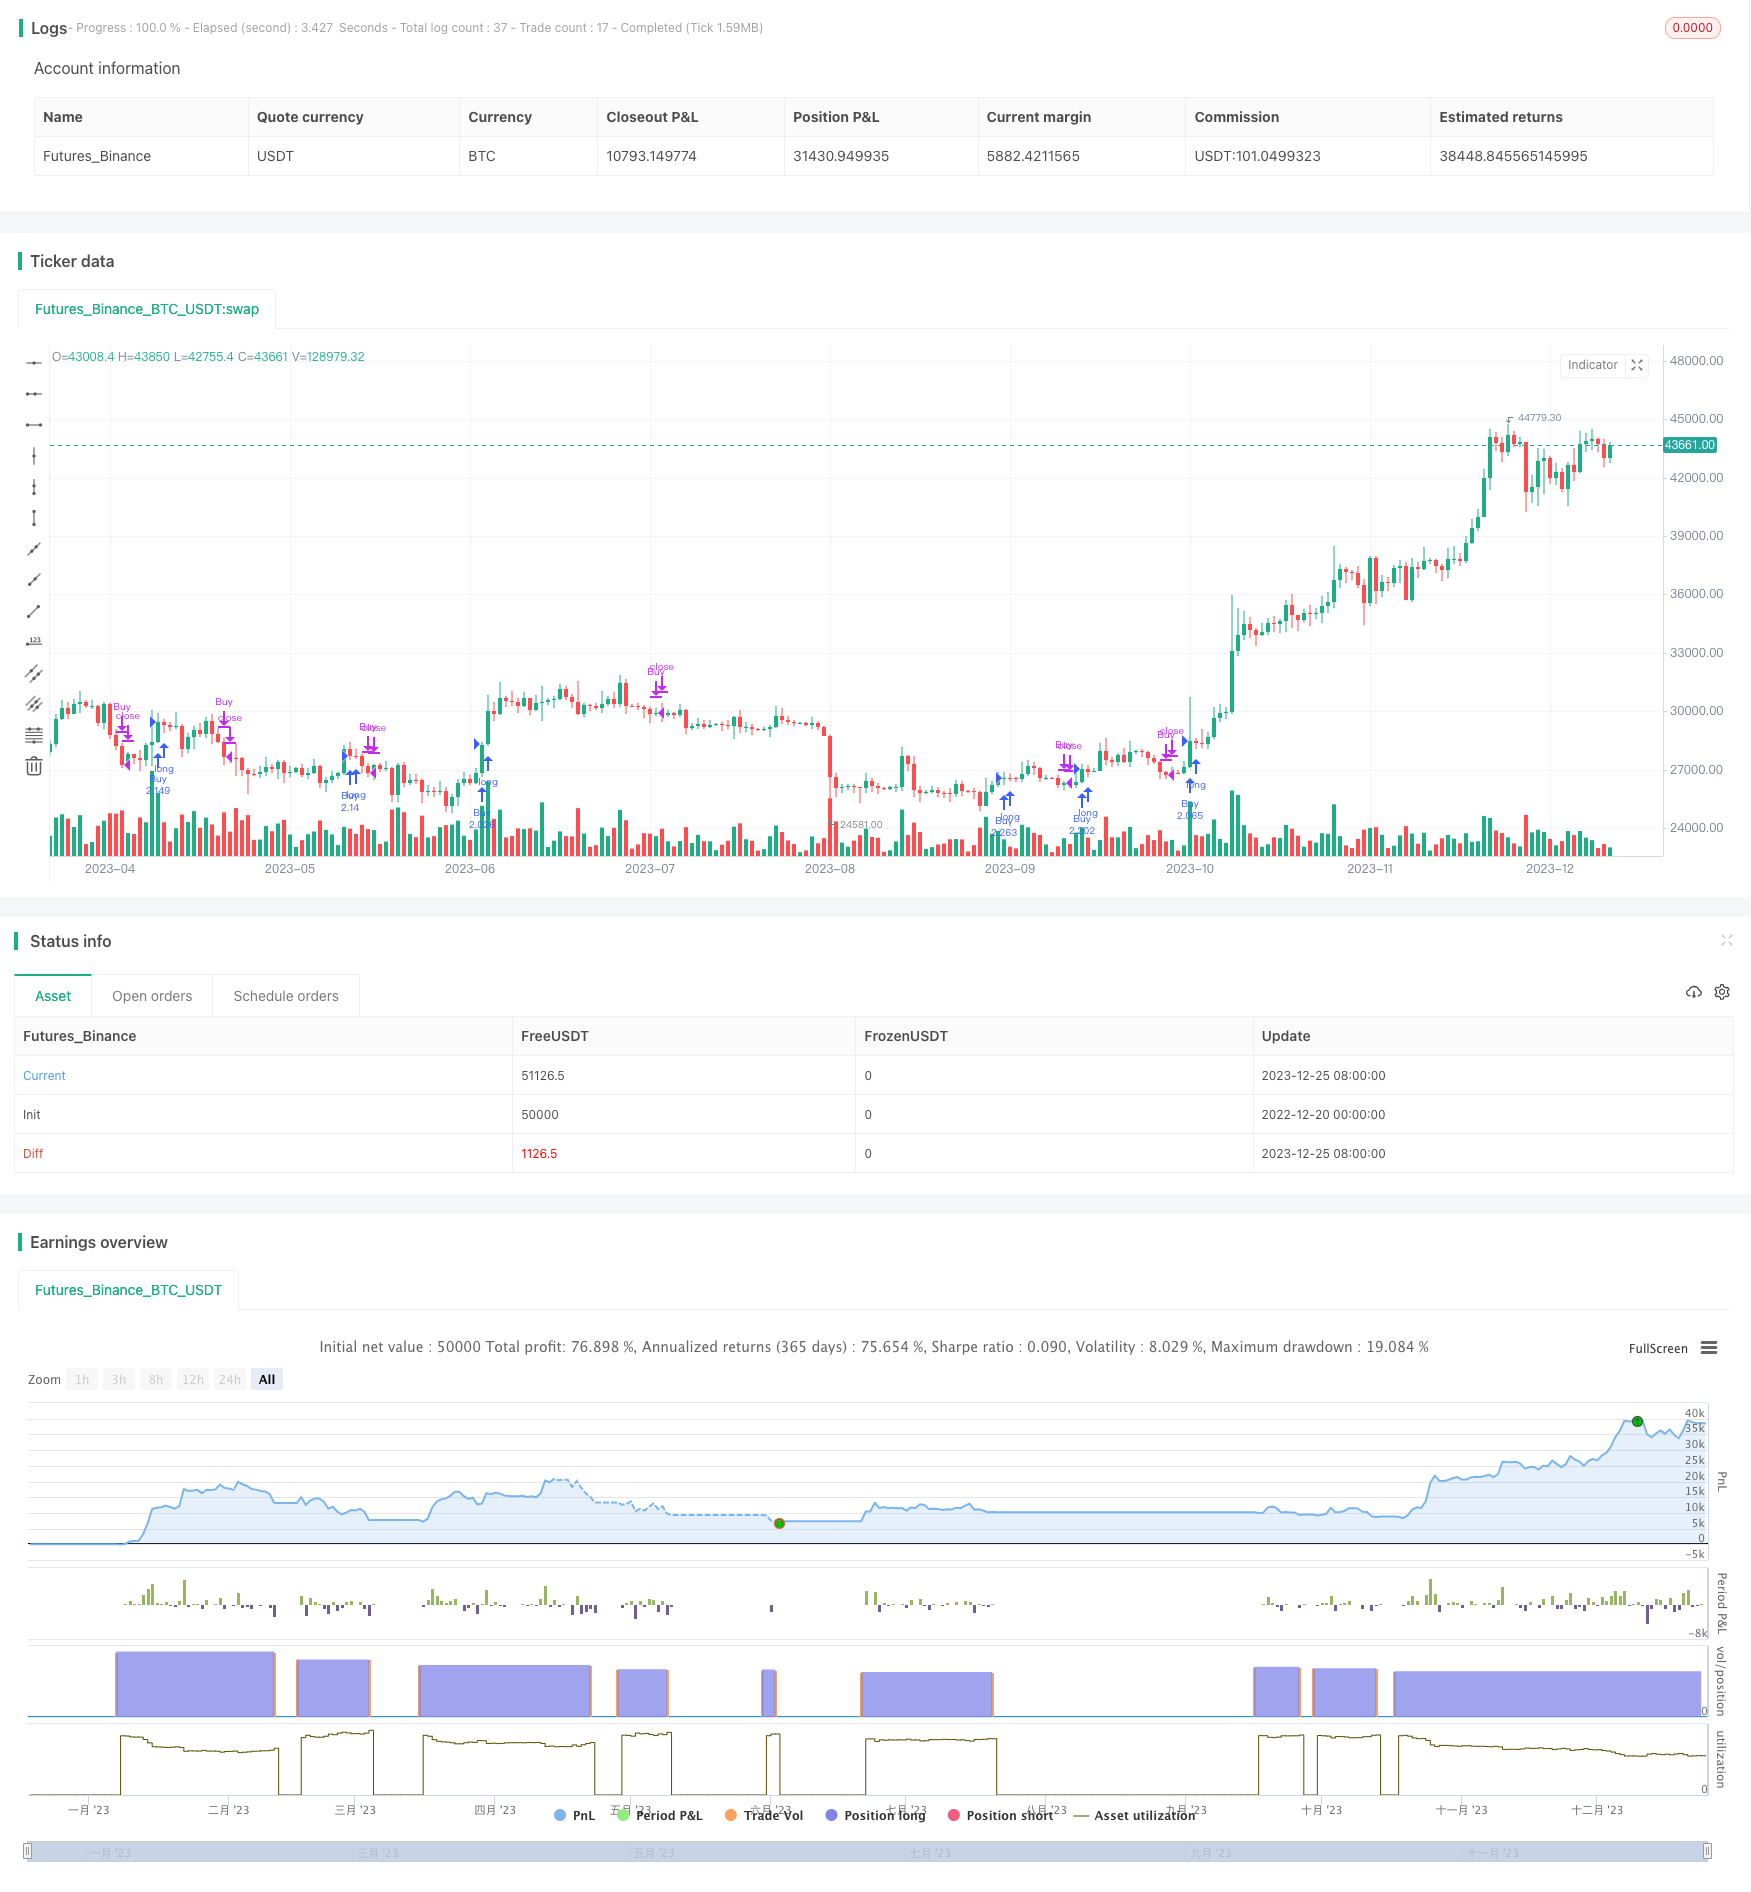
Overview
This strategy adopts EMA crossover to track price trends. It goes long when the fast EMA crosses above the slow EMA, and closes position when the fast EMA crosses below the slow EMA. Mainly suitable for products with obvious trends, effectively following trends and gaining excess returns.
Strategy Logic
The core indicator of this strategy is EMA. The EMA formula is:
EMA(t)=C(t)×2/(n+1)+EMA(t-1)×(n-1)/(n+1)
Where t is the current tick, C(t) is the current closing price, and n is the N parameter value. EMA is a moving average technique with a weighted factor, assigning more weight to recent prices, thus reacting faster to the latest price changes.
The strategy constructs fast and slow EMAs and takes fast EMA crossing above slow EMA as the buy signal, and fast EMA crossing below slow EMA as the sell signal. The fast EMA crossing above indicates the start of a new round of rise, while fast EMA crossing below indicates the end of the upside trend and the start of a pullback.
Advantage Analysis
The advantages of this strategy are:
- The logic is simple and easy to understand and implement;
- Utilize the simple and practical EMA to judge price trends, avoiding missing major trends;
- Few parameters to adjust and optimize, mainly relying on fast and slow EMAs;
- Able to follow upside trends after buying;
- Able to avoid pullbacks after selling, mitigating risks;
- Sufficient backtest data with high reliability.
Risk Analysis
The main risks are:
- High probability of false signals from EMA;
- Frequent signal when market is ranging as EMAs easily crossover;
- Unable to timely stop loss when sudden events cause sharp direction change;
- Limited optimization space that actual performance may underperform backtest results.
To reduce the above risks, the following optimizing measures can be adopted:
- Adding filter conditions with other indicators to avoid false signals;
- Adjusting parameters to reduce signal frequency;
- Adding stop loss strategy to control single loss;
- Testing different time period parameters to find the optimum.
Optimization Directions
The strategy can be optimized from the following aspects:
- Composite indicators across multiple timeframes, e.g. combining weekly or monthly trends;
- Adding filter conditions to avoid false breakout, e.g. volume, Bollinger Bands etc;
- Dynamic adjustment of parameters according to real-time market changes;
- Incorporating other indicators to build models, e.g. grid, regression algorithms.
Summary
In summary, this is a simple and practical trend following strategy utilizing EMA to judge price trends. The logic is clear and easy to implement. The advantages lie in the simplicity to adjust parameters and effectively follow trends. The disadvantages are prone to false signals and actual performance may underperform backtests. Next steps of optimization can focus on adding filters, dynamic parameters, model building to make the strategy more robust.
Parameters
| Name | Default | What it controls |
|---|---|---|
| v_input_1 | timestamp(01 Jan 2020 00:00 +0000) | Start time |
| v_input_2 | timestamp(31 Dec 2050 23:59 +0000) | End time |
| v_input_3 | 5 | Fast EMA Length |
| v_input_4 | 20 | Slow EMA Length |
Source Pine Script
/*backtest
start: 2022-12-20 00:00:00
end: 2023-12-26 00:00:00
period: 1d
basePeriod: 1h
exchanges: [{"eid":"Futures_Binance","currency":"BTC_USDT"}]
*/

//@version=4
strategy("EMACross Strategyby GPT",
     format = format.inherit,
     overlay = true,
     default_qty_type= strategy.percent_of_equity,
     default_qty_value = 100,
     currency = currency.USD,
     initial_capital = 1000000)


// Define variables for backtest trading start and end times
start_time = input(title="Start time", type=input.time, defval=timestamp("01 Jan 2020 00:00 +0000"))
end_time = input(title="End time", type=input.time, defval=timestamp("31 Dec 2050 23:59 +0000"))


// Determine whether it is within the backtest trading time range
in_range = true


// Define input variables
fast_length = input(title="Fast EMA Length", type=input.integer, defval=5)
slow_length = input(title="Slow EMA Length", type=input.integer, defval=20)


// Define EMAs
fast_ema = ema(close, fast_length)
slow_ema = ema(close, slow_length)


// Define buy and sell signals
buy_signal = crossover(fast_ema, slow_ema)
sell_signal = crossunder(fast_ema, slow_ema)


// Buy signal
if in_range and buy_signal
    strategy.entry("Buy", strategy.long, when=in_range)

// Sell signal
if in_range and sell_signal
    strategy.close("Buy", when=sell_signal)
Published by ChaoZhang on the FMZ strategy square · last modified 2023-12-27. Collected in the Quant Trading Vault. Unvalidated research: re-test with your own data and costs before trusting it.
Build this with AgenKit
A spec is not a trading system. Paste this into your coding agent and AgenKit runs a specialist team — architecture, test-first build, risk gates, review — with paper trading on by default.
/agenkit build a production-grade trading bot with a backtest engine, risk controls and paper trading by default from strategies/EMA-Crossover-Trend-Following-Strategy-436779.md- npx agenkit install engineering-kit in your project
- Paste the command into your agent and approve each phase
- Get tests, backtest, risk controls and a paper-trading switch
Understand it first
Before you run this, read the lesson behind the idea and how to backtest it honestly. Specs like this one are the survivors of an unknown number of trials; deflate their results accordingly.
Related specs
- ATR and Moving Average Crossover Hybrid StrategyPine Script · Trend following · 1h
- Bollinger Band Moving Average Crossover StrategyPine Script · Trend following · 1h
- Bollinger Bands and EMA Trend Following StrategyPine Script · Trend following · 1h
- Bollinger Bands and RSI Trend Following StrategyPine Script · Trend following · 1h
- Dual Moving Average Crossover Dynamic Position Optimization Strategy with EMA Cross Signal SystemPine Script · Trend following · 1h
- EMA Cross Trend Following Strategy with SMA Stop Loss and Re Entry MechanismPine Script · Trend following · 1h