Strategy vault / Mean reversion
EMA Hull and RSI Opportunity Tracking Strategy
This strategy constructs trading signals based on moving averages, Hull moving averages and the Relative Strength Index (RSI). It belongs to a typical opportunity tracking strategy that can automatically identify…
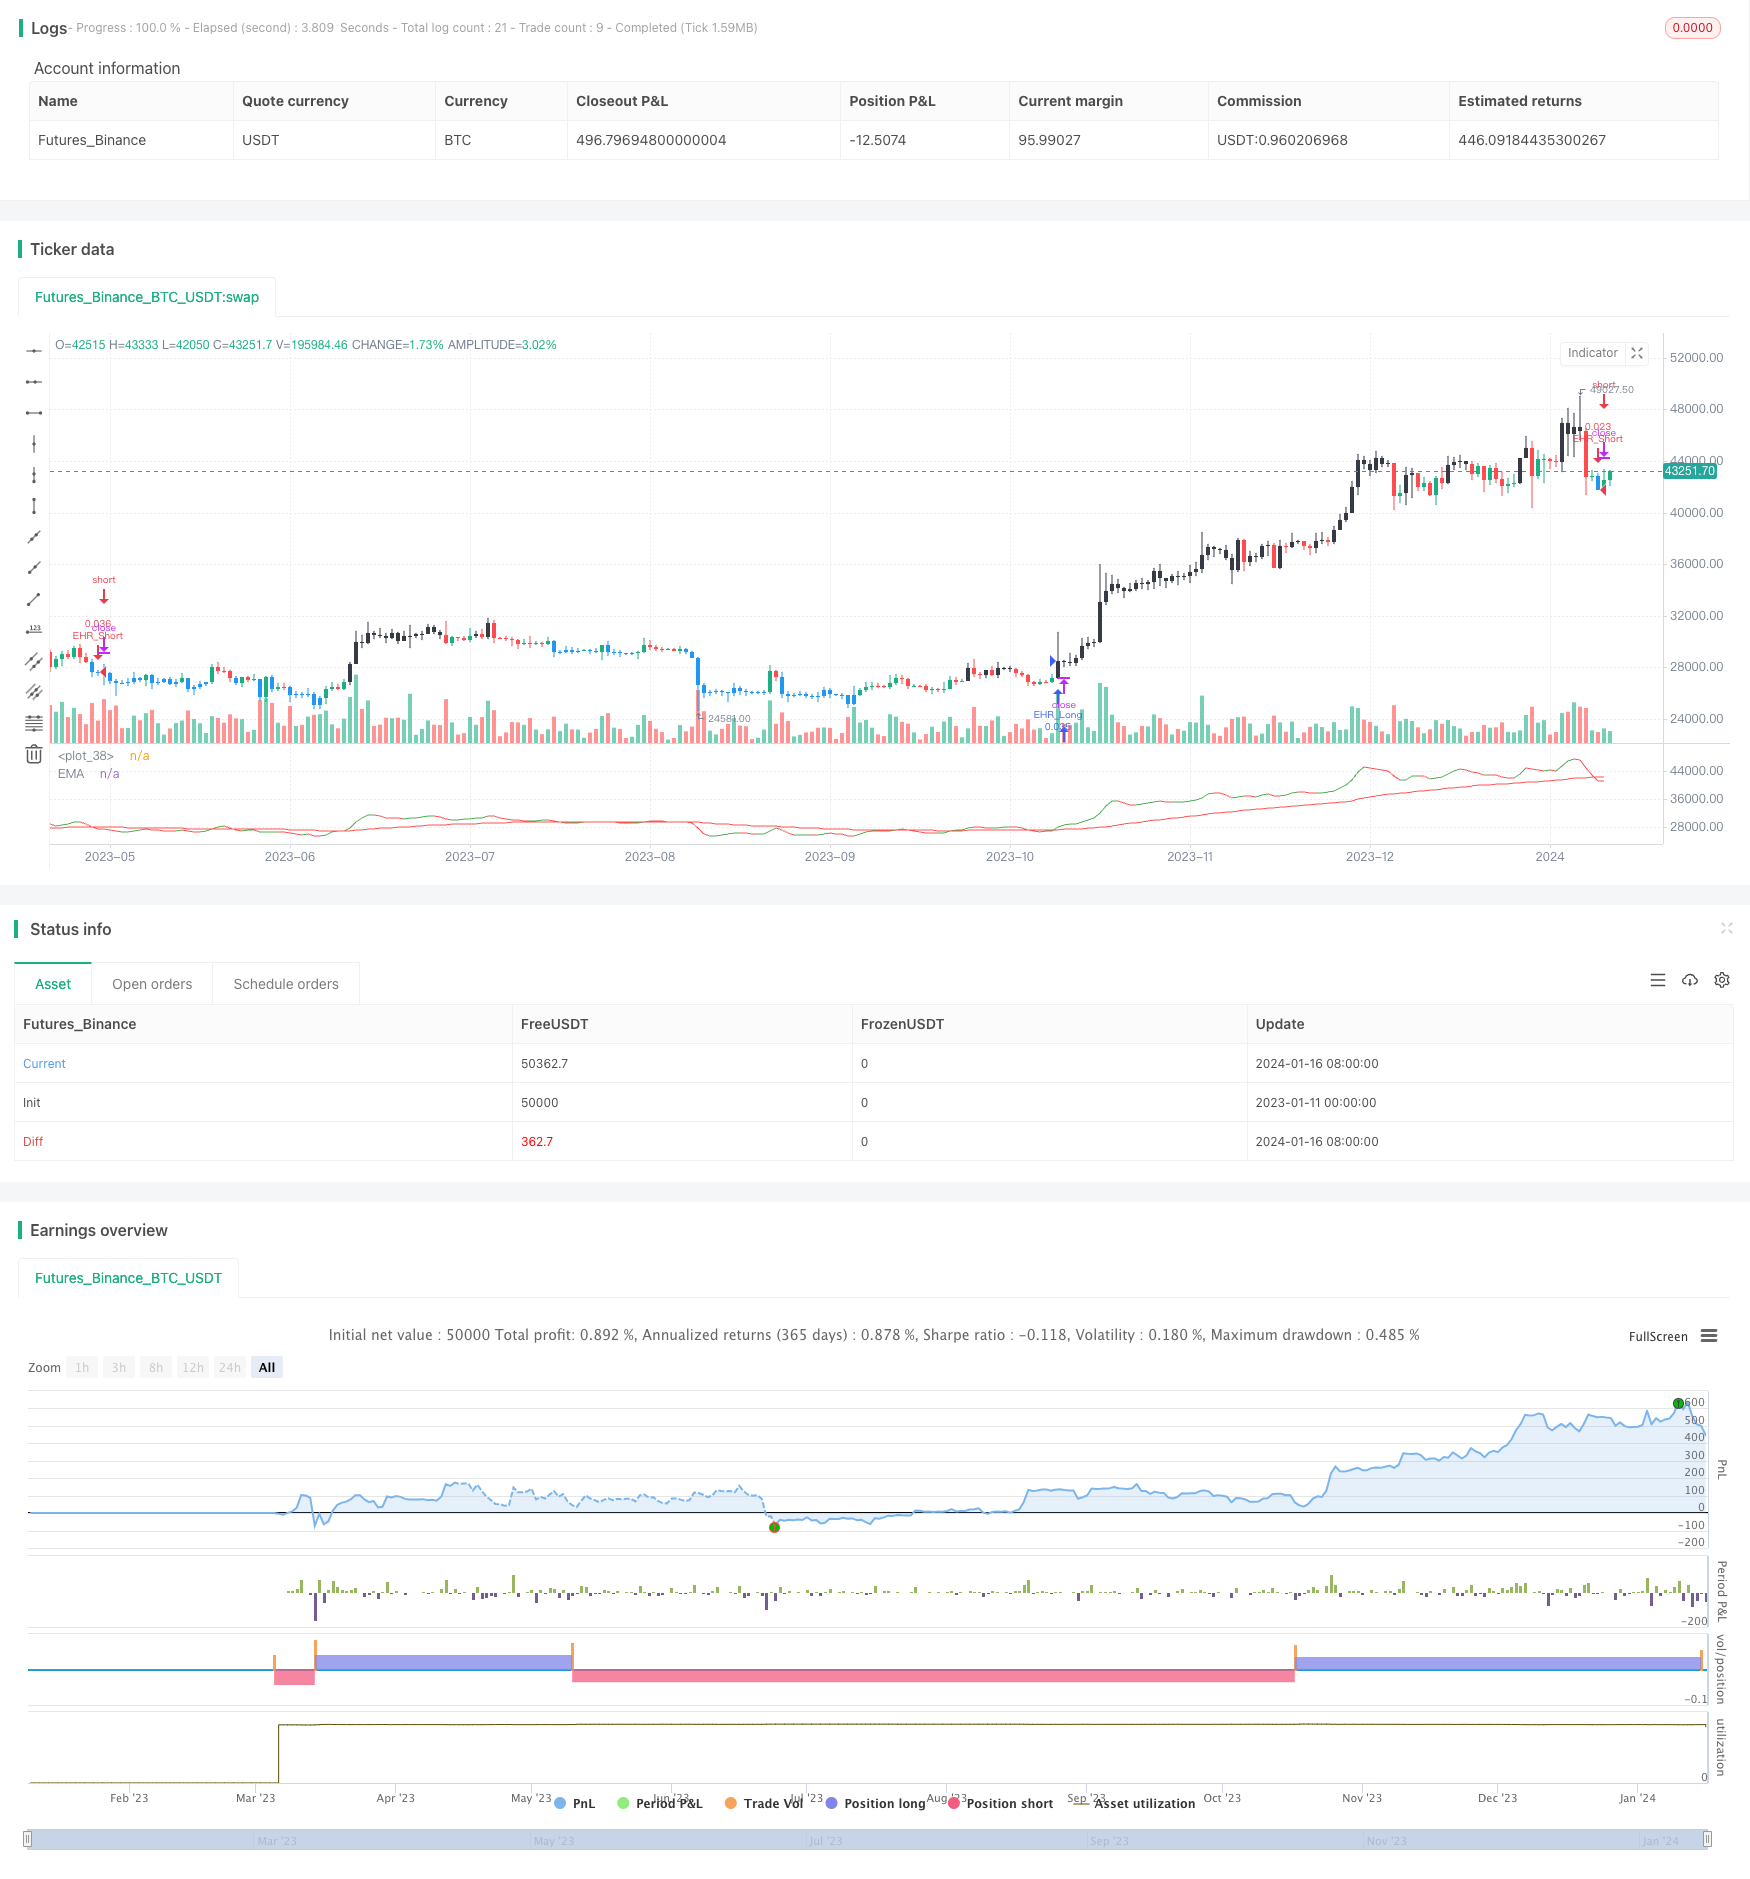
Overview
This strategy constructs trading signals based on moving averages, Hull moving averages and the Relative Strength Index (RSI). It belongs to a typical opportunity tracking strategy that can automatically identify market opportunities and switch between long and short positions. It is suitable for medium and short term trading.
Strategy Logic
- Calculate the 50-period Exponential Moving Average (EMA) as the indicator for judging the trend.
- Calculate the 7-day Hull Moving Average as a more sensitive and leading average indicator, crossing EMA to form golden crosses and dead crosses.
- Set the overbought line and oversold line for RSI at 60 and 45 respectively. RSI above 60 is an overbought signal and RSI below 45 is an oversold area.
- When overbought happens at the same time as an upwards penetration of EMA, it is a short signal.
- When oversold happens at the same time as a downwards penetration of EMA, it is a long signal.
Advantages of the Strategy
- Uses a combination of EMA, Hull and RSI to comprehensively judge market trends, momentum and overbought/oversold areas, improving signal accuracy.
- EMA judges mid-to-long term trends, Hull leads shorter term moves, RSI identifies overbought/oversold levels. Different period indicators working together capture trading opportunities across timeframes.
- Entry signals must meet criteria for trend, momentum and overbought/oversold zones simultaneously to trigger, effectively filtering false signals.
Risks of the Strategy
- Only using 3 indicators may miss some trading opportunities.
- EMA and Hull periods need continual testing and optimization, improper parameter selections can impact signal quality.
- RSI parameters also need to be adjusted for different equities and currencies which may have different overbought/oversold standards.
Enhancement Areas
- More auxiliary indicators can be introduced, e.g. Bollinger Bands, KC Lines etc to create multi-resonance decision making.
- Parameters can be optimized for different products.
- Higher timeframe analysis can be incorporated to avoid being misled by short term fakeouts.
- Stop loss strategies can be implemented to manage risk.
Summary
This strategy uses the combination of EMA, Hull and RSI across timeframes to capture medium and short term trading opportunities. Entry signals must meet criteria in trend, momentum and overbought/oversold dimensions simultaneously in order to filter out false signals. The strategy can be further enhanced through parameter optimization and introducing more auxiliary indicators to improve stability and trading performance.
Parameters
| Name | Default | What it controls |
|---|---|---|
| v_input_1 | 50 | EMA Length |
| v_input_2_close | 0 | EMA Source: close | high | low | open | hl2 | hlc3 | hlcc4 | ohlc4 |
| v_input_3 | 60 | overbought value |
| v_input_4 | 45 | oversold value |
| v_input_5 | 7 | Hull Length |
Source Pine Script
/*backtest
start: 2023-01-11 00:00:00
end: 2024-01-17 00:00:00
period: 1d
basePeriod: 1h
exchanges: [{"eid":"Futures_Binance","currency":"BTC_USDT"}]
*/

// This source code is subject to the terms of the Mozilla Public License 2.0 at https://mozilla.org/MPL/2.0/
// © Bitduke

//@version=4
strategy(shorttitle="EHR", title="Simple EMA_Hull_RSI", overlay=false,
     calc_on_every_tick=false, pyramiding=0, default_qty_type=strategy.cash,
     default_qty_value=1000, currency=currency.USD, initial_capital=1000,
     commission_type=strategy.commission.percent, commission_value=0.075)

// EMA
len = input(minval=1, title="EMA Length", defval=50)
src = input(close, title="EMA Source")
final_ema = ema(src, len)
plot(final_ema, color=color.red, title="EMA")

overbought = input(60, title="overbought value")
oversold = input(45, title="oversold value")

overbought_signal = rsi(close, 14) > overbought
oversold_signal = rsi(close, 14) < oversold
barcolor(overbought_signal ? color.black : na)
barcolor(oversold_signal ? color.blue : na)
// Hull MA
n = input(title="Hull Length", defval=7)
n2ma=2*wma(close,round(n/2))
nma=wma(close,n)
diff=n2ma-nma
sqn=round(sqrt(n))

n2ma1=2*wma(close[1],round(n/2))
nma1=wma(close[1],n)
diff1=n2ma1-nma1
sqn1=round(sqrt(n))

n1=wma(diff,sqn)
n2=wma(diff1,sqn)
c=n1>n2?color.green:color.red
ma=plot(n1,color=c)

// Strategy Logic
longCondition =  overbought_signal and crossover(n1,final_ema)
shortCondition = oversold_signal and crossover(final_ema,n1)

strategy.entry("EHR_Long", strategy.long, when=longCondition)
strategy.entry("EHR_Short", strategy.short, when=shortCondition)
Published by ChaoZhang on the FMZ strategy square · last modified 2024-01-18. Collected in the Quant Trading Vault. Unvalidated research: re-test with your own data and costs before trusting it.
Build this with AgenKit
A spec is not a trading system. Paste this into your coding agent and AgenKit runs a specialist team — architecture, test-first build, risk gates, review — with paper trading on by default.
/agenkit build a production-grade trading bot with a backtest engine, risk controls and paper trading by default from strategies/EMA-Hull-and-RSI-Opportunity-Tracking-Strategy.md- npx agenkit install engineering-kit in your project
- Paste the command into your agent and approve each phase
- Get tests, backtest, risk controls and a paper-trading switch
Understand it first
Before you run this, read the lesson behind the idea and how to backtest it honestly. Specs like this one are the survivors of an unknown number of trials; deflate their results accordingly.
Related specs
- Advanced 15 Minute Chart Trading Signal StrategyPine Script · Mean reversion · 3h
- Advanced Quantitative Trading Strategy Combining RSI Divergence and Moving AveragesPine Script · Mean reversion · 1h
- Momentum Reversal Trend Tracking StrategyPine Script · Mean reversion
- Reversal RSI Trend Tracking ETF Trading StrategyPine Script · Mean reversion · 3m
- Reversal Trading Strategy with Bollinger Bands RSI ADX and ATRPine Script · Mean reversion · 1h
- Bollinger Bands RSI EMA Double Trading StrategyPine Script · Mean reversion · 3m