EMA RSI Trend Following and Momentum Strategy
The Bybit EMA RSI Trend-Following and Momentum Strategy is a quantitative trading strategy that combines Exponential Moving Averages (EMA) and the Relative Strength Index (RSI). The strategy uses two EMAs with…
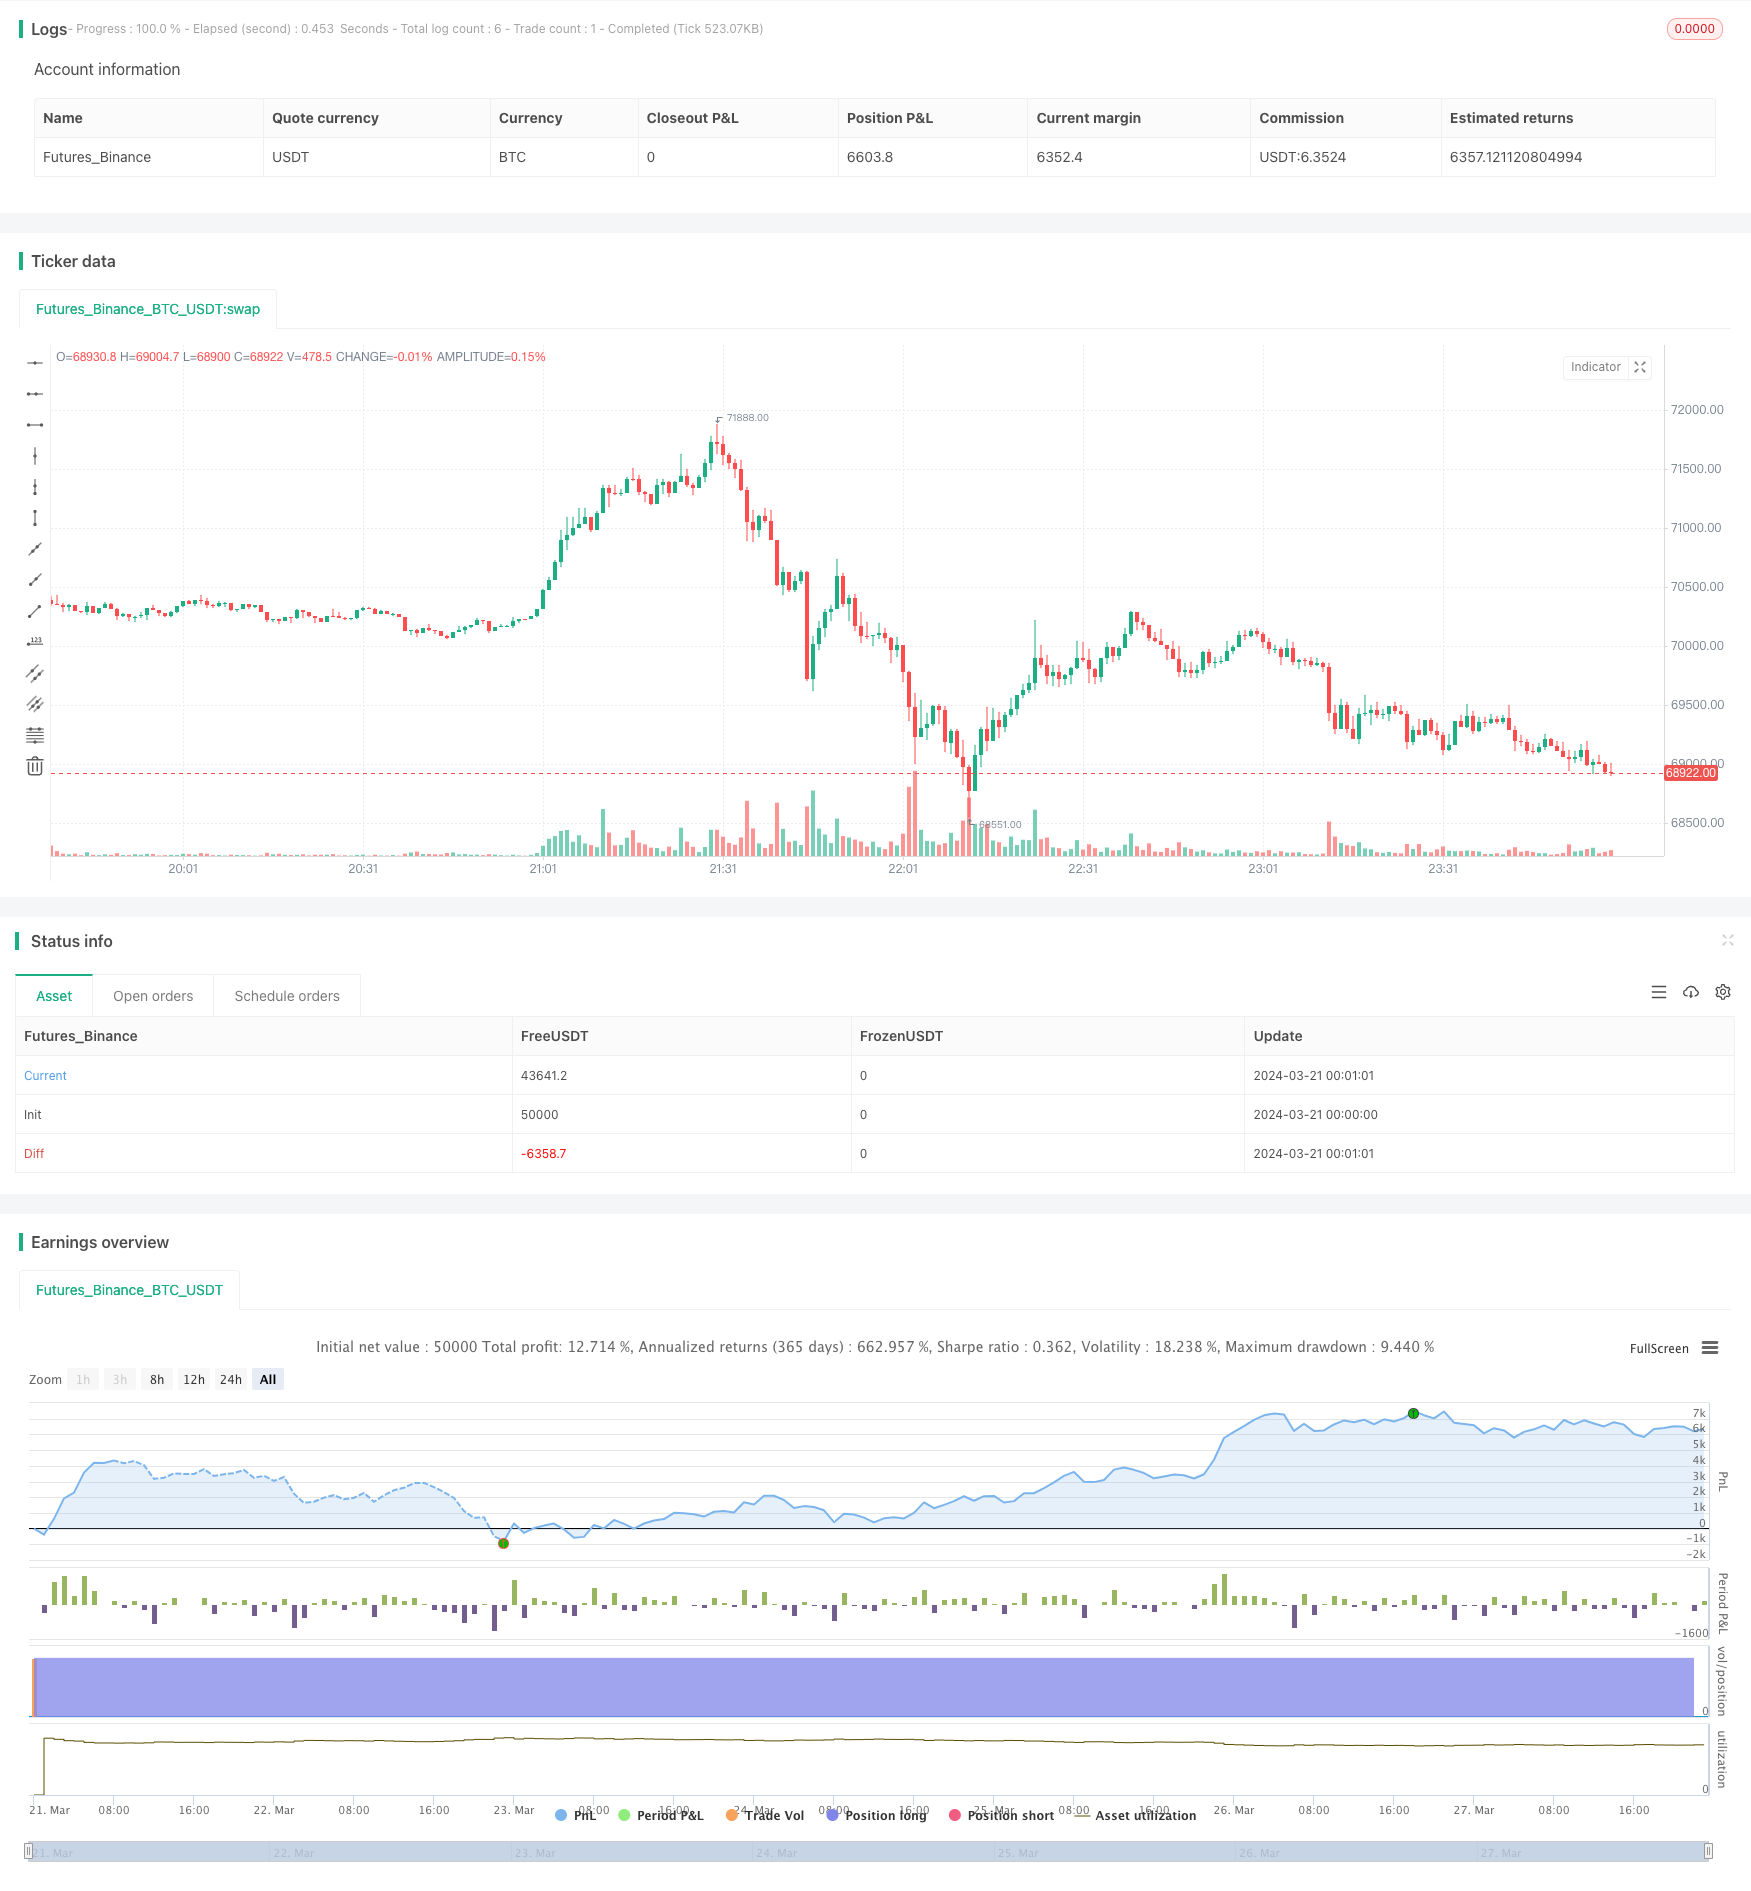
Overview
The Bybit EMA RSI Trend-Following and Momentum Strategy is a quantitative trading strategy that combines Exponential Moving Averages (EMA) and the Relative Strength Index (RSI). The strategy uses two EMAs with different periods to determine market trends and the RSI indicator to confirm the validity of the trends. When the fast EMA crosses above the slow EMA and the RSI is below a specific lower threshold, the strategy generates a long signal. Conversely, when the fast EMA crosses below the slow EMA and the RSI is above a specific upper threshold, the strategy generates a short signal. The strategy also sets different commission percentages based on the Bybit account level and includes built-in take profit and stop loss functions to effectively manage risk.
Strategy Principles
- Calculate the fast EMA and slow EMA with periods of 90 and 300, respectively.
- Calculate the RSI indicator with a period of 5.
- Generate a long signal when the fast EMA crosses above the slow EMA and the RSI is below 45; generate a short signal when the fast EMA crosses below the slow EMA and the RSI is above 85.
- Set different commission percentages based on the Bybit account level, ranging from 0.075% for VIP 0 to 0.035% for VIP 4.
- Calculate the entry prices with commission included.
- Calculate the take profit and stop loss prices based on the set percentages (5% and 3%).
- Plot the entry prices, take profit lines, and stop loss lines on the chart.
- Execute entry orders based on the trading signals.
Strategy Advantages
- Combines trend-following and momentum indicators to effectively capture market trends.
- Includes built-in take profit and stop loss functions to manage risk effectively.
- Sets different commission percentages based on the Bybit account level, adapting to different users' trading conditions.
- Plots entry prices, take profit lines, and stop loss lines on the chart, providing visual confirmation of trading signals.
Strategy Risks
- The selection of EMA and RSI parameters may not be suitable for all market conditions and may require optimization based on actual situations.
- In choppy markets, the strategy may generate frequent trading signals, leading to high trading costs.
- The take profit and stop loss settings may be too conservative or aggressive and may need adjustment based on personal risk preferences.
Strategy Optimization Directions
- Optimize the EMA and RSI parameters to adapt to different market conditions. This can be done through backtesting and parameter scanning to find the optimal parameter combinations.
- Introduce other technical indicators, such as Bollinger Bands, MACD, etc., to improve the accuracy of trading signals.
- Optimize the take profit and stop loss settings, for example, by using trailing stops or dynamic stop loss methods to better protect profits and manage risk.
- Consider factors such as market volatility and trading volume to filter trading signals and reduce the costs associated with frequent trading.
Summary
The Bybit EMA RSI Trend-Following and Momentum Strategy is a quantitative trading strategy that combines trend-following and momentum indicators. By using EMAs and RSI together, it can effectively capture market trends. The strategy includes built-in take profit and stop loss functions and sets commission percentages based on the Bybit account level, effectively managing risk and adapting to different users' trading conditions. However, there is still room for optimization in the strategy, such as parameter optimization, introducing other technical indicators, and optimizing take profit and stop loss settings. With continuous optimization and improvement, the strategy is expected to achieve better results in actual trading.
Parameters
| Name | Default | What it controls |
|---|---|---|
| v_input_1 | 90 | Fast EMA Length |
| v_input_2 | 300 | Slow EMA Length |
| v_input_3 | 5 | RSI Length |
| v_input_4 | 85 | RSI Upper Threshold |
| v_input_5 | 45 | RSI Lower Threshold |
| v_input_6 | 5 | Take Profit % |
| v_input_7 | 3 | Stop Loss % |
| v_input_string_1 | 0 | Bybit Account Level: VIP 0 | VIP 1 | VIP 2 | VIP 3 | VIP 4 |
Source Pine Script
/*backtest
start: 2024-03-21 00:00:00
end: 2024-03-28 00:00:00
period: 1m
basePeriod: 1m
exchanges: [{"eid":"Futures_Binance","currency":"BTC_USDT"}]
*/

// @BryanAaron

//@version=5
strategy("Bybit EMA RSI Strategy", overlay=true)

// Input parameters
fastLength = input(90, title="Fast EMA Length")
slowLength = input(300, title="Slow EMA Length")
rsiLength = input(5, title="RSI Length")
rsiUpperThreshold = input(85, title="RSI Upper Threshold")
rsiLowerThreshold = input(45, title="RSI Lower Threshold")
takeProfitPerc = input(5, title="Take Profit %")
stopLossPerc = input(3, title="Stop Loss %")
bybitAccountLevel = input.string("VIP 0", title="Bybit Account Level", options=["VIP 0", "VIP 1", "VIP 2", "VIP 3", "VIP 4"])

// Calculate moving averages
fastMA = ta.ema(close, fastLength)
slowMA = ta.ema(close, slowLength)

// Calculate RSI
rsi = ta.rsi(close, rsiLength)

// Trading conditions
longCondition = (fastMA > slowMA) and (rsi < rsiLowerThreshold)
shortCondition = (fastMA < slowMA) and (rsi > rsiUpperThreshold)

// Set commission based on Bybit account level
commissionPerc = switch bybitAccountLevel
    "VIP 0" => 0.075
    "VIP 1" => 0.065
    "VIP 2" => 0.055
    "VIP 3" => 0.045
    "VIP 4" => 0.035
    => 0.075

// Calculate entry prices with commission
var float longEntryPrice = na
var float shortEntryPrice = na

longEntryPriceWithCommission = close * (1 + commissionPerc / 100)
shortEntryPriceWithCommission = close * (1 - commissionPerc / 100)

// Calculate take profit and stop loss prices
takeProfitPrice(entryPrice) => entryPrice * (1 + takeProfitPerc / 100)
stopLossPrice(entryPrice) => entryPrice * (1 - stopLossPerc / 100)

// Plot entry prices
plotchar(longCondition, title="Long Entry Price", char="LE", location=location.belowbar, color=color.green)
plotchar(shortCondition, title="Short Entry Price", char="SE", location=location.abovebar, color=color.red)

// Draw position on the chart
longColor = color.green
shortColor = color.red
profitColor = color.new(color.green, 80)
lossColor = color.new(color.red, 80)

plotshape(longCondition and strategy.position_size > 0, title="Long Position", text="Long", location=location.belowbar, style=shape.labelup, size=size.small, color=longColor, textcolor=color.white)
plotshape(shortCondition and strategy.position_size < 0, title="Short Position", text="Short", location=location.abovebar, style=shape.labeldown, size=size.small, color=shortColor, textcolor=color.white)

if (strategy.position_size > 0)
    line.new(bar_index, longEntryPrice, bar_index + 1, longEntryPrice, color=longColor, width=2)

    longProfitLine = line.new(bar_index, takeProfitPrice(longEntryPrice), bar_index + 1, takeProfitPrice(longEntryPrice), color=profitColor, width=1)
    longLossLine = line.new(bar_index, stopLossPrice(longEntryPrice), bar_index + 1, stopLossPrice(longEntryPrice), color=lossColor, width=1)


else if (strategy.position_size < 0)
    line.new(bar_index, shortEntryPrice, bar_index + 1, shortEntryPrice, color=shortColor, width=2)

    shortProfitLine = line.new(bar_index, stopLossPrice(shortEntryPrice), bar_index + 1, stopLossPrice(shortEntryPrice), color=profitColor, width=1)
    shortLossLine = line.new(bar_index, takeProfitPrice(shortEntryPrice), bar_index + 1, takeProfitPrice(shortEntryPrice), color=lossColor, width=1)


// Entry
if (longCondition)
    strategy.entry("Long", strategy.long)
    longEntryPrice := longEntryPriceWithCommission
else if (shortCondition)
    strategy.entry("Short", strategy.short)
shortEntryPrice := shortEntryPriceWithCommissionPublished by ChaoZhang on the FMZ strategy square · last modified 2024-03-29. Collected in the Quant Trading Vault. Unvalidated research: re-test with your own data and costs before trusting it.
Build this with AgenKit
A spec is not a trading system. Paste this into your coding agent and AgenKit runs a specialist team — architecture, test-first build, risk gates, review — with paper trading on by default.
/agenkit build a production-grade trading bot with a backtest engine, risk controls and paper trading by default from strategies/EMA-RSI-Trend-Following-and-Momentum-Strategy.md- npx agenkit install engineering-kit in your project
- Paste the command into your agent and approve each phase
- Get tests, backtest, risk controls and a paper-trading switch
Understand it first
Before you run this, read the lesson behind the idea and how to backtest it honestly. Specs like this one are the survivors of an unknown number of trials; deflate their results accordingly.
Related specs
- ADX Momentum Trend StrategyPine Script · Momentum · 10m
- Advanced Multi Indicator Trend Following and Momentum Quantitative Trading StrategyPine Script · Momentum · 1h
- Bollinger Bands Momentum Trend Following Quantitative StrategyPine Script · Momentum · 1d
- Cross Period Momentum EMA Strategy with RSI and Dynamic ATR Stop LossPine Script · Momentum · 1d
- Dual EMA Crossover with RSI Momentum Enhanced Trading StrategyPine Script · Momentum · 1d
- Dynamic Trend Channel and Relative Strength Momentum Trading StrategyPine Script · Momentum · 3h