Strategy vault / Trend following
Enhanced Ichimoku Cloud Trading Strategy with Dynamic Crossover Signals
This strategy is an enhanced version of the classic Ichimoku Kinko Hyo system, utilizing dynamic crossovers between the Conversion and Base lines to identify trading signals. It incorporates automated trading signal…
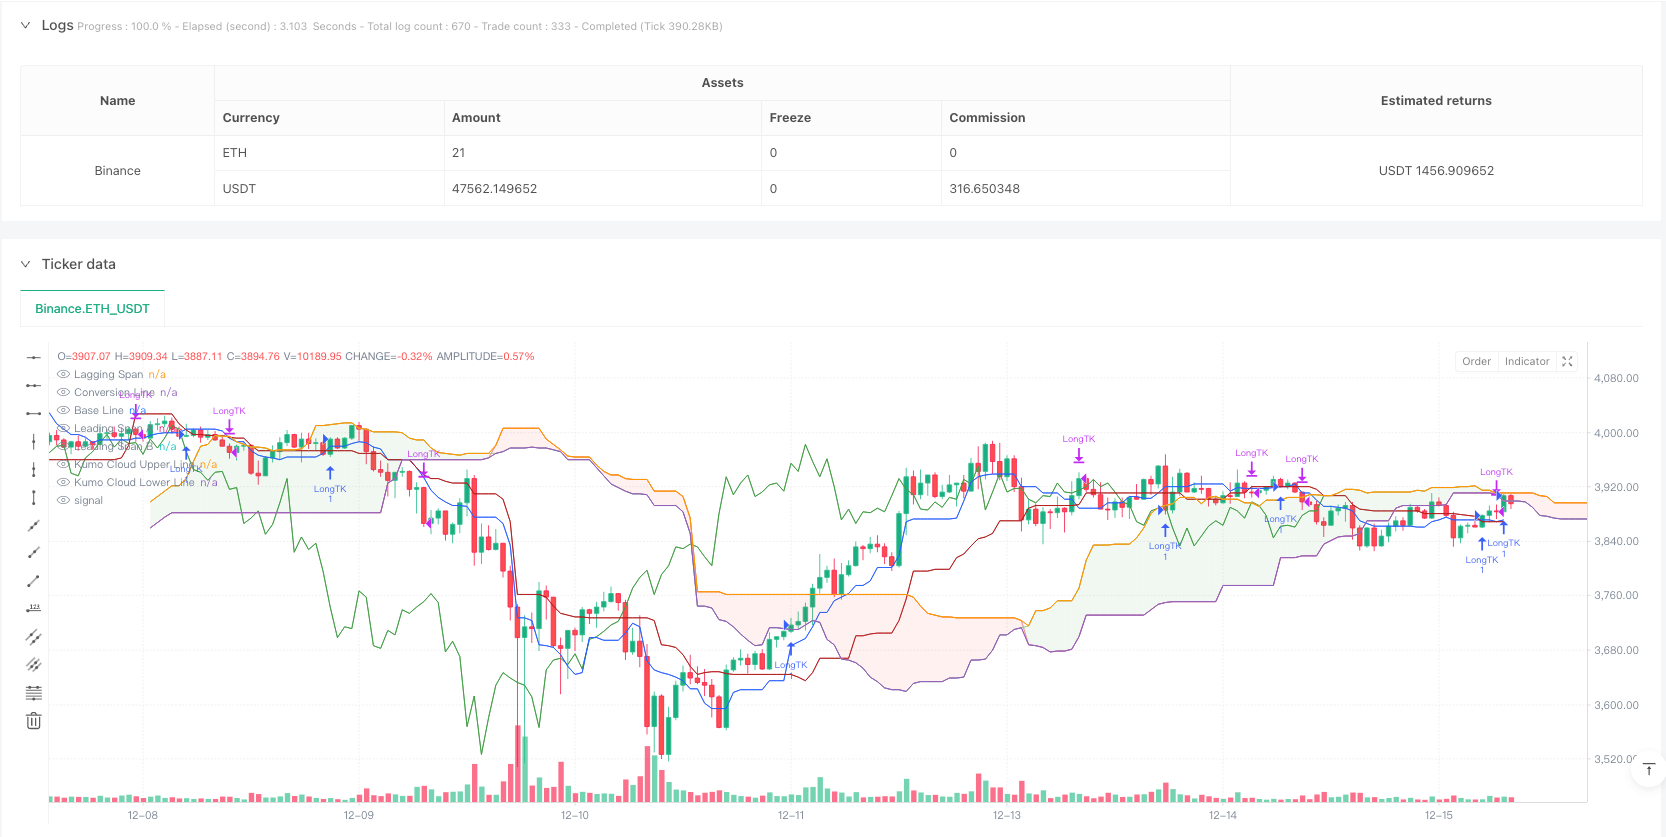
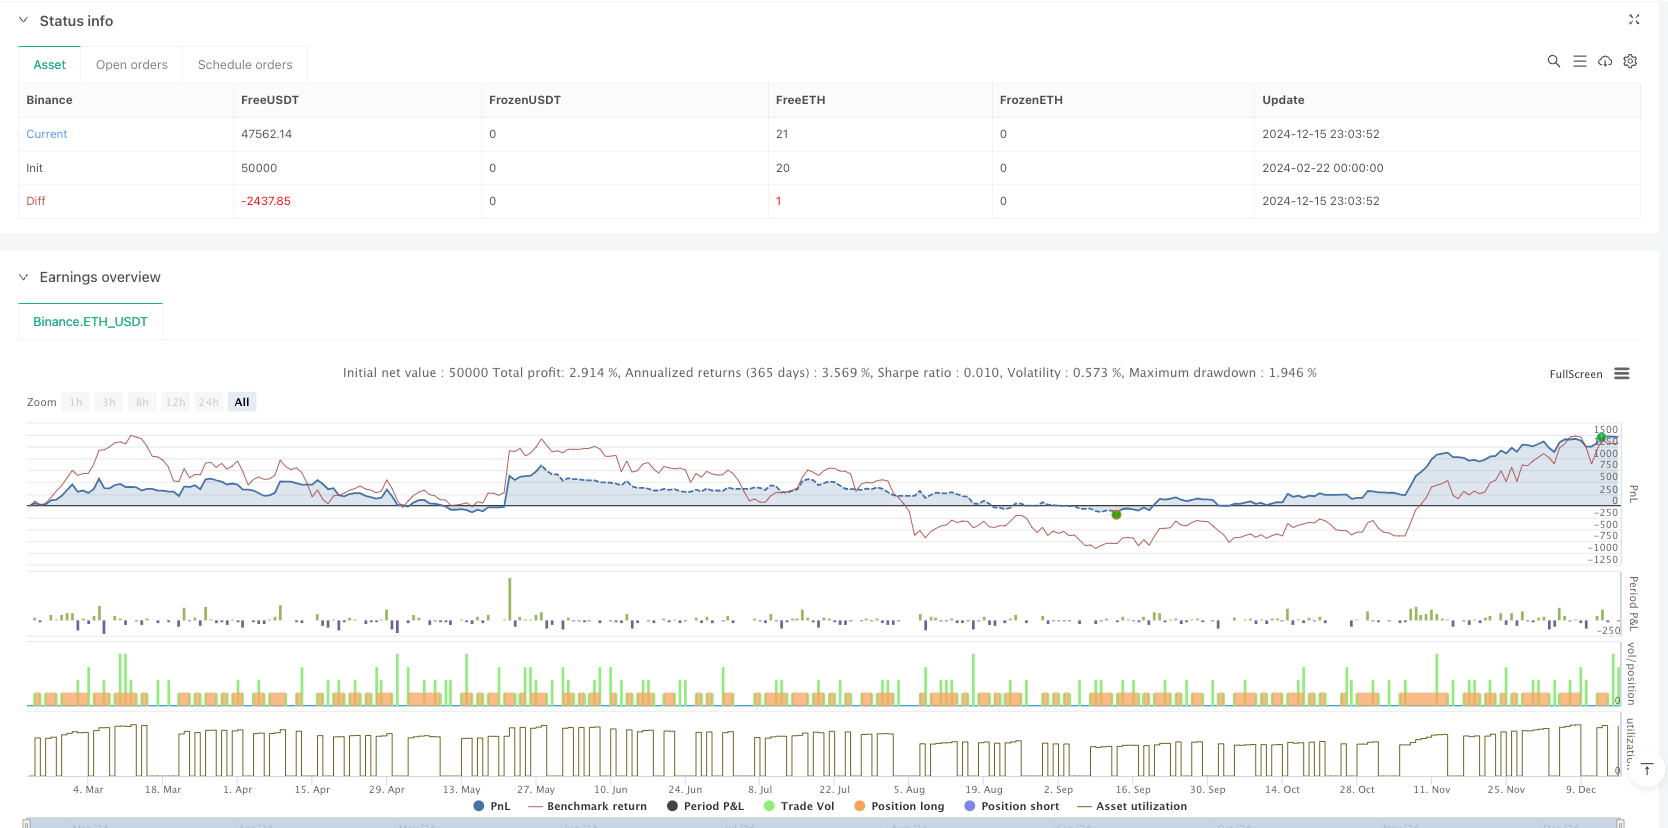
Overview
This strategy is an enhanced version of the classic Ichimoku Kinko Hyo system, utilizing dynamic crossovers between the Conversion and Base lines to identify trading signals. It incorporates automated trading signal generation and execution logic, along with visual labels to improve trend readability.
Strategy Principles
The strategy is built upon the five main lines of the Ichimoku system: Conversion Line (9 periods), Base Line (26 periods), Leading Span A, Leading Span B (52 periods), and Lagging Span. The primary trading signals are generated from crossovers between the Conversion and Base lines. Long positions are entered when the Conversion Line crosses above the Base Line and closed when it crosses below. The strategy employs dynamic Donchian channels to calculate each line by averaging the highest and lowest prices to reflect price volatility.
Strategy Advantages
- Systematic Trend Following - Combines multiple timeframe indicators for comprehensive trend capture.
- Visual Clarity - Utilizes color labels and cloud visualization for clear signal identification.
- Integrated Risk Management - Features built-in stop-loss mechanisms for automatic position closure on market reversals.
- High Adaptability - Adjustable parameters allow adaptation to different market conditions.
- Signal Stability - Uses moving average crossovers to filter false signals and improve trade quality.
Strategy Risks
- Trend Reversal Delay - Inherent lag due to moving average calculations.
- Poor Performance in Ranging Markets - May generate false signals during consolidation phases.
- Parameter Sensitivity - Strategy performance significantly affected by parameter settings.
- Cloud Complexity - Multiple intersecting lines may complicate signal interpretation.
Optimization Directions
- Volatility Filtering - Incorporate ATR indicator for position sizing adjustment.
- Entry Timing Enhancement - Integrate momentum indicators like RSI for signal confirmation.
- Stop-Loss Refinement - Implement dynamic stop-loss based on cloud support levels.
- Volume Confirmation - Add volume analysis for signal validation.
- Market Environment Filtering - Include trend strength indicators for market condition selection.
Summary
This strategy enhances the traditional Ichimoku system to create a comprehensive trend-following trading system. While it exhibits some lag, optimization through signal filtering and risk management enables stable performance in trending markets. Traders should adjust parameters based on market conditions and risk preferences while continuously monitoring strategy performance.
Source Pine Script
/*backtest
start: 2024-02-22 00:00:00
end: 2024-12-16 00:00:00
period: 1h
basePeriod: 1h
exchanges: [{"eid":"Binance","currency":"ETH_USDT"}]
*/

//@version=6

strategy(title="Ichimoku Cloud with Lables", shorttitle="Ichimoku", overlay=true)
conversionPeriods = input.int(9, minval=1, title="Conversion Line Length")
basePeriods = input.int(26, minval=1, title="Base Line Length")
laggingSpan2Periods = input.int(52, minval=1, title="Leading Span B Length")
displacement = input.int(26, minval=1, title="Lagging Span")
donchian(len) => math.avg(ta.lowest(len), ta.highest(len))
conversionLine = donchian(conversionPeriods)
baseLine = donchian(basePeriods)
leadLine1 = math.avg(conversionLine, baseLine)
leadLine2 = donchian(laggingSpan2Periods)
plot(conversionLine, color=#2962FF, title="Conversion Line")
plot(baseLine, color=#B71C1C, title="Base Line")


plot(close, offset = -displacement + 1, color=#43A047, title="Lagging Span", display = display.none)
p1 = plot(leadLine1, offset = displacement - 1, color=#A5D6A7,
	 title="Leading Span A")
p2 = plot(leadLine2, offset = displacement - 1, color=#EF9A9A,
	 title="Leading Span B")
plot(leadLine1 > leadLine2 ? leadLine1 : leadLine2, offset = displacement - 1, title = "Kumo Cloud Upper Line", display = display.none)
plot(leadLine1 < leadLine2 ? leadLine1 : leadLine2, offset = displacement - 1, title = "Kumo Cloud Lower Line", display = display.none)
fill(p1, p2, color = leadLine1 > leadLine2 ? color.rgb(67, 160, 71, 90) : color.rgb(244, 67, 54, 90))

if barstate.islast
    label.new(bar_index+5,baseLine,style=label.style_none,xloc=xloc.bar_index,text="Base",color=color.white,textcolor=#B71C1C)
    label.new(bar_index +8, conversionLine,style=label.style_none,xloc=xloc.bar_index,text="Conversion",color=color.white,textcolor=#2962FF)
	label.new(bar_index+(displacement-1)+5,leadLine1,style=label.style_none,xloc=xloc.bar_index,text="Lead1",color=color.white,textcolor=#A5D6A7)
	label.new(bar_index+(displacement-1)+5,leadLine2,style=label.style_none,xloc=xloc.bar_index,text="Lead2",color=color.white,textcolor=#EF9A9A)

// --- TRADING LOGIC ---

// 1) Detect bullish cross (Conversion crosses above Base)
longSignal = ta.crossover(conversionLine, baseLine)

// 2) Detect bearish cross (Conversion crosses below Base)
closeSignal = ta.crossunder(conversionLine, baseLine)

// 3) If bullish cross occurs, open a new long
if longSignal
    strategy.entry("LongTK", strategy.long)

// 4) If bearish cross occurs, close the open long
if closeSignal
    // Closes all orders opened with the ID "LongTK"
    strategy.close("LongTK")
Published by ianzeng123 on the FMZ strategy square · last modified 2025-02-21. Collected in the Quant Trading Vault. Unvalidated research: re-test with your own data and costs before trusting it.
Build this with AgenKit
A spec is not a trading system. Paste this into your coding agent and AgenKit runs a specialist team — architecture, test-first build, risk gates, review — with paper trading on by default.
/agenkit build a production-grade trading bot with a backtest engine, risk controls and paper trading by default from strategies/Enhanced-Ichimoku-Cloud-Trading-Strategy-with-Dynamic-Crossover-Signals.md- npx agenkit install engineering-kit in your project
- Paste the command into your agent and approve each phase
- Get tests, backtest, risk controls and a paper-trading switch
Understand it first
Before you run this, read the lesson behind the idea and how to backtest it honestly. Specs like this one are the survivors of an unknown number of trials; deflate their results accordingly.
Related specs
- TrendHunter w MF Multi Timeframe Trend StrategyPine Script · Trend following · 1h
- Multitimeframe Trend Hunter StrategyPine Script · Trend following · 1h
- Dual ATR Channel Trend Following StrategyPine Script · Trend following · 15m
- Fixed Range Volume Profile And Anchored VWAP Trend Identification Strategy With Dynamic Stop LossPine Script · Trend following · 1h
- Triple Supertrend Ichimoku Cloud Quantitative Trading StrategyPine Script · Trend following · 1d
- A Strict Trend Following Strategy Based on Ichimoku Kinko HyoPine Script · Trend following · 30m