Strategy vault / Trend following
Enhanced Moving Average Crossover Sakkoulas Trading Strategy
This trading strategy combines moving average convergence divergence (MACD), relative strength index (RSI), simple moving average (SMA), stochastic oscillator and Bollinger bands to identify market entry and exit…
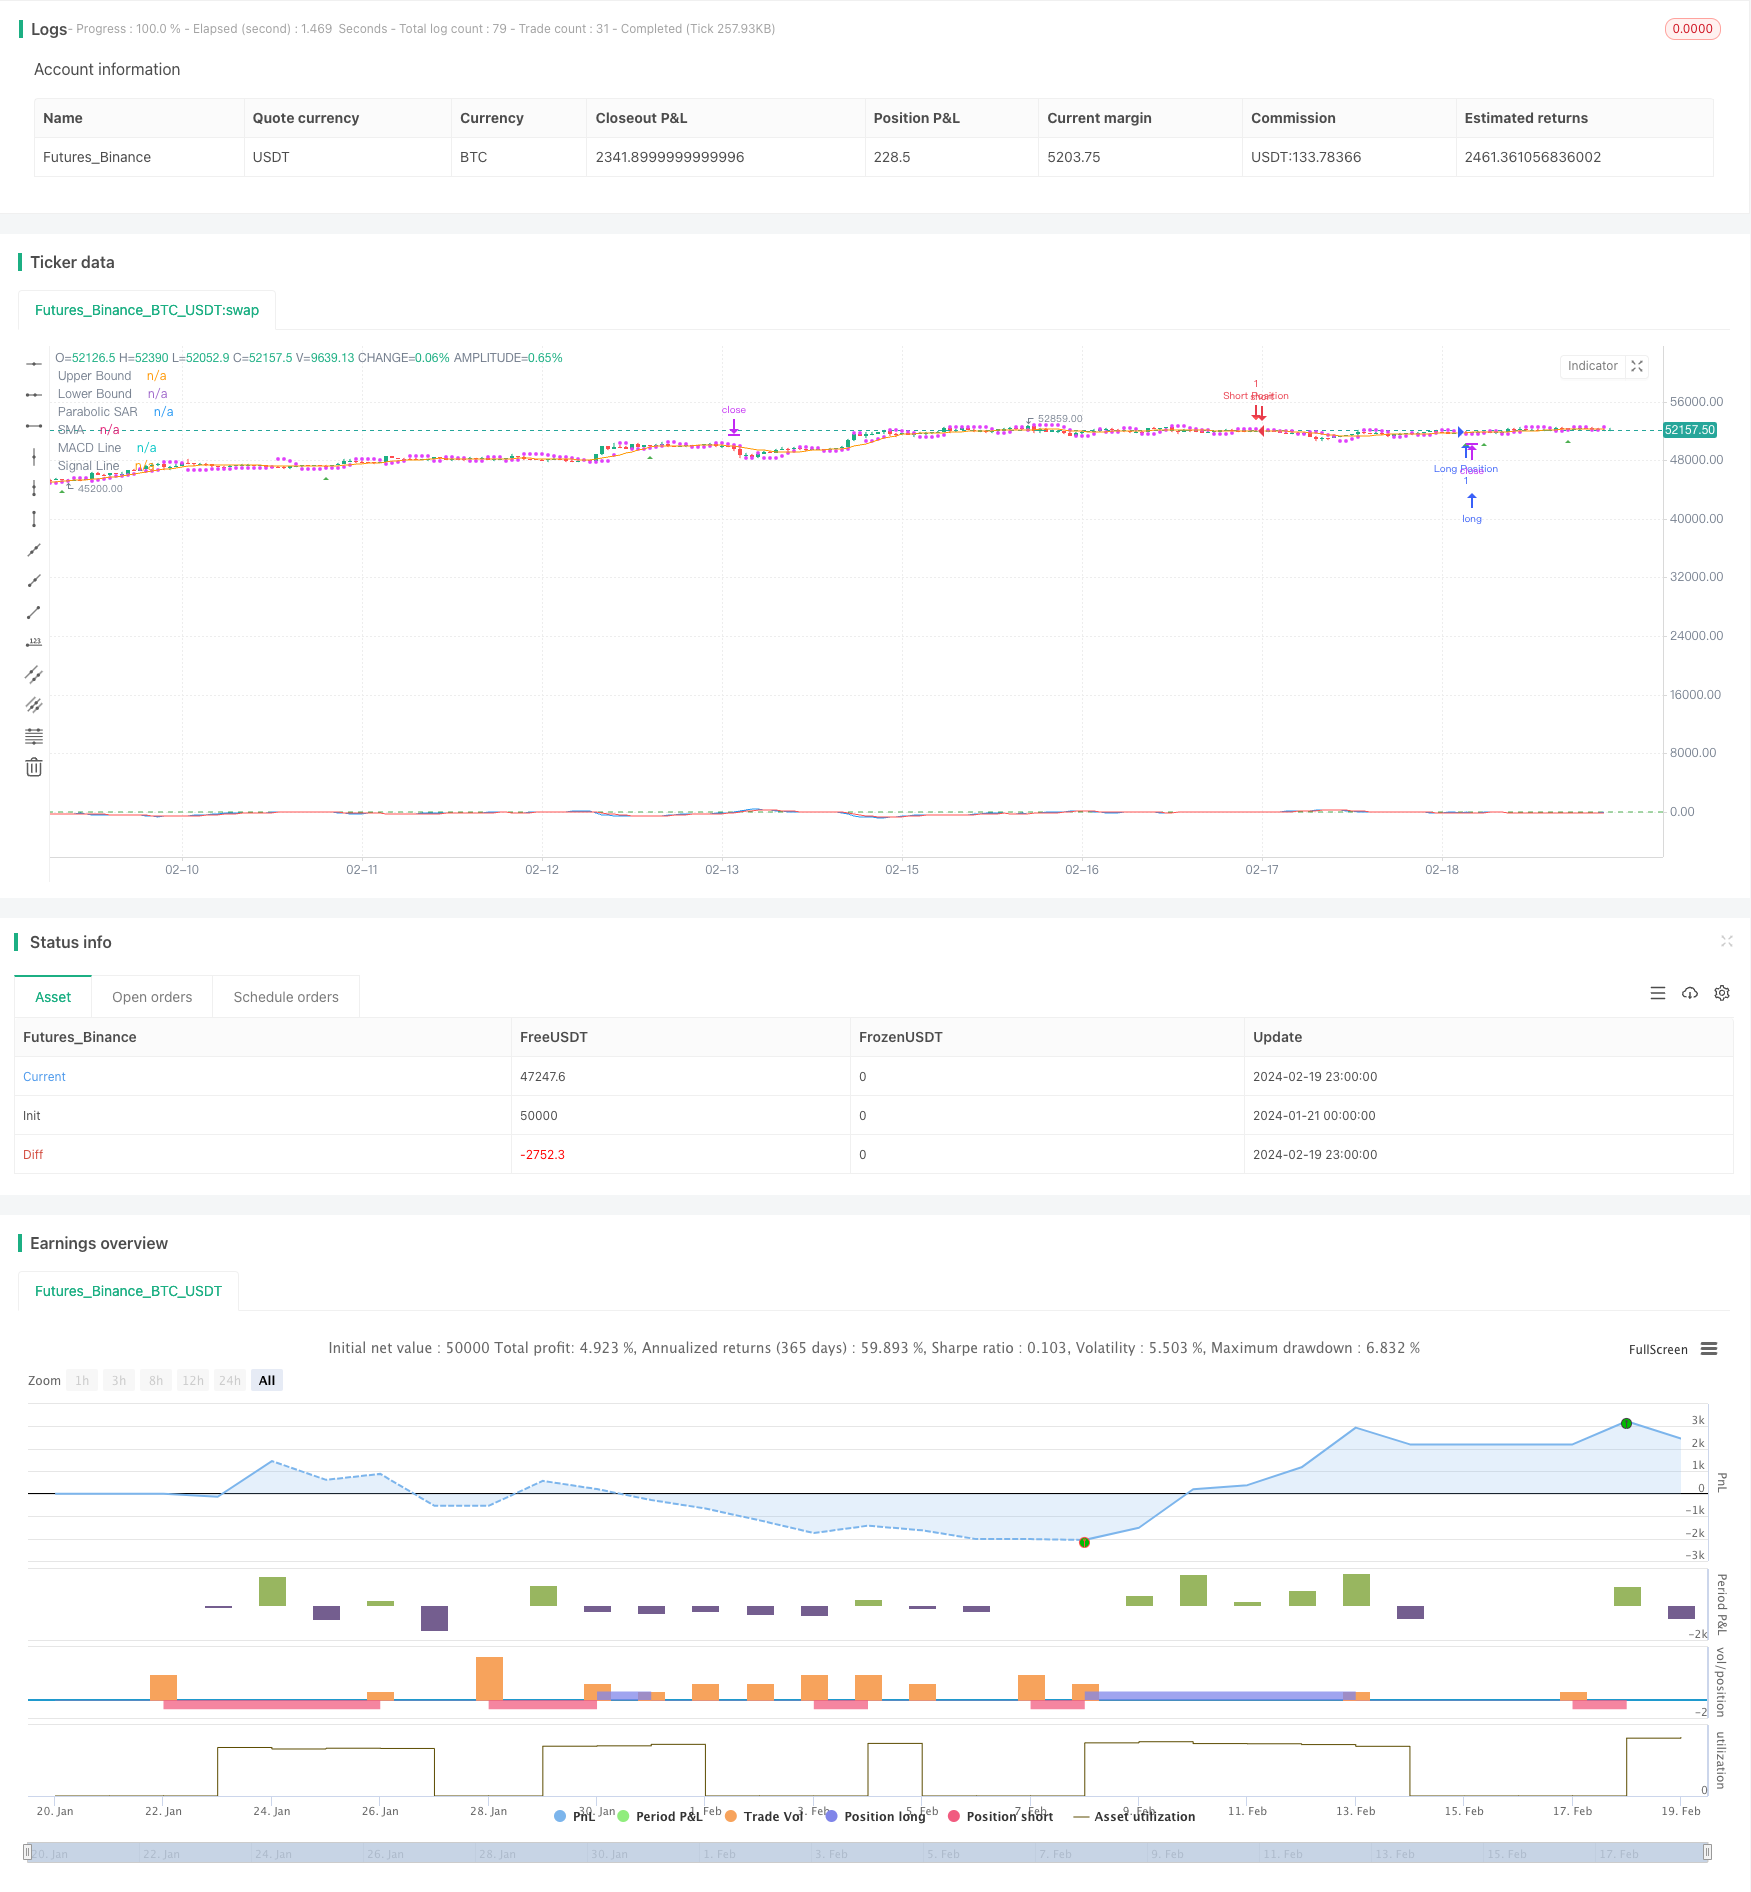
Overview
This trading strategy combines moving average convergence divergence (MACD), relative strength index (RSI), simple moving average (SMA), stochastic oscillator and Bollinger bands to identify market entry and exit points. It goes long when indicators show bullish signals and goes short when bearish signals appear. Risk is controlled by stop loss and take profit.
Strategy Logic
It goes long when the MACD DIF line crosses above the DEA line into bullish zone; or when RSI drops below 30 into oversold territory; or when stochastic %K and %D lines fall below 20 showing oversold status.
On the contrary, it goes short when MACD DIF line crosses below DEA line into bearish zone; or when RSI rises above 70 into overbought area; or when stochastic %K and %D lines climb over 80 indicating overbought condition.
Stop loss is set based on ATR multiplied by a coefficient. Take profit is determined by risk-reward ratio.
Advantage Analysis
This strategy combines multiple indicators to judge market status, avoiding errors by single metric and improving accuracy. Also stop loss and take profit are reasonably set to control risk for each trade.
Risk Analysis
Technical indicators are calculated from historical data and cannot predict future prices, leading to certain lags. Combining multiple indicators may also introduce some false signals. In addition, improper stop loss setting can result in larger losses.
To tackle indicator lag issue, parameters can be adjusted to shorten computing cycle. For false signals, additional auxiliary indicators can be added for confirmation. Also, stop loss should be set wider and more reasonably.
Optimization Directions
The strategy can be enhanced in the following aspects:
- Incorporate statistical model indicators based on trend and correlation analysis for entry;
- Add machine learning model to judge reliability of indicator signals;
- Optimize money management for more automated and intelligent stop loss and take profit.
Summary
This strategy combines multiple technical indicators for improved accuracy and controls risk via stop loss and take profit, making it a reliable trend following system. Its performance is expected to be further boosted by introducing statistical and machine learning techniques going forward.
Parameters
| Name | Default | What it controls |
|---|---|---|
| v_input_int_1 | 16 | Fast Length |
| v_input_int_2 | 6 | Slow Length |
| v_input_int_3 | 5 | Signal Smoothing |
| v_input_int_4 | 6 | RSI Length |
| v_input_int_5 | 70 | Upper Bound |
| v_input_int_6 | 30 | Lower Bound |
| v_input_int_7 | 10 | SMA Period |
| v_input_int_8 | 5 | Stochastic Length |
| v_input_int_9 | 3 | Stochastic %K Smoothing |
| v_input_int_10 | 10 | Stochastic %D Smoothing |
| v_input_int_11 | 20 | Bollinger Bands Length |
| v_input_float_1 | true | Bollinger Bands StdDev |
| v_input_int_12 | 14 | ATR Length |
| v_input_float_2 | 1.5 | ATR Multiplier for Stop Loss |
| v_input_float_3 | 0.02 | SAR Acceleration |
| v_input_float_4 | 0.2 | SAR Maximum |
| v_input_float_5 | 2 | Risk/Reward Ratio |
Source Pine Script
/*backtest
start: 2024-01-21 00:00:00
end: 2024-02-20 00:00:00
period: 1h
basePeriod: 15m
exchanges: [{"eid":"Futures_Binance","currency":"BTC_USDT"}]
*/

//@version=5
strategy("Enhanced Moving Average Crossover sakkoulas with ATR and SAR", overlay=true)

// Παράμετροι MACD
fastLength = input.int(16, title="Fast Length")
slowLength = input.int(6, title="Slow Length")
signalSmoothing = input.int(5, title="Signal Smoothing")

// Παράμετροι RSI
rsiLength = input.int(6, title="RSI Length")
upperBound = input.int(70, title="Upper Bound")
lowerBound = input.int(30, title="Lower Bound")

// Παράμετροι SMA
smaPeriod = input.int(10, title="SMA Period")

// Παράμετροι Stochastic
stoLength = input.int(5, title="Stochastic Length")
stoSmoothK = input.int(3, title="Stochastic %K Smoothing")
stoSmoothD = input.int(10, title="Stochastic %D Smoothing")

// Παράμετροι Bollinger Bands
bbLength = input.int(20, title="Bollinger Bands Length")
bbStdDev = input.float(1, title="Bollinger Bands StdDev")

// Παράμετροι ATR
atrLength = input.int(14, title="ATR Length")
atrMultiplier = input.float(1.5, title="ATR Multiplier for Stop Loss")

// Παράμετροι Parabolic SAR
sarAcceleration = input.float(0.02, title="SAR Acceleration")
sarMaximum = input.float(0.2, title="SAR Maximum")

// Διαχείριση κινδύνου
riskRewardRatio = input.float(2.0, title="Risk/Reward Ratio")

// Υπολογισμοί δεικτών
[macdLine, signalLine, _] = ta.macd(close, fastLength, slowLength, signalSmoothing)
rsi = ta.rsi(close, rsiLength)
sma = ta.sma(close, smaPeriod)
atr = ta.atr(atrLength)

// Παράμετροι και κλήση του Parabolic SAR
sar = ta.sar(sarAcceleration, sarMaximum, 15) // Διορθωμένη κ
// Υπολογισμός Stop Loss με βάση το ATR
longStopLoss = close - atrMultiplier * atr
shortStopLoss = close + atrMultiplier * atr

// Συνθήκες για είσοδο και έξοδο
longCondition = ta.crossover(macdLine, signalLine) and close > sar
shortCondition = ta.crossunder(macdLine, signalLine) and close < sar

// Εκτέλεση εντολών συναλλαγής με διαχείριση κινδύνου
if (longCondition)
    strategy.entry("Long Position", strategy.long)
    strategy.exit("Exit Long", "Long Position", stop=longStopLoss)

if (shortCondition)
    strategy.entry("Short Position", strategy.short)
    strategy.exit("Exit Short", "Short Position", stop=shortStopLoss)

// Συνθήκες για είσοδο και έξοδο

// Εμφάνιση βελών για σημεία εισόδου
plotshape(series=longCondition, location=location.belowbar, color=color.green, style=shape.triangleup, size=size.small, title="Long Entry")
plotshape(series=shortCondition, location=location.abovebar, color=color.red, style=shape.triangledown, size=size.small, title="Short Entry")


// Εμφάνιση δεικτών
plot(macdLine, color=color.blue, title="MACD Line")
plot(signalLine, color=color.red, title="Signal Line")
plot(sma, color=color.orange, title="SMA")
plot(series=sar, color=color.fuchsia, style=plot.style_circles, title="Parabolic SAR")
hline(upperBound, "Upper Bound", color=color.red)
hline(lowerBound, "Lower Bound", color=color.green)Published by ChaoZhang on the FMZ strategy square · last modified 2024-02-21. Collected in the Quant Trading Vault. Unvalidated research: re-test with your own data and costs before trusting it.
Build this with AgenKit
A spec is not a trading system. Paste this into your coding agent and AgenKit runs a specialist team — architecture, test-first build, risk gates, review — with paper trading on by default.
/agenkit build a production-grade trading bot with a backtest engine, risk controls and paper trading by default from strategies/Enhanced-Moving-Average-Crossover-Sakkoulas-Trading-Strategy.md- npx agenkit install engineering-kit in your project
- Paste the command into your agent and approve each phase
- Get tests, backtest, risk controls and a paper-trading switch
Understand it first
Before you run this, read the lesson behind the idea and how to backtest it honestly. Specs like this one are the survivors of an unknown number of trials; deflate their results accordingly.
Related specs
- Indicator Verification Automated Trading StrategyPine Script · Trend following · 10m
- SuperTrend Trading Strategy with Multiple FiltersPine Script · Trend following · 1h
- Bollinger Bands and RSI Trend Following StrategyPine Script · Trend following · 1h
- Dual ATR Channel Trend Following StrategyPine Script · Trend following · 15m
- EMA and RSI Trend Trading StrategyPine Script · Trend following · 1d
- Multi Dimensional Short Term Trend Predictor Technical Analysis and Volatility Adaptive Trading StrategyPine Script · Trend following · 1h