Strategy vault / Trend following
Fast and Slow Moving Averages Crossover Strategy
The fast and slow moving average crossover strategy is a simple moving average-based strategy. It uses two moving averages, one fast and one slow. When the fast moving average crosses above the slow moving average…
Overview
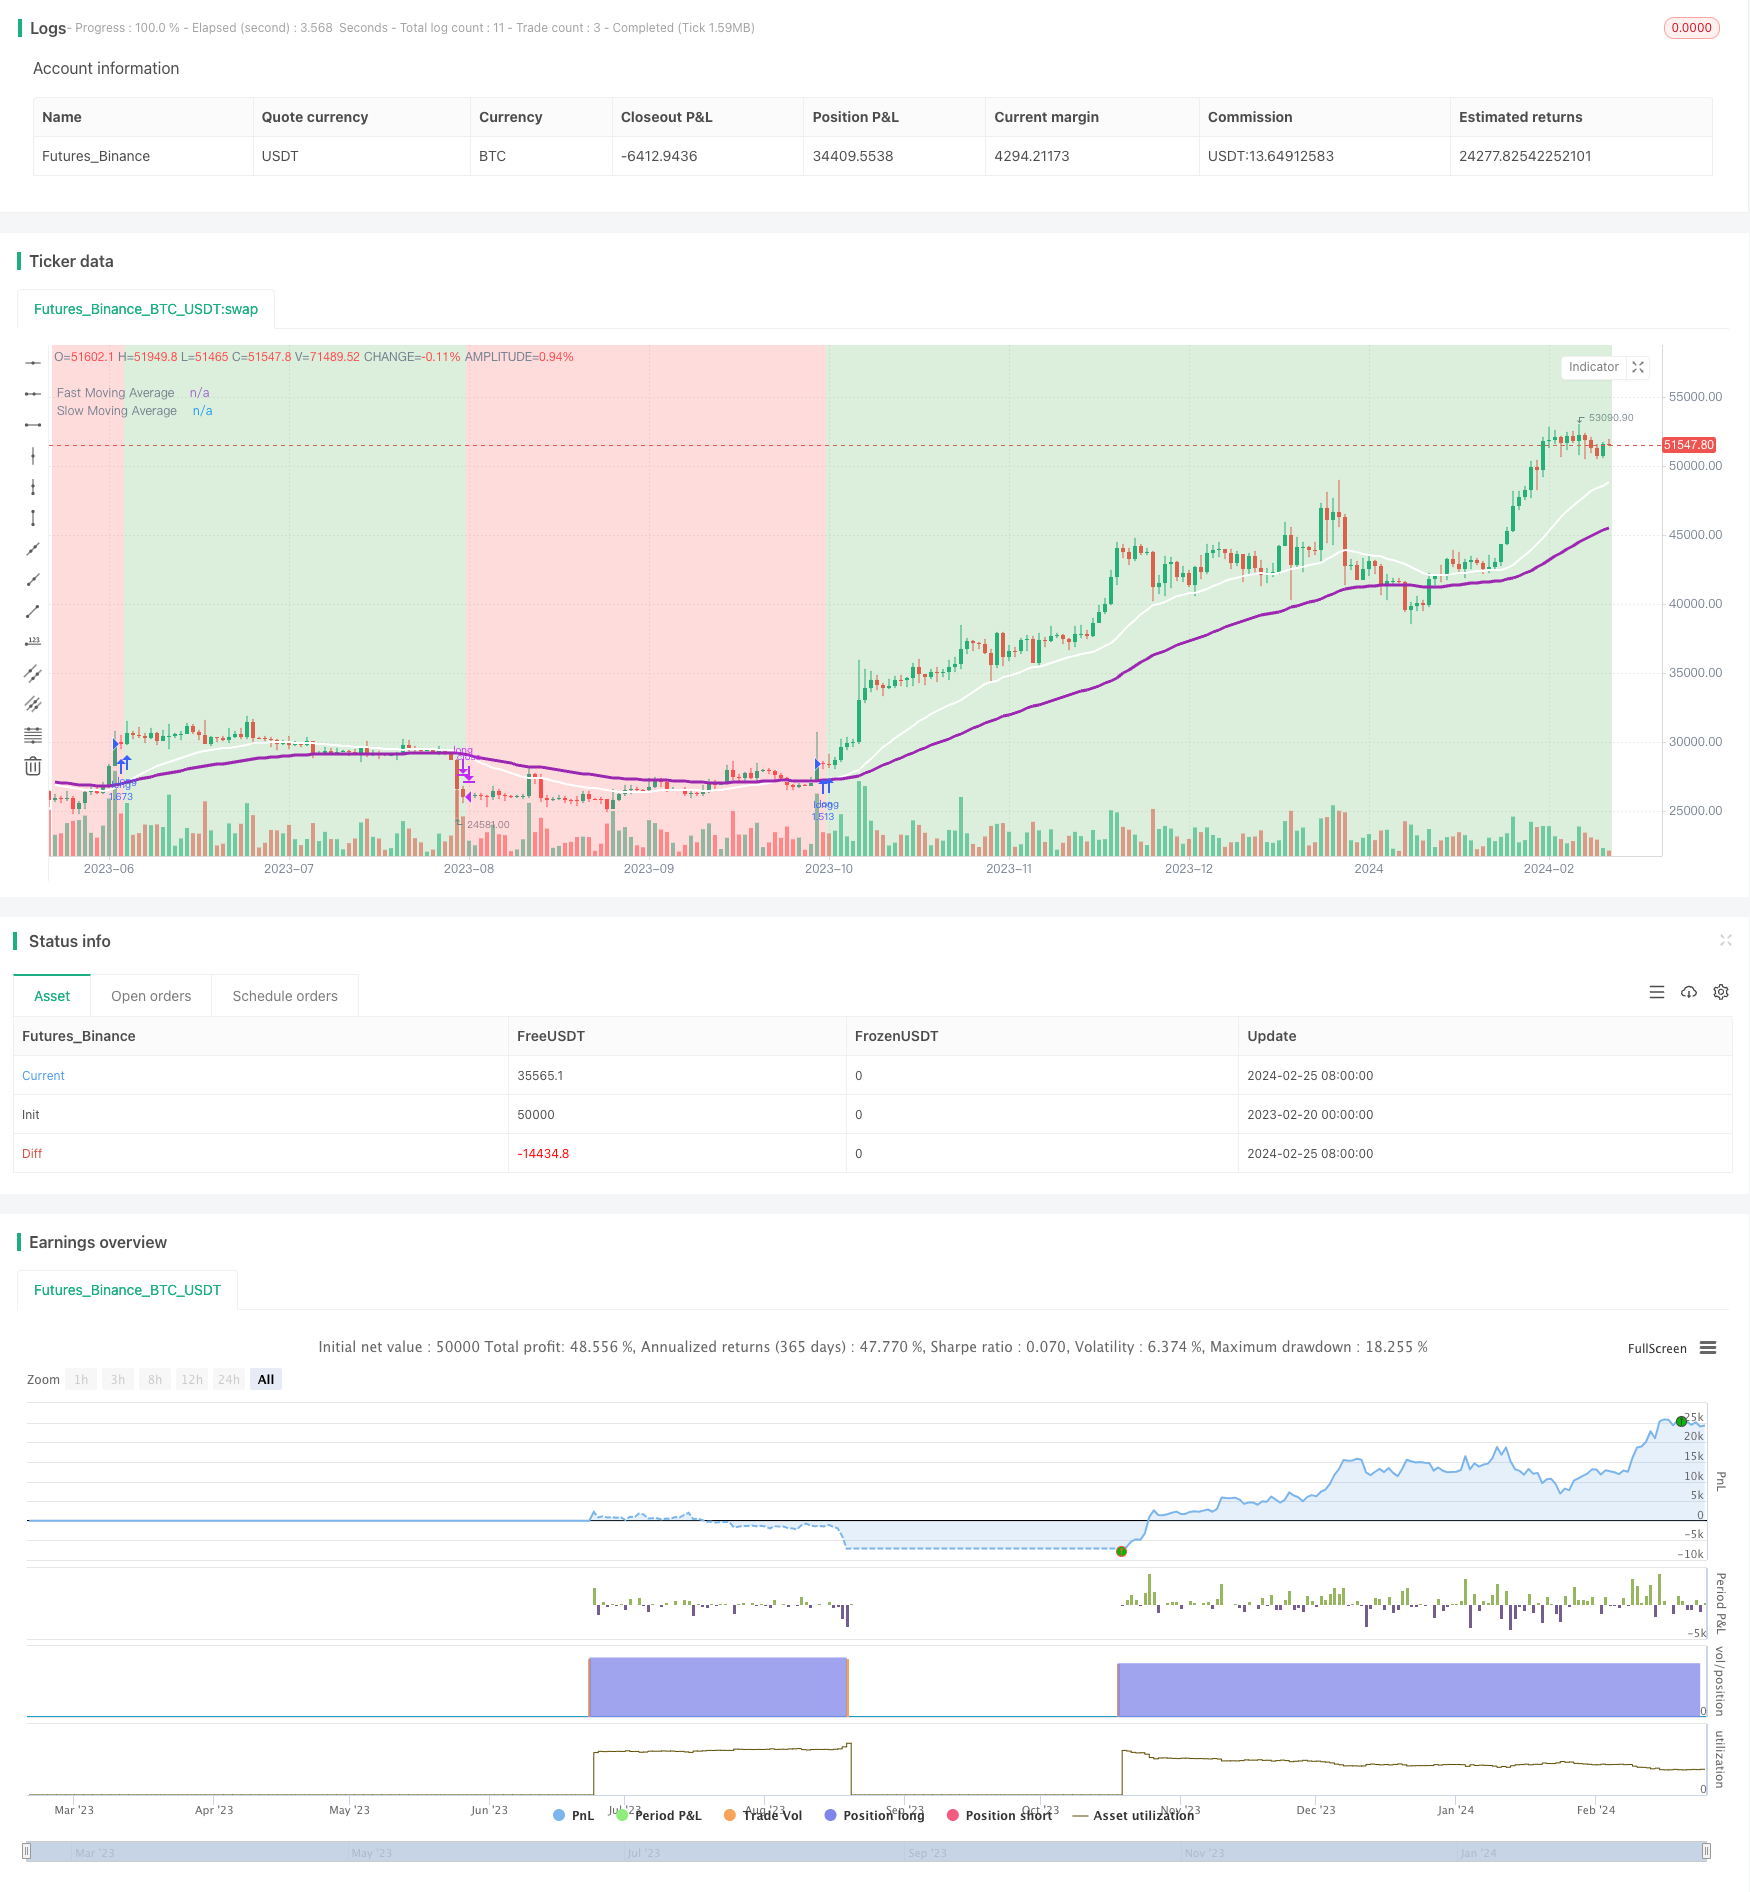
The fast and slow moving average crossover strategy is a simple moving average-based strategy. It uses two moving averages, one fast and one slow. When the fast moving average crosses above the slow moving average from below, it goes long, indicating that prices may rise. When the fast moving average crosses below the slow moving average from above, it exits its position, indicating that prices may fall. This can serve as an indicator to predict future price action.
Principles
The strategy uses two moving averages, one fast and one slow. Specifically, the default lengths are 25 periods for the fast moving average and 62 periods for the slow one. The strategy allows the selection of different types of moving averages, including SMA, EMA, WMA, RMA and VWMA.
When the fast moving average crosses above the slow moving average from below, it signals that short-term prices have started to break through long-term prices, which is a typical golden cross signal, indicating that prices may enter an uptrend. The strategy goes long at this point. When the fast moving average crosses below the slow moving average from above, it signals that short-term prices have started to break down long-term prices, which is a death cross signal, indicating that prices may enter a downtrend. The strategy exits its position at this point.
By using the crossover of fast and slow moving averages to determine price trend and direction, and taking corresponding long or close positions, profits can be realized.
Advantage Analysis
The strategy has the following advantages:
- The idea is simple and easy to understand and implement
- Flexible parameter settings, with customizable periods and types of moving averages
- Reliable indicator, accurate in determining price trends using moving average crossover
- Automation realized, reducing influence of psychological factors without manual judgment
- Applicable to multiple products, can be widely used for indices, forex, cryptocurrencies etc
- Easy to optimize, parameters can be adjusted to find better configurations
- Strong extensibility, can be combined with other indicators or strategies
In summary, with the fast and slow moving average crossover as the core trading signal, the strategy has a strong capability in judging future price trends. Based on its trend following merits, decent profits can be realized, making it worthwhile for live trading applications.
Risk Analysis
The strategy also has some potential risks:
- Crossover signals may give false signals, with prices just having short-term corrections rather than long-term trend reversals
- Inappropriate selection of short and long moving average lengths may lead to too frequent trading or missing good opportunities
- Crossover signals may not be significant during violent price fluctuations
- High trading costs may erode profits if crossover signals trigger too frequent trading
- Strong extensibility also introduces risks of over-optimization
To control and mitigate these risks, the following methods can be adopted:
- Use other indicators to filter signals and avoid false signals e.g. price-volume divergence indicators
- Adjust moving average parameters to find optimal combinations and reduce erroneous trading
- Temporarily stop the strategy during violent market swings
- Relax stop loss range appropriately to reduce unnecessary losses
- Conduct robustness tests across multiple products to evaluate risks and prevent over-optimization
Optimization Directions
The main directions for optimizing the strategy include:
Selection of periods for fast and slow moving averages: default parameters may not be optimal, different periods can be tested to find best configuration
Selection of moving average types: multiple types provided and can test which works best for specific products
Combination with other indicators or strategies: can try combining with volatility indicators, volume-price indicators or trend following strategies to improve performance
Parameter adaptive optimization: allow periods of moving averages to adjust automatically based on market volatility and liquidity to improve stability
AI model assistance: use machine learning algorithms to analyze large amounts of data and automatically search for optimal trading rules
Through these optimization methods, further improvement can be expected in the strategy's profitability and stability.
Summary
In summary, the fast and slow moving average crossover strategy is a very practical trend following strategy. It captures the price change patterns across different time frames, using the fast moving average's crossover of the slow moving average to determine probable future price trend and direction. The strategy idea is simple and clear, easy to understand and implement, offers flexible customizable parameters, and also has high reliability, degree of automation, wide applicability and strong extensibility. Of course risks of false signals exist, needing combination with other indicators to achieve maximum effect. With continuous testing and optimization, the strategy has potential to achieve decent steady profits in live trading.
Parameters
| Name | Default | What it controls |
|---|---|---|
| v_input_int_1 | 25 | Fast moving average length |
| v_input_int_2 | 62 | Slow moving average length |
| v_input_string_1 | 0 | MA type: EMA | VWMA | SMA | RMA | WMA |
| v_input_string_2 | 0 | (?Display)Red Background Color On/Off: On | Off |
| v_input_string_3 | 0 | Green Background Color On/Off: On | Off |
| v_input_string_4 | 0 | Moving Average Plot On/Off: On | Off |
| v_input_int_3 | true | (?Beginning of Strategy)Start Month 1-12 (set any start time to 0 for furthest date) |
| v_input_int_4 | true | Start Date 1-31 (set any start time to 0 for furthest date) |
| v_input_int_5 | 2011 | Start Year 2000-2100 (set any start time to 0 for furthest date) |
| v_input_int_6 | false | (?End of Strategy)End Month 1-12 (set any end time to 0 for today's date) |
| v_input_int_7 | false | End Date 1-31 (set any end time to 0 for today's date) |
| v_input_int_8 | false | End Year 2000-2100 (set any end time to 0 for today's date) |
Source Pine Script
/*backtest
start: 2023-02-20 00:00:00
end: 2024-02-26 00:00:00
period: 1d
basePeriod: 1h
exchanges: [{"eid":"Futures_Binance","currency":"BTC_USDT"}]
*/

//@version=5
//Author @divonn1994

initial_balance = 100
strategy(title='Fast v Slow Moving Averages Strategy', shorttitle = 'Fast v Slow', overlay=true, pyramiding=0, default_qty_value=100, default_qty_type=strategy.percent_of_equity, precision=7, currency=currency.USD, commission_value=0.1, commission_type=strategy.commission.percent, initial_capital=initial_balance)

//Input for number of bars for moving average, Switch to choose moving average type, Display Options and Time Frame of trading----------------------------------------------------------------

fastBars = input.int(25, "Fast moving average length", minval=1)
slowBars = input.int(62, "Slow moving average length", minval=1)
strategy = input.string("EMA", "MA type", options = ["EMA", "VWMA", "SMA", "RMA", "WMA"])

redOn = input.string("On", "Red Background Color On/Off", options = ["On", "Off"], group='Display')
greenOn = input.string("On", "Green Background Color On/Off", options = ["On", "Off"], group='Display')
maOn = input.string("On", "Moving Average Plot On/Off", options = ["On", "Off"], group='Display')

startMonth = input.int(title='Start Month 1-12 (set any start time to 0 for furthest date)', defval=1, minval=0, maxval=12, group='Beginning of Strategy')
startDate = input.int(title='Start Date 1-31 (set any start time to 0 for furthest date)', defval=1, minval=0, maxval=31, group='Beginning of Strategy')
startYear = input.int(title='Start Year 2000-2100 (set any start time to 0 for furthest date)', defval=2011, minval=2000, maxval=2100, group='Beginning of Strategy')

endMonth = input.int(title='End Month 1-12 (set any end time to 0 for today\'s date)', defval=0, minval=0, maxval=12, group='End of Strategy')
endDate = input.int(title='End Date 1-31 (set any end time to 0 for today\'s date)', defval=0, minval=0, maxval=31, group='End of Strategy')
endYear = input.int(title='End Year 2000-2100 (set any end time to 0 for today\'s date)', defval=0, minval=0, maxval=2100, group='End of Strategy')

//Strategy Calculations-----------------------------------------------------------------------------------------------------------------------------------------------------------------------

inDateRange = true

maMomentum = switch strategy
    "EMA" => (ta.ema(close, fastBars) >= ta.ema(close, slowBars)) ? 1 : -1
    "SMA" => (ta.sma(close, fastBars) >= ta.sma(close, slowBars)) ? 1 : -1
    "RMA" => (ta.rma(close, fastBars) >= ta.rma(close, slowBars)) ? 1 : -1
    "WMA" => (ta.wma(close, fastBars) >= ta.wma(close, slowBars)) ? 1 : -1
    "VWMA" => (ta.vwma(close, fastBars) >= ta.vwma(close, slowBars)) ? 1 : -1
    =>
        runtime.error("No matching MA type found.")
        float(na)

fastMA = switch strategy
    "EMA" => ta.ema(close, fastBars)
    "SMA" => ta.sma(close, fastBars)
    "RMA" => ta.rma(close, fastBars)
    "WMA" => ta.wma(close, fastBars)
    "VWMA" => ta.vwma(close, fastBars)
    =>
        runtime.error("No matching MA type found.")
        float(na)

slowMA = switch strategy
    "EMA" => ta.ema(close, slowBars)
    "SMA" => ta.sma(close, slowBars)
    "RMA" => ta.rma(close, slowBars)
    "WMA" => ta.wma(close, slowBars)
    "VWMA" => ta.vwma(close, slowBars)
    =>
        runtime.error("No matching MA type found.")
        float(na)

//Enter or Exit Positions--------------------------------------------------------------------------------------------------------------------------------------------------------------------

if ta.crossover(maMomentum, 0)
    if inDateRange
        strategy.entry('long', strategy.long, comment='long')
if ta.crossunder(maMomentum, 0)
    if inDateRange
        strategy.close('long')

//Plot Strategy Behavior---------------------------------------------------------------------------------------------------------------------------------------------------------------------

plot(series = maOn == "On" ? fastMA : na, title = "Fast Moving Average", color = color.new(color.white,0), linewidth=2, offset=1)
plot(series = maOn == "On" ? slowMA : na, title = "Slow Moving Average", color = color.new(color.purple,0), linewidth=3, offset=1)
bgcolor(color = inDateRange and (greenOn == "On") and maMomentum > 0 ? color.new(color.green,75) : inDateRange and (redOn == "On") and maMomentum <= 0 ? color.new(color.red,75) : na, offset=1)Published by ChaoZhang on the FMZ strategy square · last modified 2024-02-27. Collected in the Quant Trading Vault. Unvalidated research: re-test with your own data and costs before trusting it.
Build this with AgenKit
A spec is not a trading system. Paste this into your coding agent and AgenKit runs a specialist team — architecture, test-first build, risk gates, review — with paper trading on by default.
/agenkit build a production-grade trading bot with a backtest engine, risk controls and paper trading by default from strategies/Fast-and-Slow-Moving-Averages-Crossover-Strategy.md- npx agenkit install engineering-kit in your project
- Paste the command into your agent and approve each phase
- Get tests, backtest, risk controls and a paper-trading switch
Understand it first
Before you run this, read the lesson behind the idea and how to backtest it honestly. Specs like this one are the survivors of an unknown number of trials; deflate their results accordingly.
Related specs
- ADX MA and EMA Long Only Trend Tracking StrategyPine Script · Trend following · 1d
- ATR and Moving Average Crossover Hybrid StrategyPine Script · Trend following · 1h
- Bollinger Band Moving Average Crossover StrategyPine Script · Trend following · 1h
- Bollinger Bands and EMA Trend Following StrategyPine Script · Trend following · 1h
- Bollinger Bands and RSI Trend Following StrategyPine Script · Trend following · 1h
- Candlestick Pattern Trend Filter StrategyPine Script · Trend following · 1d