Strategy vault / Mean reversion
Fibonacci Trend Reversal Strategy
The "Fibonacci Trend Reversal Strategy" is a trading strategy that utilizes Fibonacci retracement levels and the Trend Strength Over Time (TSOT) indicator to capture potential trend reversal points in the market. The…
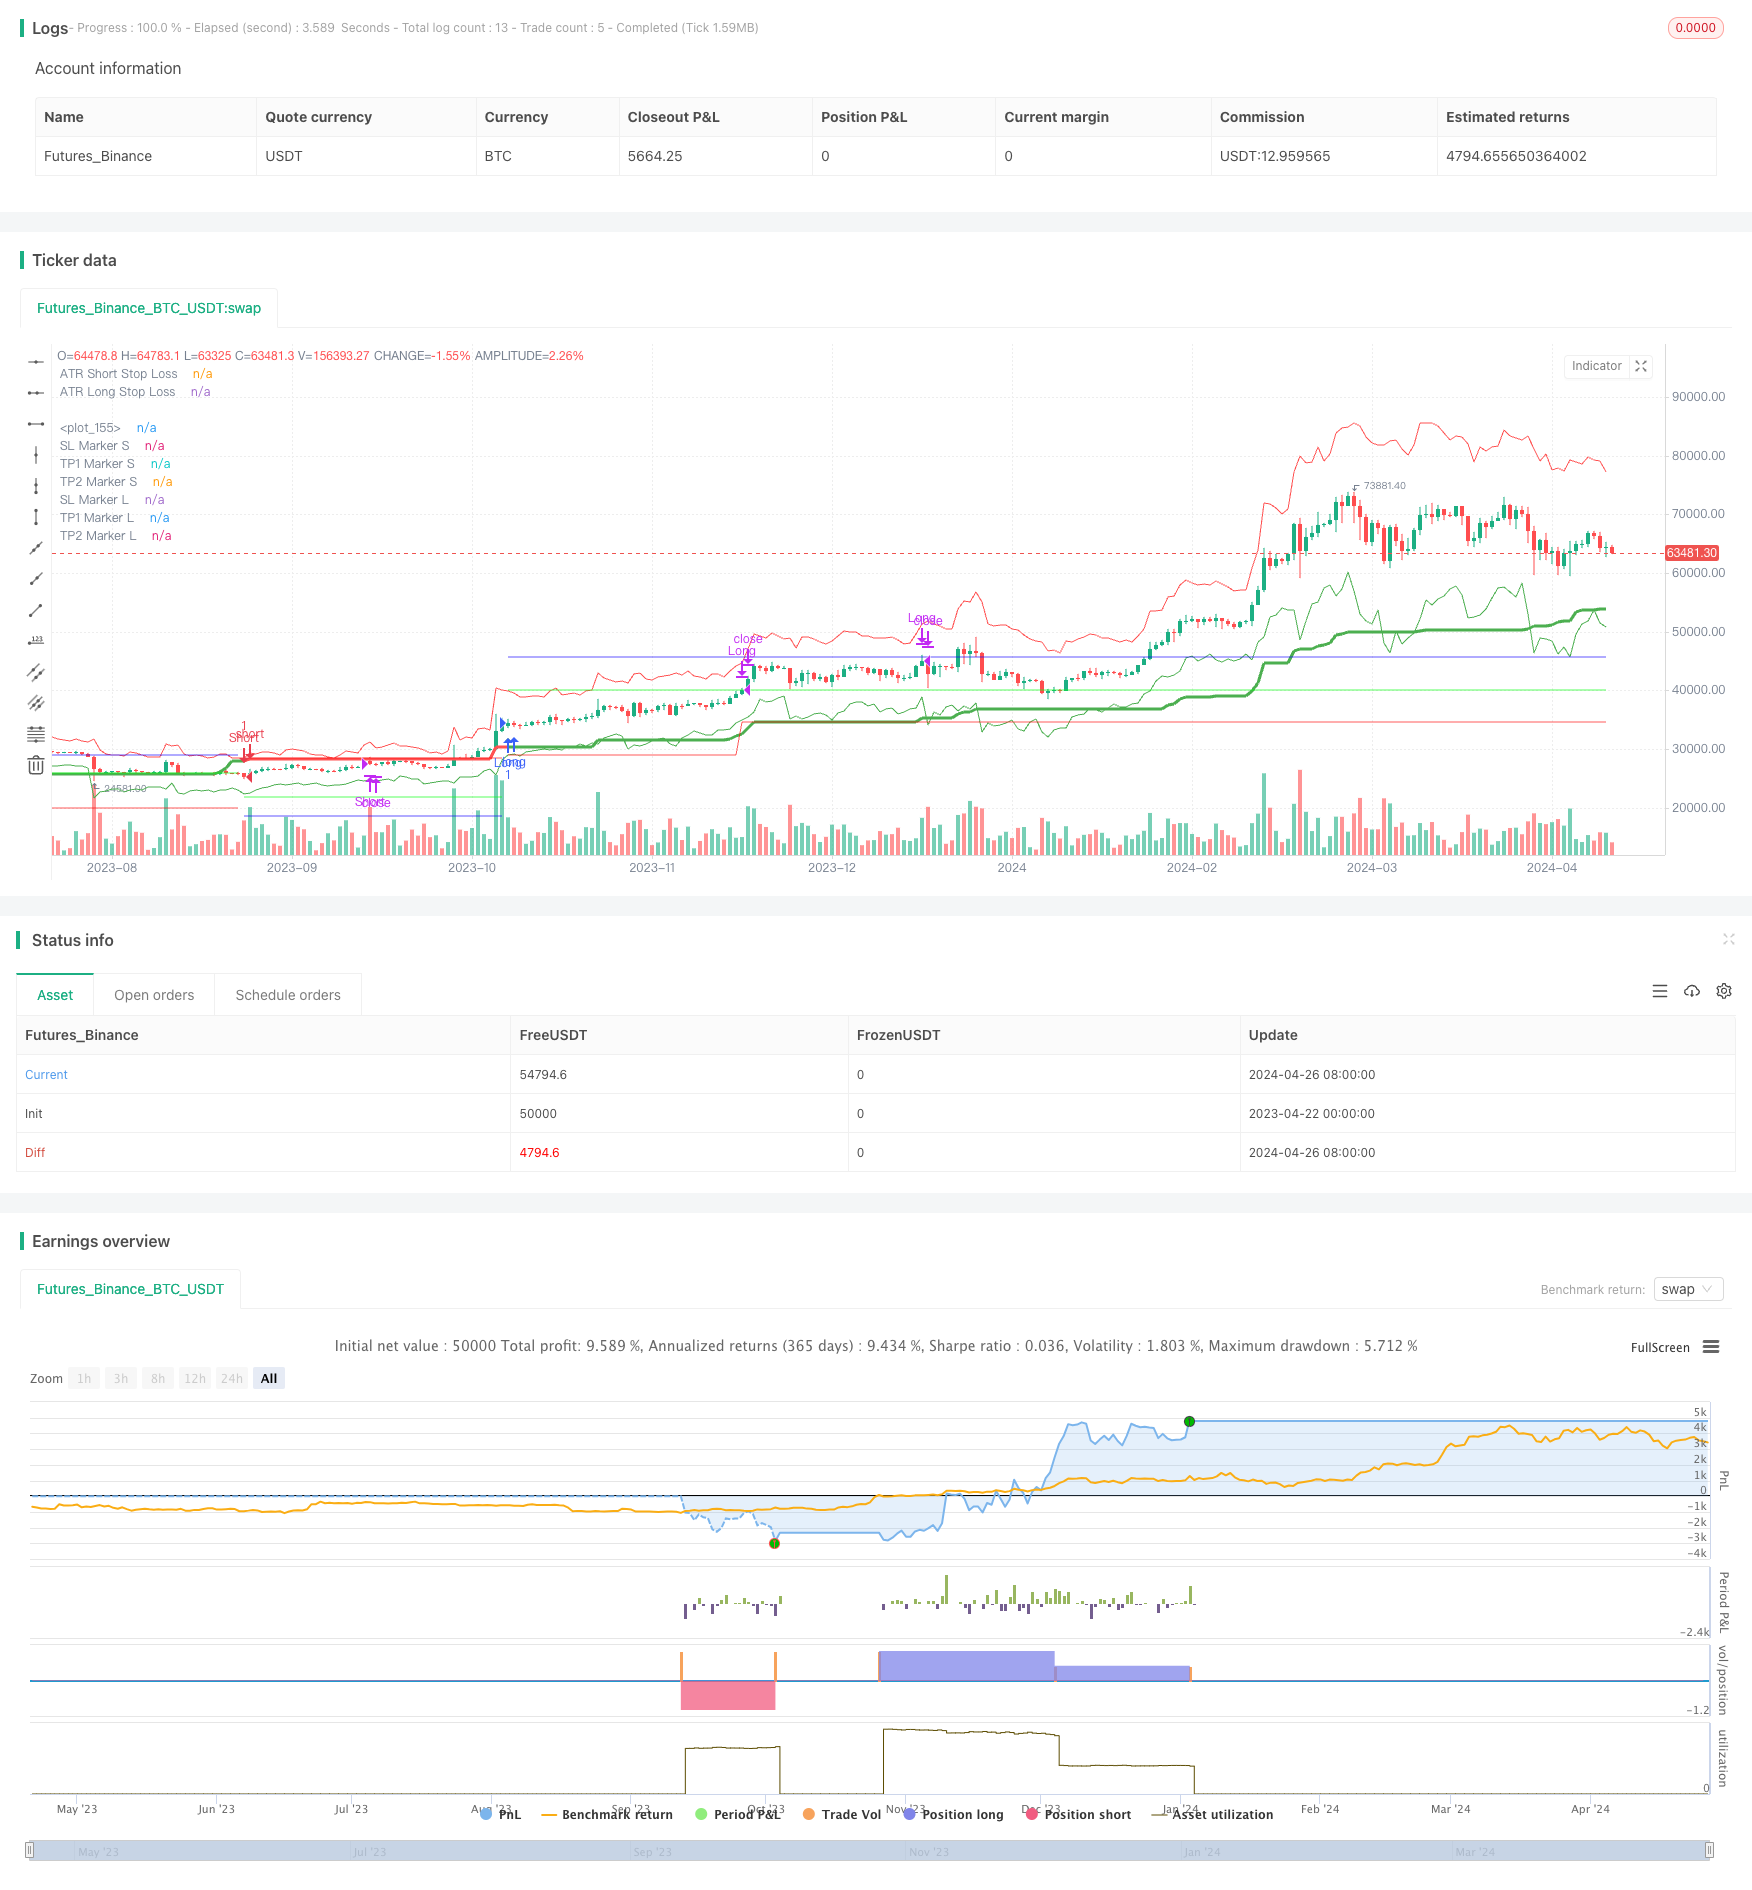
Overview
The "Fibonacci Trend Reversal Strategy" is a trading strategy that utilizes Fibonacci retracement levels and the Trend Strength Over Time (TSOT) indicator to capture potential trend reversal points in the market. The strategy implements dynamic ATR stop-loss and partial take-profit to manage risk and maximize profits. It is optimized for scalping (5-minute timeframe) in the expandable market.
Strategy Principles
The strategy employs Fibonacci retracement levels (0.236, 0.5, and 0.786) to identify potential trend reversal points. Additionally, the TSOT indicator measures trend strength using percentile rankings of price action. When the price surpasses the mid Fibonacci level (0.5) with a bullish/bearish TSOT signal, the strategy enters a long/short position. Stop-loss levels are dynamically calculated using ATR, while take-profit levels are set based on partial profit-taking and risk-reward ratio. Moreover, the strategy allows for position reversal based on new TSOT signals.
Strategy Advantages
- By combining Fibonacci retracements with the trend strength indicator, the strategy can more accurately identify trend reversal points.
- Dynamic ATR stop-loss adjusts according to current market volatility, ensuring effective risk management.
- Partial take-profit settings enable timely profit-taking when targets are reached while allowing profits to run further.
- The ability to reverse positions based on new signals enhances the adaptability and flexibility of the strategy.
Strategy Risks
- In choppy markets or unclear trend conditions, frequent reversal signals may lead to overtrading and losses.
- Although dynamic stop-loss and partial take-profit help control risk, significant drawdowns may still occur in extreme market conditions.
- The selection of strategy parameters (e.g., Fibonacci levels, TSOT calculation) requires optimization for different markets and timeframes; improper parameters may impact strategy performance.
Strategy Optimization Directions
- Incorporate additional confirmation signals (e.g., volume, momentum indicators) to filter out false signals and improve entry accuracy.
- Optimize the take-profit and stop-loss logic, such as dynamically adjusting take-profit targets based on trend strength or implementing trailing stop-losses.
- For frequent reversal scenarios, consider setting a limit on the number of reversals or introducing reversal filtering conditions to reduce overtrading.
- Conduct thorough optimization and testing of strategy parameters tailored to specific market characteristics and trading instruments.
Summary
The "Fibonacci Trend Reversal Strategy" effectively captures trend reversal points by combining Fibonacci retracement levels with the TSOT indicator, while managing risk and profit targets through dynamic stop-loss and partial take-profit. The strategy performs well in markets with clear trends but requires caution in choppy conditions. Future improvements can focus on signal confirmation, optimization of take-profit and stop-loss, and reversal management to enhance the strategy's robustness and profitability.
Parameters
| Name | Default | What it controls |
|---|---|---|
| v_input_float_1 | 18 | (?Fib Sensitivity)Sensitive |
| v_input_int_1 | 14 | (?ATR SL Finder)Length |
| v_input_string_1 | 0 | Smoothing: RMA | SMA | EMA | WMA |
| v_input_1 | 3.5 | Multiplier |
| v_input_string_2 | Both | (?Strategy Execution)Trade Direction |
| v_input_float_2 | 2 | Risk Reward Ratio |
| v_input_bool_1 | true | Use Partial Take Profit |
| v_input_bool_2 | true | Allow Reversing of Position |
| v_input_bool_3 | true | Show Entry Visuals |
Source Pine Script
/*backtest
start: 2023-04-22 00:00:00
end: 2024-04-27 00:00:00
period: 1d
basePeriod: 1h
exchanges: [{"eid":"Futures_Binance","currency":"BTC_USDT"}]
*/

// This Pine Script™ code is subject to the terms of the Mozilla Public License 2.0 at https://mozilla.org/MPL/2.0/
// © nioboi

//@version=5
strategy("Fibonacci Trend Reversals", overlay=true, process_orders_on_close = true, commission_value = 0.055, initial_capital = 1000)

// =========================================
// Input Groups
// =========================================
string rsi_group = "RSI"
string main_group = "Fib Sensitivity"
string atr_sl_finder_group = "ATR SL Finder"
string trade_execution_group = "Strategy Execution"

// =========================================
// Fibonacci Retracement Trend Reversal
// =========================================
sensitivity_input = input.float(title = 'Sensitive', step = 0.1, defval = 18, group = main_group)
var bool is_long_trend_started = false
var bool is_short_trend_started = false
var bool is_trend_change = na
var bool is_long_trend = false
var bool is_short_trend = false
var bool can_long = false
var bool can_short = false

sensitivity = sensitivity_input
sensitivity *= 10

high_line = ta.highest(high, int(sensitivity))
low_line = ta.lowest(low, int(sensitivity))
channel_range = high_line - low_line
fib_236 = high_line - channel_range * (0.236)
fib_5 = high_line - channel_range * 0.5
fib_786 = high_line - channel_range * (0.786)
imba_trend_line = fib_5

// =========================================
// TSOT | Trend Strength Over Time
// =========================================

// Calculate 75th percentile of price for each length
percentile_13H = ta.percentile_nearest_rank(high, 13, 75)
percentile_21H = ta.percentile_nearest_rank(high, 21, 75)
percentile_34H = ta.percentile_nearest_rank(high, 34, 75)
percentile_55H = ta.percentile_nearest_rank(high, 55, 75)
percentile_89H = ta.percentile_nearest_rank(high, 89, 75)

// Calculate 25th percentile of  price for each length
percentile_13L =  ta.percentile_nearest_rank(low, 13, 25)
percentile_21L =  ta.percentile_nearest_rank(low, 21, 25)
percentile_34L =  ta.percentile_nearest_rank(low, 34, 25)
percentile_55L = ta.percentile_nearest_rank(low, 55, 25)
percentile_89L = ta.percentile_nearest_rank(low, 89, 25)

// Calculate 75th and 25th for length 144 (longest length)
highest_high = ta.percentile_nearest_rank(high, 144, 75)
lowest_low = ta.percentile_nearest_rank(low, 144, 25)

// Calculate trend strength conditions
trendBull1 = percentile_13H > highest_high
trendBull2 = percentile_21H > highest_high
trendBull3 = percentile_34H > highest_high
trendBull4 = percentile_55H > highest_high
trendBull5 = percentile_89H > highest_high
trendBull6 = percentile_13L > highest_high
trendBull7 = percentile_21L > highest_high
trendBull8 = percentile_34L > highest_high
trendBull9 = percentile_55L > highest_high
trendBull10 = percentile_89L > highest_high

trendBear1 = percentile_13H < lowest_low
trendBear2 = percentile_21H < lowest_low
trendBear3 = percentile_34H < lowest_low
trendBear4 = percentile_55H < lowest_low
trendBear5 = percentile_89H < lowest_low
trendBear6 = percentile_13L < lowest_low
trendBear7 = percentile_21L < lowest_low
trendBear8 = percentile_34L < lowest_low
trendBear9 = percentile_55L < lowest_low
trendBear10 = percentile_89L < lowest_low

countBull =
     (trendBull1 ? 1 : 0) +
     (trendBull2 ? 1 : 0) +
     (trendBull3 ? 1 : 0) +
     (trendBull4 ? 1 : 0) +
     (trendBull5 ? 1 : 0) +
     (trendBull6 ? 1 : 0) +
     (trendBull7 ? 1 : 0) +
     (trendBull8 ? 1 : 0) +
     (trendBull9 ? 1 : 0) +
     (trendBull10 ? 1 : 0)

countBear =
     (trendBear1 ? 1 : 0) +
     (trendBear2 ? 1 : 0) +
     (trendBear3 ? 1 : 0) +
     (trendBear4 ? 1 : 0) +
     (trendBear5 ? 1 : 0) +
     (trendBear6 ? 1 : 0) +
     (trendBear7 ? 1 : 0) +
     (trendBear8 ? 1 : 0) +
     (trendBear9 ? 1 : 0) +
     (trendBear10 ? 1 : 0)

// Calculate weak bull count
weakBullCount =
     (percentile_13L < highest_high and percentile_13L > lowest_low ? 1 : 0) +
     (percentile_21L < highest_high and percentile_21L > lowest_low ? 1 : 0) +
     (percentile_34L < highest_high and percentile_34L > lowest_low ? 1 : 0) +
     (percentile_55L < highest_high and percentile_55L > lowest_low ? 1 : 0) +
     (percentile_89L < highest_high and percentile_89L > lowest_low ? 1 : 0)

// Calculate weak bear count
weakBearCount =
     (percentile_13H > lowest_low and percentile_13H < highest_high ? 1 : 0) +
     (percentile_21H > lowest_low and percentile_21H < highest_high ? 1 : 0) +
     (percentile_34H > lowest_low and percentile_34H < highest_high ? 1 : 0) +
     (percentile_55H > lowest_low and percentile_55H < highest_high ? 1 : 0) +
     (percentile_89H > lowest_low and percentile_89H < highest_high ? 1 : 0)

// Calculate bull strength and bear strength
bullStrength = 10 * (countBull + 0.5*weakBullCount - 0.5*weakBearCount - countBear)
bearStrength = 10 * (countBear + 0.5*weakBearCount - 0.5*weakBullCount - countBull)

// Calculate the current trend
currentTrendValue = bullStrength - bearStrength

tsot_bullish = currentTrendValue > 0
tsot_bearish = currentTrendValue < 0

// CAN LONG/SHORT
can_long := close >= imba_trend_line and close >= fib_236 and not is_long_trend and tsot_bullish
can_short := close <= imba_trend_line and close <= fib_786 and not is_short_trend and tsot_bearish

if can_long
    is_long_trend := true
    is_short_trend := false
    is_long_trend_started := is_long_trend_started ? false : true
else if can_short
    is_short_trend := true
    is_long_trend := false
    is_short_trend_started := is_short_trend_started ? false : true
else
    is_trend_change := false
    can_long := false
    can_short := false
    is_short_trend_started := false
    is_long_trend_started := false

is_trend_change := is_short_trend_started or is_long_trend_started
plotshape(is_long_trend and is_long_trend_started ? imba_trend_line : na, title="Long", style=shape.triangleup, location=location.belowbar, color=color.green, size=size.small)
plotshape(is_short_trend and is_short_trend_started ? imba_trend_line : na, title="Short", style=shape.triangledown, location=location.abovebar, color=color.red, size=size.small)
plot(imba_trend_line, color = is_long_trend[1] ? color.green : color.red, linewidth = 3)

// =========================================
// ATR SL Finder
// =========================================
atrlength = input.int(title='Length', defval=14, minval=1, group = atr_sl_finder_group)
smoothing = input.string(title='Smoothing', defval='RMA', options=['RMA', 'SMA', 'EMA', 'WMA'], group = atr_sl_finder_group)
m = input(3.5, 'Multiplier', group = atr_sl_finder_group)
src1 = high
src2 = low
ma_function(source, length) =>
    if smoothing == 'RMA'
        ta.rma(source, length)
    else
        if smoothing == 'SMA'
            ta.sma(source, length)
        else
            if smoothing == 'EMA'
                ta.ema(source, length)
            else
                ta.wma(source, length)

x = ma_function(ta.tr(true), atrlength) * m + src1 // SHORT SL
x2 = src2 - ma_function(ta.tr(true), atrlength) * m // LONG SL

p1 = plot(x, title="ATR Short Stop Loss", color=color.red)
p2 = plot(x2, title="ATR Long Stop Loss", color=color.green)

// =========================================
// Strategy Execution
// =========================================

tradeDirection = input.string("Both", "Trade Direction", ["Long Only", "Short Only", "Both"], group = trade_execution_group, tooltip = "Select if you want this strategy to run only Long or Only Short positions, or Both")

risk_reward_ratio = input.float(2, "Risk Reward Ratio", group = trade_execution_group)
partialTp = input.bool(true, "Use Partial Take Profit", tooltip = "Enable this if you want to exit 50% of your position when half point of your Risk Reward is reached.", group = trade_execution_group)
allowReversePosition = input.bool(true, "Allow Reversing of Position", tooltip = "Enable this if you want to reverse position when new opposite signal occurs", group = trade_execution_group)

// Long or Short Conditions
enterLong = can_long and (tradeDirection == "Long Only" or tradeDirection == "Both")
enterShort = can_short and (tradeDirection == "Short Only" or tradeDirection == "Both")

// Long Entry Variables
var bool plotMarkers_long = false
var bool firstTPHit_long = false
var float sl_long = na
var float breakEven_long = na
var float tp1_long = na
var float tp2_long = na
var float entryPrice_long = na
var bool inLongPosition = false

// Short Entry Variables
var bool plotMarkers_short = false
var bool firstTPHit_short = false
var float sl_short = na
var float breakEven_short = na
var float tp1_short = na
var float tp2_short = na
var float entryPrice_short = na
var bool inShortPosition = false


// Reversal Logic
if inLongPosition and can_short and allowReversePosition // in a long position and signal to enter short and havent yet hit first tp
    strategy.close("Long", "Reversing Long to Short") // close Long in preparation to enter short in the next few lines
    inLongPosition := false
else if inShortPosition and can_long and allowReversePosition // in a short position and signal to enter long and havent yet hit first tp
    strategy.close("Short", "Reversing Short to Long") // close Short in preparation to enter long in the next few lines
    inShortPosition := false

// Long Entries
if enterLong
    entryPrice_long := close
    sl_long := x2
    risk = entryPrice_long - sl_long
    tp1_long := entryPrice_long + ((risk_reward_ratio * risk) / 2)
    tp2_long := entryPrice_long + (risk_reward_ratio * risk)
    breakEven_long := entryPrice_long + (entryPrice_long * 0.002)
    strategy.entry("Long", strategy.long)
    if not partialTp
        strategy.exit("Exit Long", "Long", limit = tp2_long, stop = sl_long)
    firstTPHit_long := false
    inLongPosition := true

// Short Entries
if enterShort
    entryPrice_short := close
    sl_short := x
    risk = sl_short - entryPrice_short
    tp1_short := entryPrice_short - ((risk_reward_ratio * risk)/2)
    tp2_short := entryPrice_short - (risk_reward_ratio * risk)
    breakEven_short := entryPrice_short - (entryPrice_short * 0.002)
    strategy.entry("Short", strategy.short)
    if not partialTp
        strategy.exit("Exit Short", "Short", limit = tp2_short, stop = sl_short)
    firstTPHit_short := false
    inShortPosition := true

// Dynamic TP and exit strategy for Longs
if inLongPosition and partialTp // in long position and partial TP for exit strategy is enabled
    if high >= tp1_long and not firstTPHit_long // high of candle hit first TP of long, and not yet hit first TP before
        strategy.close("Long", "TP-1 Long", qty_percent = 50) // close 50% of our long position
        sl_long := breakEven_long
        firstTPHit_long := true // set the first TP checker flag to true
    else if high >= tp2_long and firstTPHit_long // already hit the first TP and we hit our 2nd tp
        strategy.close("Long", "TP-2 long") // close the remaining of the long position
        inLongPosition := false // not in long position anymore
    else if low <= sl_long and not firstTPHit_long // not yet hit first TP but hit our SL
        strategy.close("Long", "SL long") // close the entire long position
        inLongPosition := false // not in long position anymore
    else if low <= breakEven_long and firstTPHit_long // already hit first TP and retraced back to breakEven
        strategy.close("Long", "BE Long")
        inLongPosition := false // not in long position anymore

// Dynamic TP and exit strategy for Shorts
if inShortPosition and partialTp // in short position and partial TP for exit strategy is enabled
    if low <= tp1_short and not firstTPHit_short // low of candle hit first TP of short, and not yet hit first TP before
        strategy.close("Short", "TP-1 Short", qty_percent = 50) // close 50% of our short position
        firstTPHit_short := true // set the first TP checker flag to true
        sl_short := breakEven_short
    else if low <= tp2_short and firstTPHit_short // already hit the first TP and we hit our 2nd tp
        strategy.close("Short", "TP-2 Short") // close the remaining of the short position
        inShortPosition := false // not in short position anymore
    else if high >= sl_short and not firstTPHit_short // not yet hit first TP but hit our SL
        strategy.close("Short", "SL Short") // close the entire long position
        inShortPosition := false // not in long position anymore
    else if high >= breakEven_short and firstTPHit_short // already hit first TP and retraced back to breakEven
        strategy.close("Short", "BE Short")
        inShortPosition := false // not in long position anymore

// =========================================
// Entry Visuals
// =========================================

// Entry Visual Flags
if inLongPosition
    plotMarkers_long := true
    plotMarkers_short := false
else if inShortPosition
    plotMarkers_long := false
    plotMarkers_short := true

showEntryVisuals = input.bool(true, "Show Entry Visuals", group = trade_execution_group)
plot(plotMarkers_long and showEntryVisuals?sl_long:na, "SL Marker L", color = #ff0000a4, linewidth = 1, style = plot.style_linebr)
plot(plotMarkers_long and showEntryVisuals?tp1_long:na, "TP1 Marker L", color = #00ff08a8, linewidth = 1, style = plot.style_linebr)
plot(plotMarkers_long and showEntryVisuals?tp2_long:na, "TP2 Marker L", color = #1100ffa9, linewidth = 1, style = plot.style_linebr)
plot(plotMarkers_short and showEntryVisuals?sl_short:na, "SL Marker S", color = #ff0000a4, linewidth = 1, style = plot.style_linebr)
plot(plotMarkers_short and showEntryVisuals?tp1_short:na, "TP1 Marker S", color = #00ff08a8, linewidth = 1, style = plot.style_linebr)
plot(plotMarkers_short and showEntryVisuals?tp2_short:na, "TP2 Marker S", color = #1100ffa9, linewidth = 1, style = plot.style_linebr)Published by ChaoZhang on the FMZ strategy square · last modified 2024-04-28. Collected in the Quant Trading Vault. Unvalidated research: re-test with your own data and costs before trusting it.
Build this with AgenKit
A spec is not a trading system. Paste this into your coding agent and AgenKit runs a specialist team — architecture, test-first build, risk gates, review — with paper trading on by default.
/agenkit build a production-grade trading bot with a backtest engine, risk controls and paper trading by default from strategies/Fibonacci-Trend-Reversal-Strategy.md- npx agenkit install engineering-kit in your project
- Paste the command into your agent and approve each phase
- Get tests, backtest, risk controls and a paper-trading switch
Understand it first
Before you run this, read the lesson behind the idea and how to backtest it honestly. Specs like this one are the survivors of an unknown number of trials; deflate their results accordingly.
Related specs
- Advanced Momentum EMA Trend Following with RSI Overbought Oversold Trading StrategyPine Script · Mean reversion · 1d
- Customizable Non Repainting HTF MACD MFI Scalable Bot StrategyPine Script · Mean reversion · 1d
- Dynamic Adaptive Multi Timeframe Trend Following and Range Reversal Hybrid StrategyPine Script · Mean reversion · 2d
- MACD Cross Period Trading StrategyPine Script · Mean reversion · 1d
- Oma and Apollo Dual Rail Trading StrategyPine Script · Mean reversion · 5m
- Reversal Trading Strategy with Bollinger Bands RSI ADX and ATRPine Script · Mean reversion · 1h