Five Minute Opening Breakout Strategy with Dynamic ATR Based Stop Loss and Take Profit
This strategy is a quantitative trading system based on five-minute opening breakout combined with dynamic ATR-based stop-loss management. It identifies key price levels from the first five-minute candle after market…
Overview
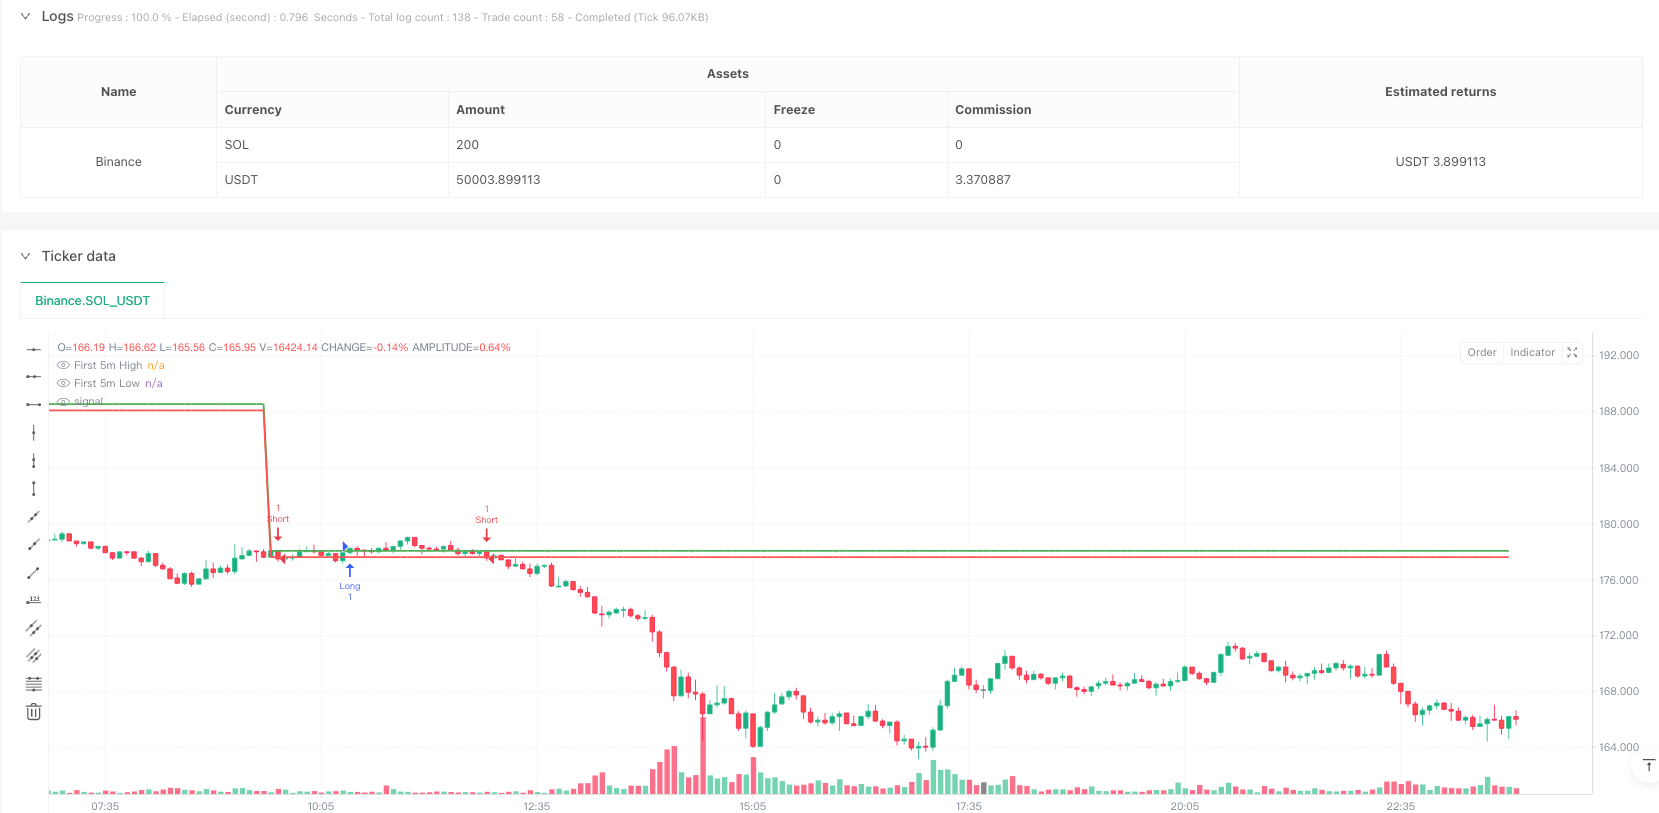
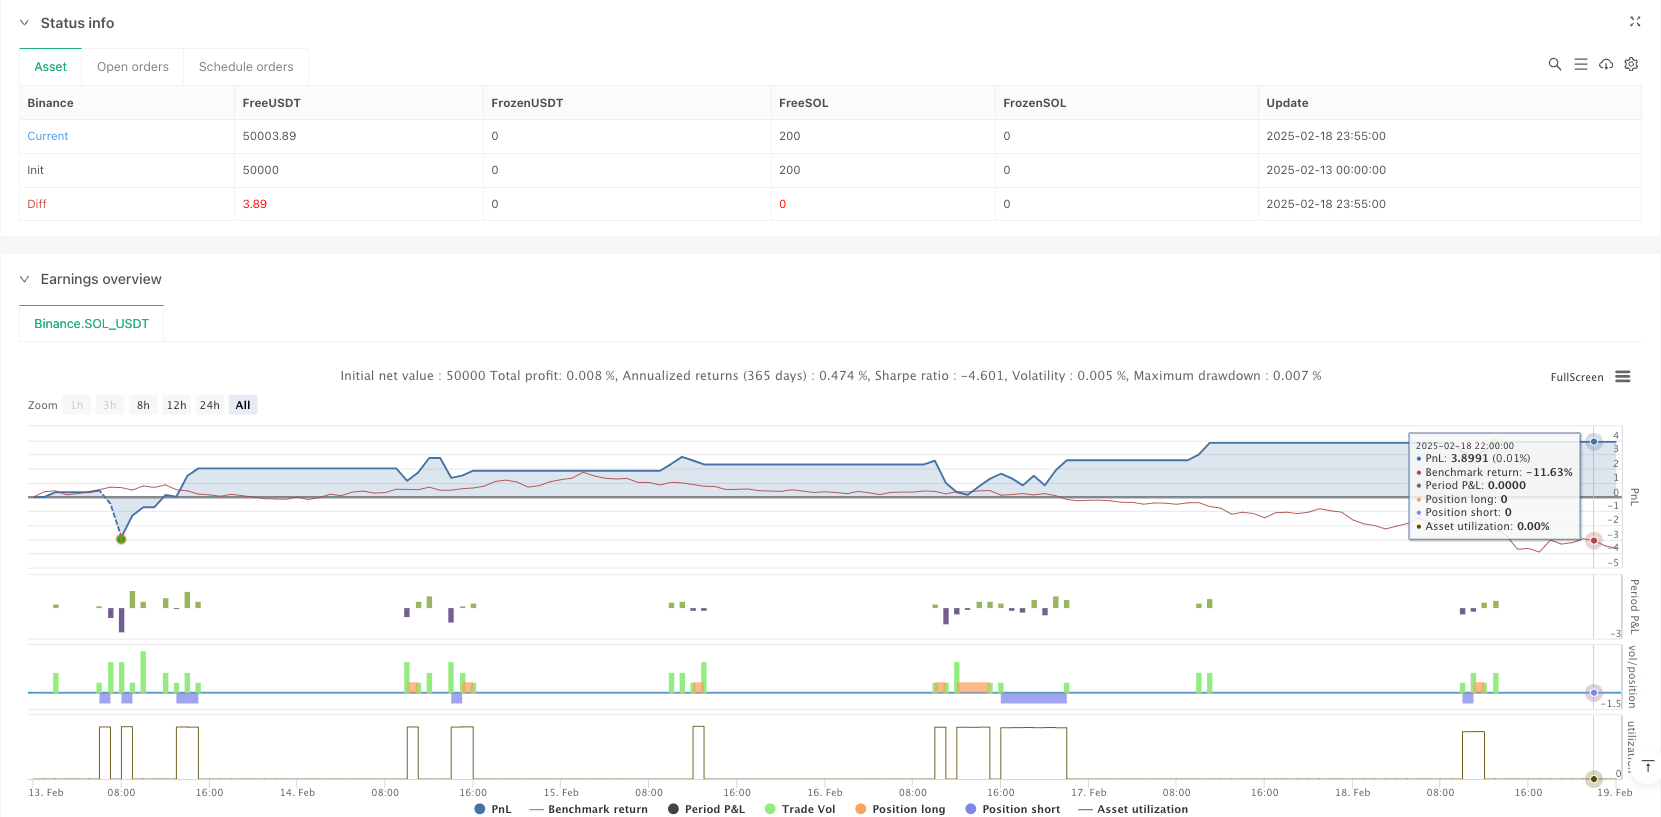
This strategy is a quantitative trading system based on five-minute opening breakout combined with dynamic ATR-based stop-loss management. It identifies key price levels from the first five-minute candle after market open, generates trading signals upon breakouts, and implements dynamic risk control using ATR-based stops.
Strategy Principles
The core logic includes the following key steps:
- Determine trading session start time (e.g., NYSE 9:30 AM)
- Capture the first five-minute candle, recording its open, high, and low prices
- Generate long signals on high breakout and short signals on low breakout
- Calculate volatility using 14-period ATR for dynamic stop-loss placement
- Implement 1:1.5 risk-reward ratio with stop-loss at 1x ATR and take-profit at 1.5x the breakout range
Strategy Advantages
- Precise Timeframe: Focuses on the most active five-minute period after market open
- Robust Risk Management: Dynamically adjusts stop-loss levels using ATR
- Standardized Execution: Uses clear breakout signals and fixed risk-reward ratio
- High Adaptability: ATR indicator automatically adjusts to market volatility
- Simple Implementation: Clear strategy logic facilitates testing and execution
Strategy Risks
- False Breakout Risk: Opening volatility may generate false signals
- Slippage Impact: High volatility periods may face significant slippage
- ATR Parameter Sensitivity: 14-period setting may not suit all market conditions
- Fixed Multiplier Limitation: 1:1.5 risk-reward ratio may need adjustment
- Transaction Cost Consideration: Frequent trading may incur high costs
Optimization Directions
- Signal Filtering: Incorporate volume confirmation or momentum indicators
- Parameter Adaptation: Develop dynamic ATR period adjustment mechanism
- Time Filtering: Add specific timeframe restrictions
- Stop-Loss Enhancement: Research market microstructure-based stop methods
- Instrument-Specific Optimization: Adjust risk-reward ratios per instrument
Summary
This is a well-structured quantitative trading strategy that achieves controlled risk automated trading through opening price breakout monitoring and ATR dynamic stops. Its core strength lies in its simple yet effective design, though it requires continuous optimization for different market environments and instruments. Traders should conduct thorough backtesting and adjust parameters according to actual conditions before live implementation.
Source Pine Script
/*backtest
start: 2025-02-13 00:00:00
end: 2025-02-19 00:00:00
period: 5m
basePeriod: 5m
exchanges: [{"eid":"Binance","currency":"SOL_USDT"}]
*/

//@version=5
strategy("5-Min Open Candle Breakout", overlay=true)

// Get the current bar's year, month, and day
currentYear = year
currentMonth = month
currentDay = dayofmonth

// Define session start time (adjust based on market)
sessionStart = timestamp(currentYear, currentMonth, currentDay, 9, 30) // 9:30 AM for NYSE

// Identify the first 5-minute candle
isFirstCandle = (time >= sessionStart and time < sessionStart + 300000)  // 5 min = 300,000 ms

var float openPrice = na
var float highPrice = na
var float lowPrice = na

if isFirstCandle
    openPrice := open
    highPrice := high
    lowPrice := low

// Breakout Conditions
longEntry = ta.crossover(close, highPrice)
shortEntry = ta.crossunder(close, lowPrice)

// Define Stop Loss & Take Profit (Ratio 1:1.5)
slFactor = 1.0  // Stop Loss Multiplier
tpFactor = 1.5  // Take Profit Multiplier

atrValue = ta.atr(14)  // Fix: Use ta.atr() instead of atr()

longSL = lowPrice - atrValue * slFactor
longTP = highPrice + (highPrice - lowPrice) * tpFactor

shortSL = highPrice + atrValue * slFactor
shortTP = lowPrice - (highPrice - lowPrice) * tpFactor

// Execute Trades
strategy.entry("Long", strategy.long, when=longEntry)
strategy.exit("Exit Long", from_entry="Long", stop=longSL, limit=longTP)

strategy.entry("Short", strategy.short, when=shortEntry)
strategy.exit("Exit Short", from_entry="Short", stop=shortSL, limit=shortTP)

// Plot High/Low of First Candle
plot(highPrice, title="First 5m High", color=color.green, linewidth=2)
plot(lowPrice, title="First 5m Low", color=color.red, linewidth=2)
Published by ianzeng123 on the FMZ strategy square · last modified 2025-02-27. Collected in the Quant Trading Vault. Unvalidated research: re-test with your own data and costs before trusting it.
Build this with AgenKit
A spec is not a trading system. Paste this into your coding agent and AgenKit runs a specialist team — architecture, test-first build, risk gates, review — with paper trading on by default.
/agenkit build a production-grade trading bot with a backtest engine, risk controls and paper trading by default from strategies/Five-Minute-Opening-Breakout-Strategy-with-Dynamic-ATR-Based-Stop-Loss-and-Take-Profit.md- npx agenkit install engineering-kit in your project
- Paste the command into your agent and approve each phase
- Get tests, backtest, risk controls and a paper-trading switch
Understand it first
Before you run this, read the lesson behind the idea and how to backtest it honestly. Specs like this one are the survivors of an unknown number of trials; deflate their results accordingly.
Related specs
- Advanced Multi Pattern Breakout Trading StrategyPine Script · Breakout · 1d
- Flexible Long Short Trading Strategy Based on Keltner ChannelsPine Script · Breakout · 1d
- Momentum Breakout Trading Strategy 435896Pine Script · Breakout · 1d
- Multi Filter Trend Breakthrough Smart Moving Average Trading StrategyPine Script · Breakout · 1h
- Multi Indicator Trend Breakout Strategy with Dynamic Stop LossPine Script · Breakout · 1d
- Multi Technical Indicator Dynamic Wave Trading StrategyPine Script · Breakout · 1h