Four factor Momentum Tracking Trading Strategy Based on ADX BB B AO and EMA
This strategy is named "Four-factor Momentum Tracking Strategy". It integrates Average Directional Movement Index (ADX) to determine trend direction, Bollinger Bands Percentage B (BB %B) to judge the relative…
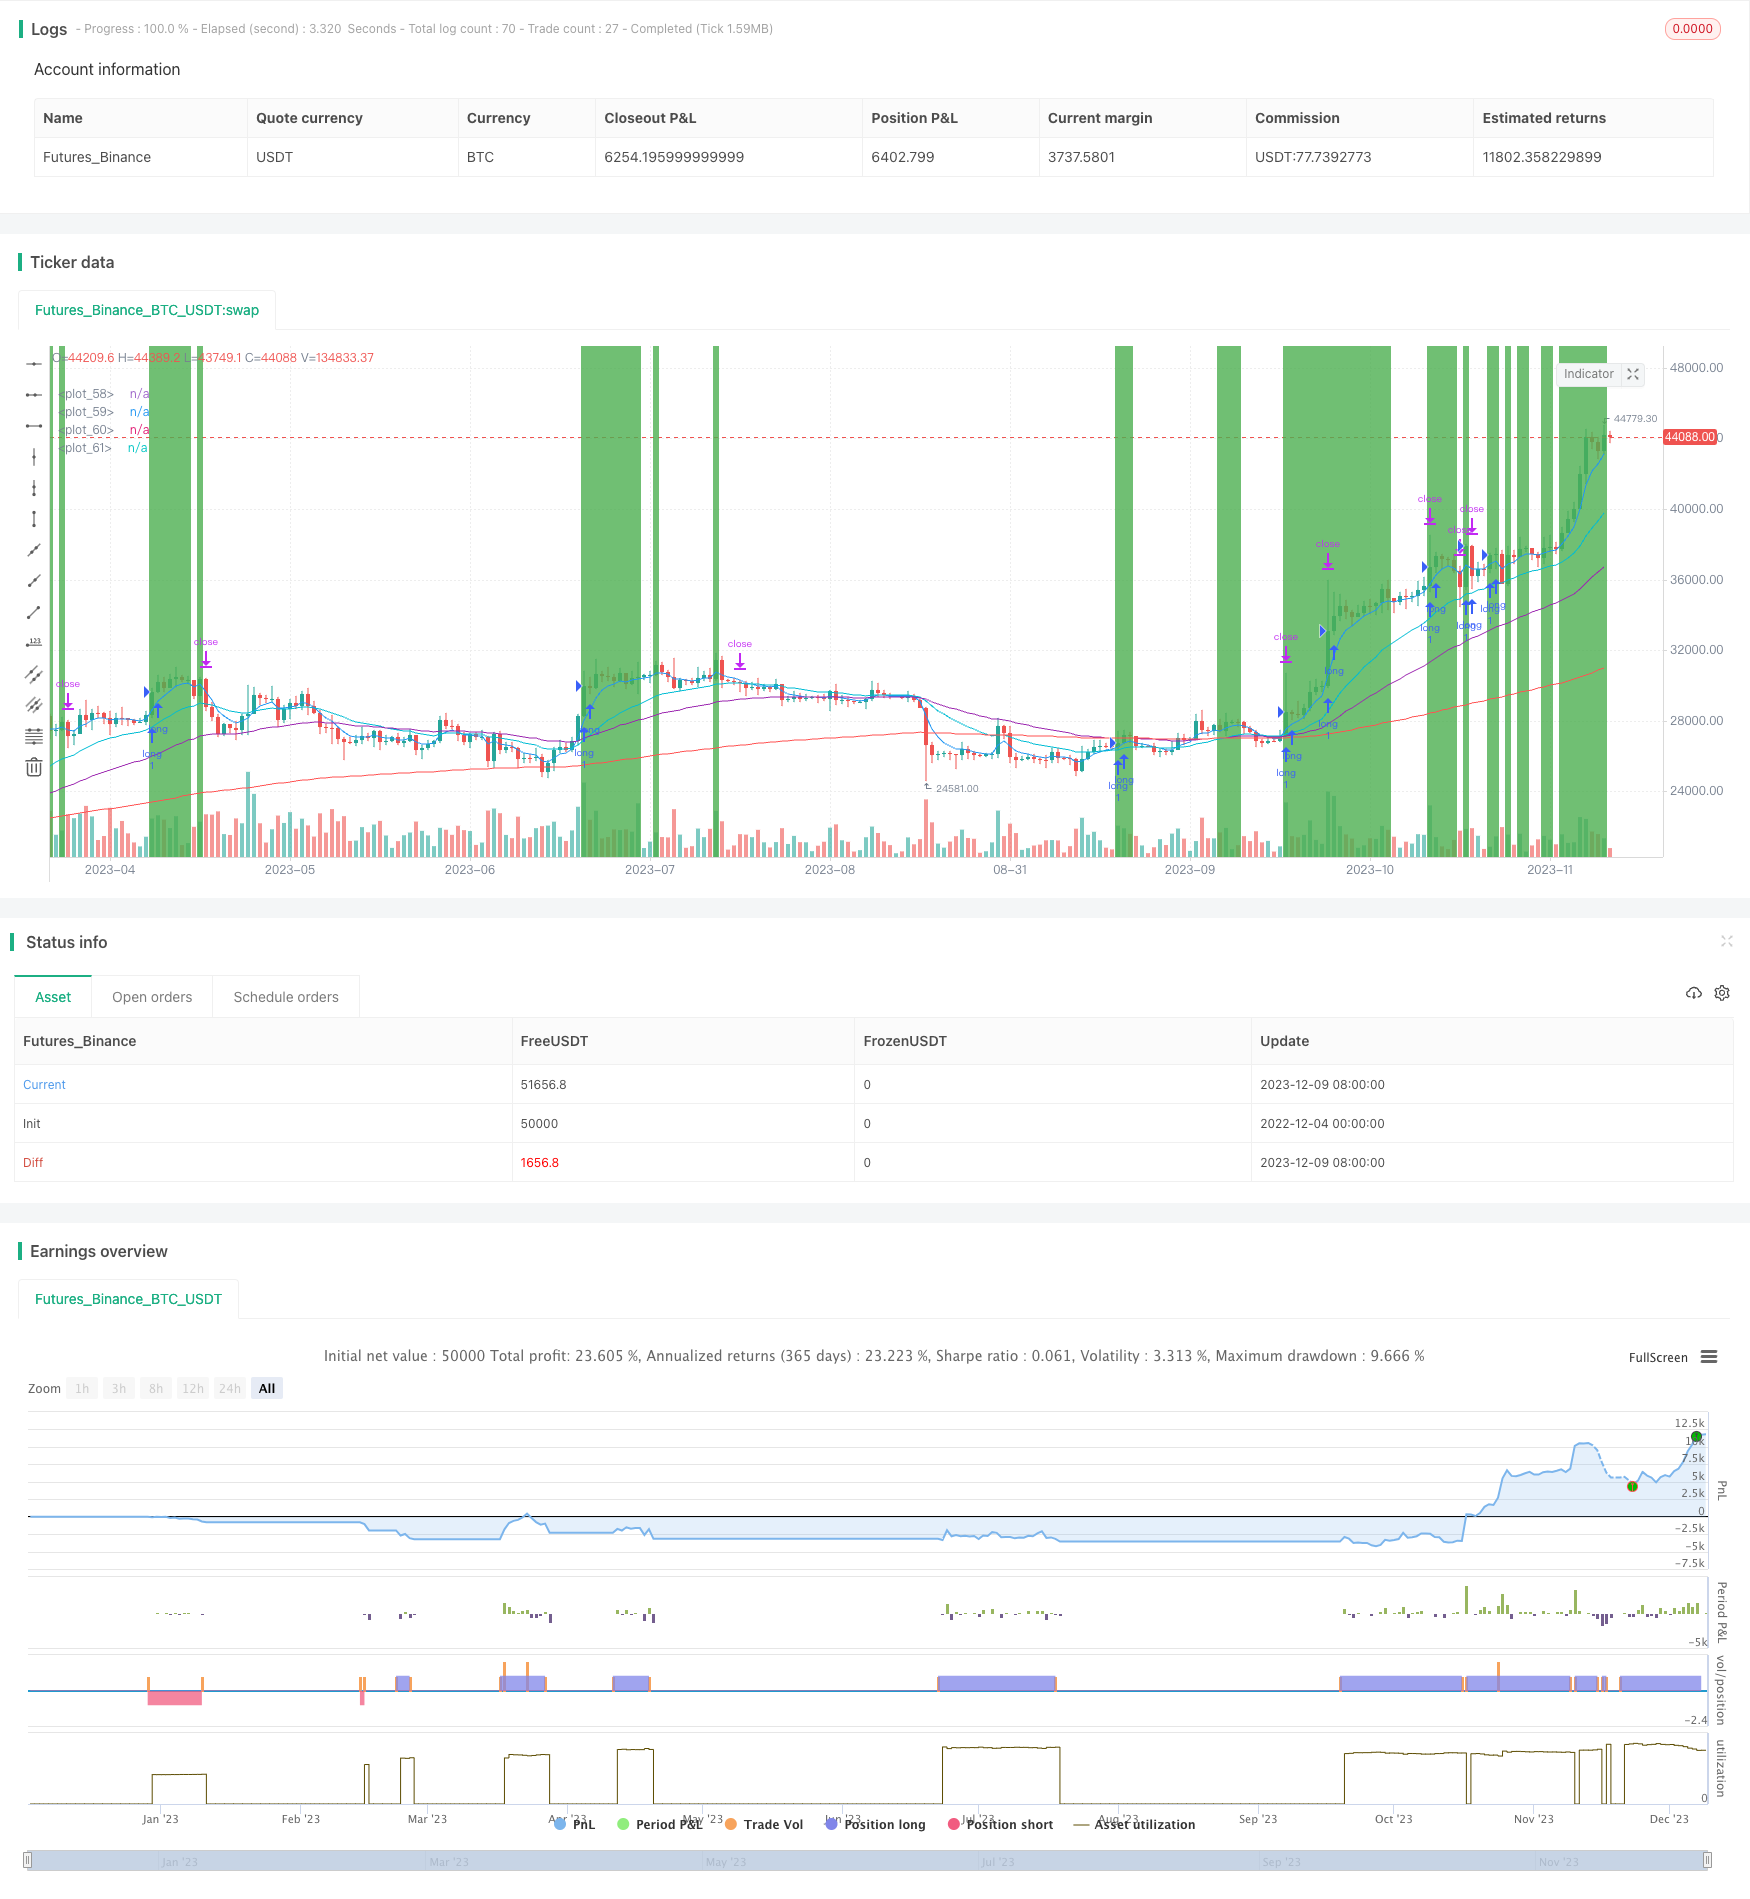
##Overview This strategy is named "Four-factor Momentum Tracking Strategy". It integrates Average Directional Movement Index (ADX) to determine trend direction, Bollinger Bands Percentage B (BB %B) to judge the relative strength of stocks, Awesome Oscillator (AO) to determine momentum and different cycle Exponential Moving Averages (EMA) to judge long and short positions, achieving dynamic tracking of stock prices and chasing strong stocks and avoiding weak ones.
##Strategy Principle
The strategy uses four different technical indicators to determine entry and exit points. The specific logic is as follows:
Long entry condition: 5-day EMA crosses above 21-day EMA, 50-day EMA crosses above 200-day EMA, BB %B is greater than the set overbought line, AO is greater than the set positive value, and ADX is greater than the set value.
Short entry condition: 5-day EMA crosses below 21-day EMA, 50-day EMA crosses below 200-day EMA, BB %B is less than the set oversold line, AO is less than the set negative value, and ADX is greater than the set value.
##Advantage Analysis The strategy combines multiple indicators to determine trend direction and relative strength of stocks, which can effectively filter false breakouts. The specific advantages are:
The ADX indicator can effectively determine the existence and strength of the trend, avoiding frequent opening in a shock market.
The BB %B indicator judges whether the individual stocks are at a "high" or "low" level, which can effectively avoid chasing highs and selling lows.
The AO indicator determines whether there is relatively strong momentum support during buying to ensure the effectiveness of the breakout.
The EMA indicator's golden cross/dead cross combined with the judgment of the main direction of the market avoids opening positions against the trend.
In summary, this strategy can effectively control trading risks and track strong stocks in the market.
##Risk Analysis Although the strategy uses multiple indicators to control risks, there are still certain risks:
The combination of multiple exponential indicators is sensitive to parameter adjustments. Inappropriate parameter combinations may fail to achieve the desired effect.
Excessively pursuing momentum may miss the market's real reversal points. Profits and losses should be controlled in a timely manner.
Indicators like EMA have a lagging nature and may not be able to reflect the impact of sudden events in time. The MA period should be appropriately shortened or used with other indicators.
Major sudden events may cause indicator divergence. Fundamental analysis should be combined and the strategy can be temporarily closed if necessary.
##Optimization Direction The strategy can also be optimized in several aspects:
Use machine learning to find the optimal parameter combination.
Add other indicators that determine trends, such as CCI and MACD, to form an "indicator combination" to improve judgment accuracy.
Add stop-loss strategies to control single loss.
Set holding time to avoid excessive greed.
##Summary This strategy is named "Four-factor Momentum Tracking Strategy". It uses ADX, BB %B, AO and EMA four indicators to determine entry and exit points to dynamically track strong stocks. The strategy can effectively determine the trend direction and relative strength of stocks to control trading risks. Next, parameters optimization, adding other indicators, setting holding time and other methods can be used to further improve the strategy.
Parameters
| Name | Default | What it controls |
|---|---|---|
| v_input_1 | 10 | Take Profit % |
| v_input_2 | 5 | Stop Loss % |
| v_input_3 | 75 | BB %B Overbought |
| v_input_4 | 25 | BB %B Oversold |
| v_input_5 | 2 | Awesome Oscillator |
| v_input_6 | 15 | ADX |
| v_input_7 | true | Start Date |
| v_input_8 | true | Start Month |
| v_input_9 | 2018 | Start Year |
| v_input_10 | 20 | length |
| v_input_11_close | 0 | Source: close | high | low | open | hl2 | hlc3 | hlcc4 | ohlc4 |
| v_input_12 | 2 | StdDev |
| v_input_13 | 14 | ADX Smoothing |
| v_input_14 | 14 | DI Length |
Source Pine Script
/*backtest
start: 2022-12-04 00:00:00
end: 2023-12-10 00:00:00
period: 1d
basePeriod: 1h
exchanges: [{"eid":"Futures_Binance","currency":"BTC_USDT"}]
*/

//@version=4

//ADX + BB %B + AO + EMA

strategy("ADX + BB %B + AO + EMA", overlay=true, initial_capital=10000)
take_profit_perc = input(title="Take Profit %", type=input.integer, defval=10, minval=1, maxval=100)
stop_loss_perc = input(title="Stop Loss %", type=input.integer, defval=5, minval=1, maxval=100)
bb_overbought = input(title="BB %B Overbought", type=input.integer, defval=75, minval=1, maxval=100)
bb_oversold = input(title="BB %B Oversold", type=input.integer, defval=25, minval=1, maxval=100)
ao_value = input(title="Awesome Oscillator", type=input.integer, defval=2)
adx_value = input(title="ADX", type=input.integer, defval=15)

startDate = input(title="Start Date", type=input.integer, defval=1, minval=1, maxval=31)
startMonth = input(title="Start Month", type=input.integer, defval=1, minval=1, maxval=12)
startYear = input(title="Start Year", type=input.integer, defval=2018, minval=2008, maxval=2200)

inDateRange = (time >= timestamp(syminfo.timezone, startYear, startMonth, startDate, 0, 0))

ema5 = ema(close, 5)
ema21 = ema(close, 21)
ema50 = ema(close, 50)
ema200 = ema(close, 200)

//BB %B
length = input(20, minval=1)
src = input(close, title="Source")
mult = input(2.0, minval=0.001, maxval=50, title="StdDev")
basis = sma(src, length)
dev = mult * stdev(src, length)
upper = basis + dev
lower = basis - dev
bbr = (src - lower)/(upper - lower)

//Awesome Oscillator
ao = sma(hl2,5) - sma(hl2,34)

// ADX
adxlen = input(14, title="ADX Smoothing")
dilen = input(14, title="DI Length")
dirmov(len) =>
	up = change(high)
	down = -change(low)
	plusDM = na(up) ? na : (up > down and up > 0 ? up : 0)
	minusDM = na(down) ? na : (down > up and down > 0 ? down : 0)
	truerange = rma(tr, len)
	plus = fixnan(100 * rma(plusDM, len) / truerange)
	minus = fixnan(100 * rma(minusDM, len) / truerange)
	[plus, minus]
adx(dilen, adxlen) =>
	[plus, minus] = dirmov(dilen)
	sum = plus + minus
	adx = 100 * rma(abs(plus - minus) / (sum == 0 ? 1 : sum), adxlen)
sig = adx(dilen, adxlen)

long_strategy = ema5>ema21 and ema50>ema200 and bbr>(bb_overbought/100) and ao>ao_value and sig>adx_value
short_strategy = ema5<ema21 and ema50<ema200 and bbr<(bb_oversold/100) and ao<-ao_value and sig>adx_value

plot(ema5, color=color.blue)
plot(ema21, color=color.aqua)
plot(ema50, color=color.purple)
plot(ema200, color=color.red)
bgcolor(color=long_strategy ? color.green : na, transp=80)
bgcolor(color=short_strategy ? color.purple : na, transp=80)

if inDateRange and long_strategy
    strategy.entry("long", strategy.long)
    strategy.exit("exit", "long", stop=close*(100-stop_loss_perc)/100, limit=close*(100+take_profit_perc)/100)
if inDateRange and short_strategy
    strategy.entry("short", strategy.short)
    strategy.exit("exit", "short", stop=close*(100+stop_loss_perc)/100, limit=close*(100-take_profit_perc)/100)
Published by ChaoZhang on the FMZ strategy square · last modified 2023-12-11. Collected in the Quant Trading Vault. Unvalidated research: re-test with your own data and costs before trusting it.
Build this with AgenKit
A spec is not a trading system. Paste this into your coding agent and AgenKit runs a specialist team — architecture, test-first build, risk gates, review — with paper trading on by default.
/agenkit build a production-grade trading bot with a backtest engine, risk controls and paper trading by default from strategies/Four-factor-Momentum-Tracking-Trading-Strategy-Based-on-ADX-BB-B-AO-and-EMA.md- npx agenkit install engineering-kit in your project
- Paste the command into your agent and approve each phase
- Get tests, backtest, risk controls and a paper-trading switch
Understand it first
Before you run this, read the lesson behind the idea and how to backtest it honestly. Specs like this one are the survivors of an unknown number of trials; deflate their results accordingly.
Related specs
- ADX Momentum Trend StrategyPine Script · Momentum · 10m
- Momentum Finding StrategyPine Script · Momentum · 30m
- Momentum Trading Strategy Based on Multi factor ModelPine Script · Momentum · 1d
- Dynamic Momentum Weighted Moving Average Crossover StrategyPine Script · Momentum · 1h
- Momentum Trend Following Oscillation StrategyPine Script · Momentum · 1h
- Multi Indicator Comprehensive Analysis Quantitative Trading Strategy Trend Momentum and Volatility Collaborative Prediction ModelPine Script · Momentum · 3m