Fractal Breakout Strategy
This is a trend-following long line tracking strategy that judges the trend based on price fractals. It decides to open positions based on the breakthrough of the latest fractal point. At the same time, it judges the…
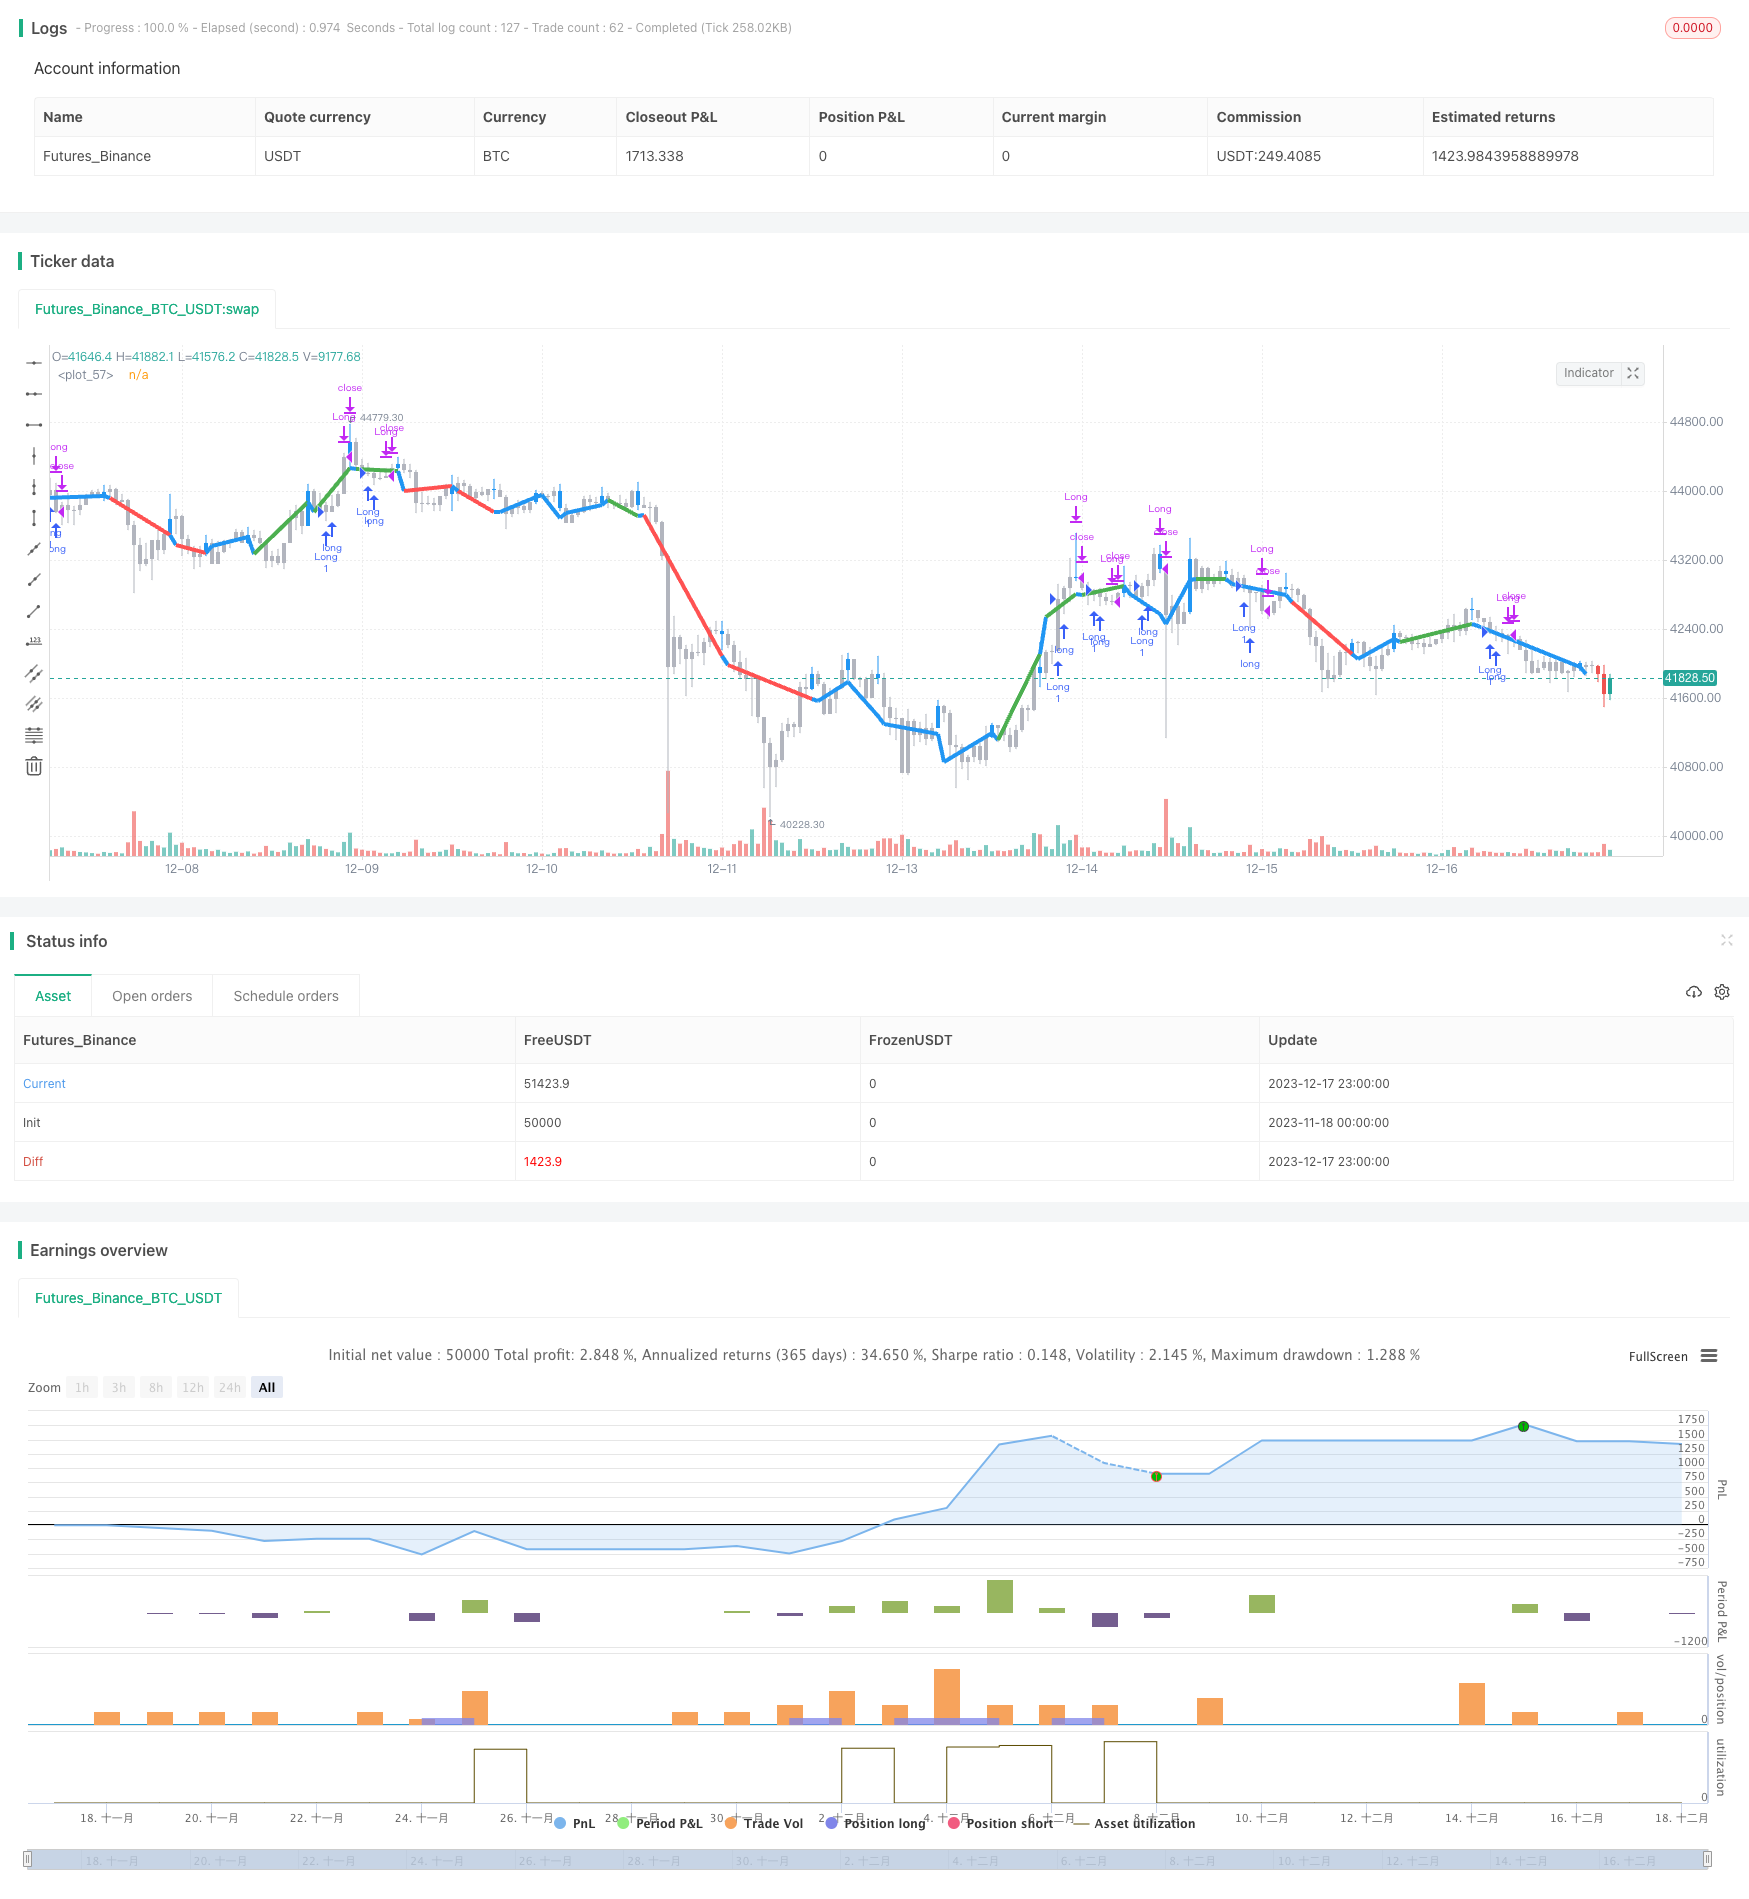
Overview
This is a trend-following long line tracking strategy that judges the trend based on price fractals. It decides to open positions based on the breakthrough of the latest fractal point. At the same time, it judges the trend direction by calculating the average price of the last N fractal points and closes positions when the trend changes.
Principles
Calculate the fractal points of prices. The fractal point is defined as the highest price today that is higher than the highest prices of the previous two days and the next two days.
Record the price of the last fractal point as resistance.
When the closing price breaks through the last fractal point, it is considered that the resistance has been broken and a long position has been established.
Calculate the average price of the last N fractal points to determine the trend. When the average price rises, it is a bullish trend, and when it falls, it is a bearish trend.
If the average fractal point price turns down during the long position, close the position.
Advantage Analysis
The biggest advantage of this fractal-based trend judgment strategy is that it can effectively filter market noise and determine longer-term trend directions. Compared with simple moving average lines and other indicators, it has greater resistance to sudden abnormal fluctuations.
In addition, the criteria for opening and closing positions of this strategy are very clear, which avoids frequent trading. It also makes it particularly suitable for long-term holdings.
Risk Analysis
The biggest risk of this strategy lies in the probabilistic nature of the fractal points themselves. Fractals cannot fully predict whether prices will definitely reverse, that is, the probability of misjudgment still exists. When misjudgments occur, it will face the risk of losses.
In addition, the time span for judging fractal points is long and cannot adapt to high frequency trading. If you pursue short-term trading, this strategy may not be suitable.
Optimization Directions
Considering the probability of misjudgment of fractal points, we can optimize in the following ways:
Combine with other indicators such as Bollinger Bands, moving averages, etc. to avoid misjudgments based solely on fractal points.
Adjust the parameters of fractal points, such as the number of periods before and after judgment, to optimize fractal point judgments.
Add stop loss strategies to stop losses when losses expand to a certain extent.
Summary
The Fractal Breakout Strategy is very suitable for judging long-term trends overall and is very suitable for use by long-term investors. As long as we properly adjust the parameters appropriately, add other filtering indicators on the premise of ensuring the accuracy of judgment, we can greatly optimize this strategy and make it an important part of quantitative Decision.
Parameters
| Name | Default | What it controls |
|---|---|---|
| v_input_1 | 3 | Always exit each trade after this amount of bars later (Most important strategy setting) |
| v_input_2_hl2 | 0 | Price type to determine the last fractal top and the fractal breakout, the default is (high+low)/2: hl2 | high | low | open | close | hlc3 | hlcc4 | ohlc4 |
| v_input_3 | true | Use Fractal price average of the last 3 fractals instead of the last 2 fractals? |
| v_input_4 | true | Use the price of the last bar to prevent repainting? |
| v_input_5 | true | Highlight fractal tops in blue and color all other bars in gray? |
| v_input_6 | true | Draw a colored line based on the fractal tops? |
Source Pine Script
/*backtest
start: 2023-11-18 00:00:00
end: 2023-12-18 00:00:00
period: 1h
basePeriod: 15m
exchanges: [{"eid":"Futures_Binance","currency":"BTC_USDT"}]
*/

//@version=2
strategy("Fractal Breakout Strategy (by ChartArt)", shorttitle="CA_-_Fractal_Breakout_Strat", overlay=true)

// ChartArt's Fractal Breakout Strategy
//
// Version 1.0
// Idea by ChartArt on April 24, 2016.
//
// This long only strategy determines the last fractal top
// and enters a trade when the price breaks above the last
// fractal top. The strategy also calculates the average
// price of the last 2 (or 3) fractal tops to get the trend.
//
// The strategy exits the long trade when the average of the
// fractal tops is falling (when the trend is lower highs).
// And the user can manually set a delay of this exit.
//
// In addition the fractals tops can be colored in blue
// and a line can be drawn based on the fractal tops.
// This fractal top line is colored by the fractal trend.
//
// List of my work:
// https://www.tradingview.com/u/ChartArt/
//
//  __             __  ___       __  ___
// /  ` |__|  /\  |__)  |   /\  |__)  |
// \__, |  | /~~\ |  \  |  /~~\ |  \  |
//
//


// input

n_time = input(title='Always exit each trade after this amount of bars later (Most important strategy setting)', defval=3)
price = input(hl2,title='Price type to determine the last fractal top and the fractal breakout, the default is (high+low)/2')


// fractal calculation

fractal_top = high[2] > high[3] and high[2] > high[4] and high[2] > high[1] and high[2] > high[0]
fractal_price = valuewhen(fractal_top, price, 1)
use_longer_average = input(true,title='Use Fractal price average of the last 3 fractals instead of the last 2 fractals?')
fractal_average = use_longer_average?(fractal_price[1] + fractal_price[2] + fractal_price[3] ) / 3 : (fractal_price[1] + fractal_price[2]) / 2
fractal_trend = fractal_average[0] > fractal_average[1]
no_repainting = input(true,title='Use the price of the last bar to prevent repainting?')
fractal_breakout = no_repainting?price[1] > fractal_price[0]:price[0] > fractal_price[0]


// highlight fractal tops

show_highlight = input(true,title='Highlight fractal tops in blue and color all other bars in gray?')
highlight = fractal_top?blue:silver
barcolor(show_highlight?highlight:na,offset=-2)
show_fractal_top_line = input(true,title='Draw a colored line based on the fractal tops?')
fractal_top_line = change(fractal_top) != 0 ? price : na
fractal_top_line_color = change(fractal_price) > 0 and fractal_breakout == true ? green : change(fractal_price) < 0 and fractal_breakout == false ? red : blue
plot(show_fractal_top_line?fractal_top_line:na,offset=-2,color=fractal_top_line_color,linewidth=4)


// strategy

trade_entry = fractal_trend and fractal_breakout
trade_exit = fractal_trend[n_time] and fractal_trend == false

if (trade_entry)
    strategy.entry('Long', strategy.long)

if (trade_exit)
strategy.close('Long')Published by ChaoZhang on the FMZ strategy square · last modified 2023-12-19. Collected in the Quant Trading Vault. Unvalidated research: re-test with your own data and costs before trusting it.
Build this with AgenKit
A spec is not a trading system. Paste this into your coding agent and AgenKit runs a specialist team — architecture, test-first build, risk gates, review — with paper trading on by default.
/agenkit build a production-grade trading bot with a backtest engine, risk controls and paper trading by default from strategies/Fractal-Breakout-Strategy.md- npx agenkit install engineering-kit in your project
- Paste the command into your agent and approve each phase
- Get tests, backtest, risk controls and a paper-trading switch
Understand it first
Before you run this, read the lesson behind the idea and how to backtest it honestly. Specs like this one are the survivors of an unknown number of trials; deflate their results accordingly.
Related specs
- Adaptive Bollinger Breakout with Moving Average Quantitative Strategy SystemPine Script · Breakout · 1h
- BB Breakout StrategyPine Script · Breakout · 1d
- Bollinger Band Breakout Trend Following StrategyPine Script · Breakout · 1d
- Bollinger Band Channel Breakout Trading StrategyPine Script · Breakout · 1d
- Bollinger Band T3 Moving Average StrategyPine Script · Breakout · 10m
- Bollinger Bands Breakout Trading StrategyPine Script · Breakout · 1h