High Frequency Trading Strategy Analysis System Based on Bollinger Bands and MACD Indicators
This is a high-frequency trading strategy system that combines Bollinger Bands, Moving Average Convergence Divergence (MACD), and volume analysis. The strategy captures market reversal opportunities by identifying…
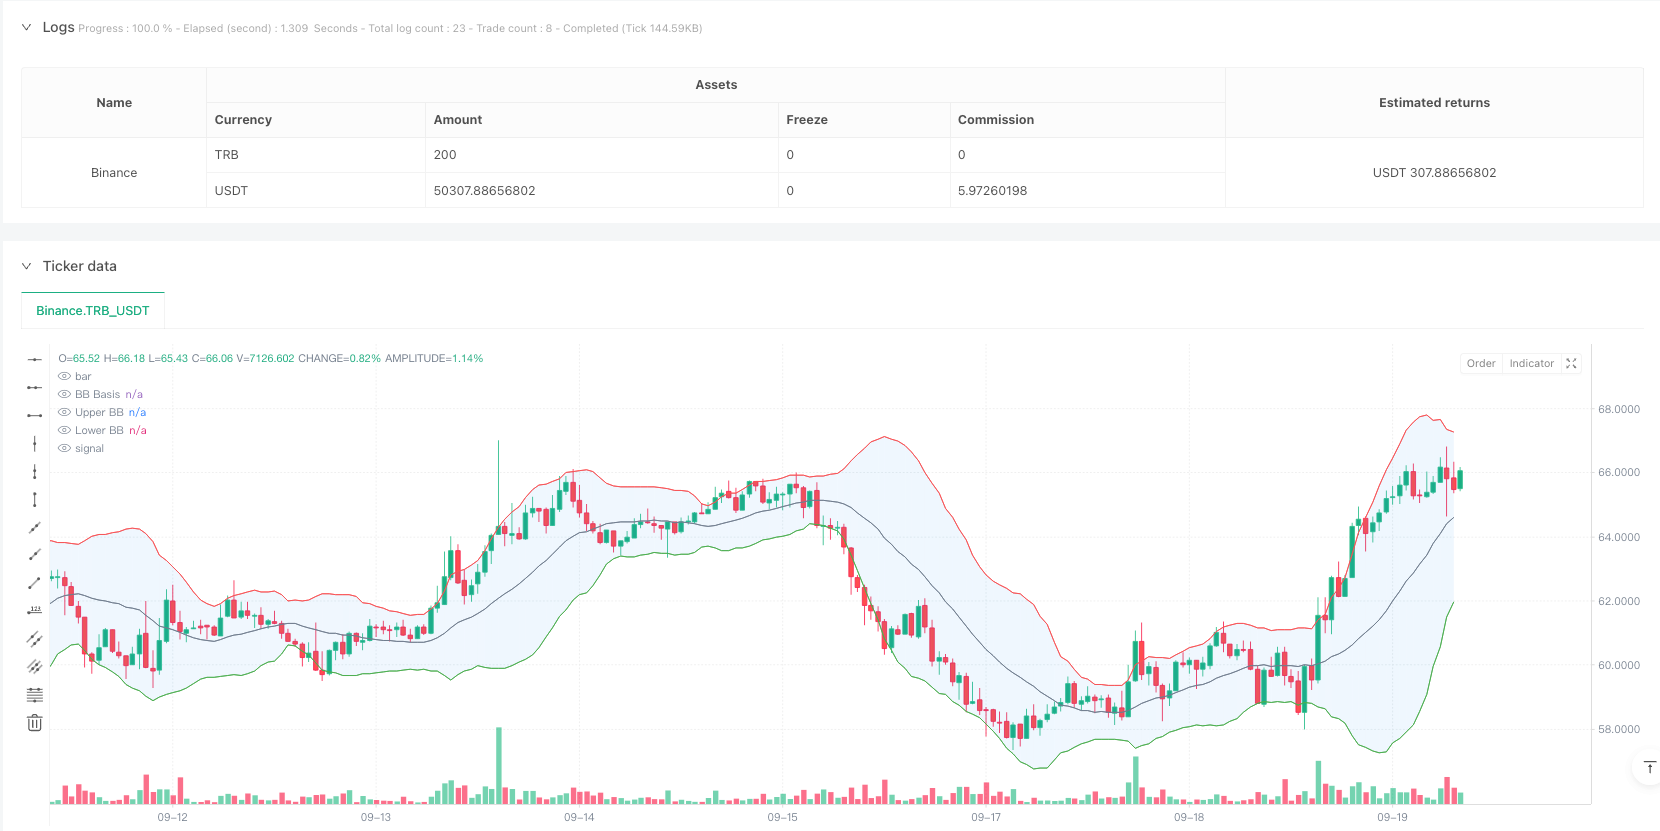
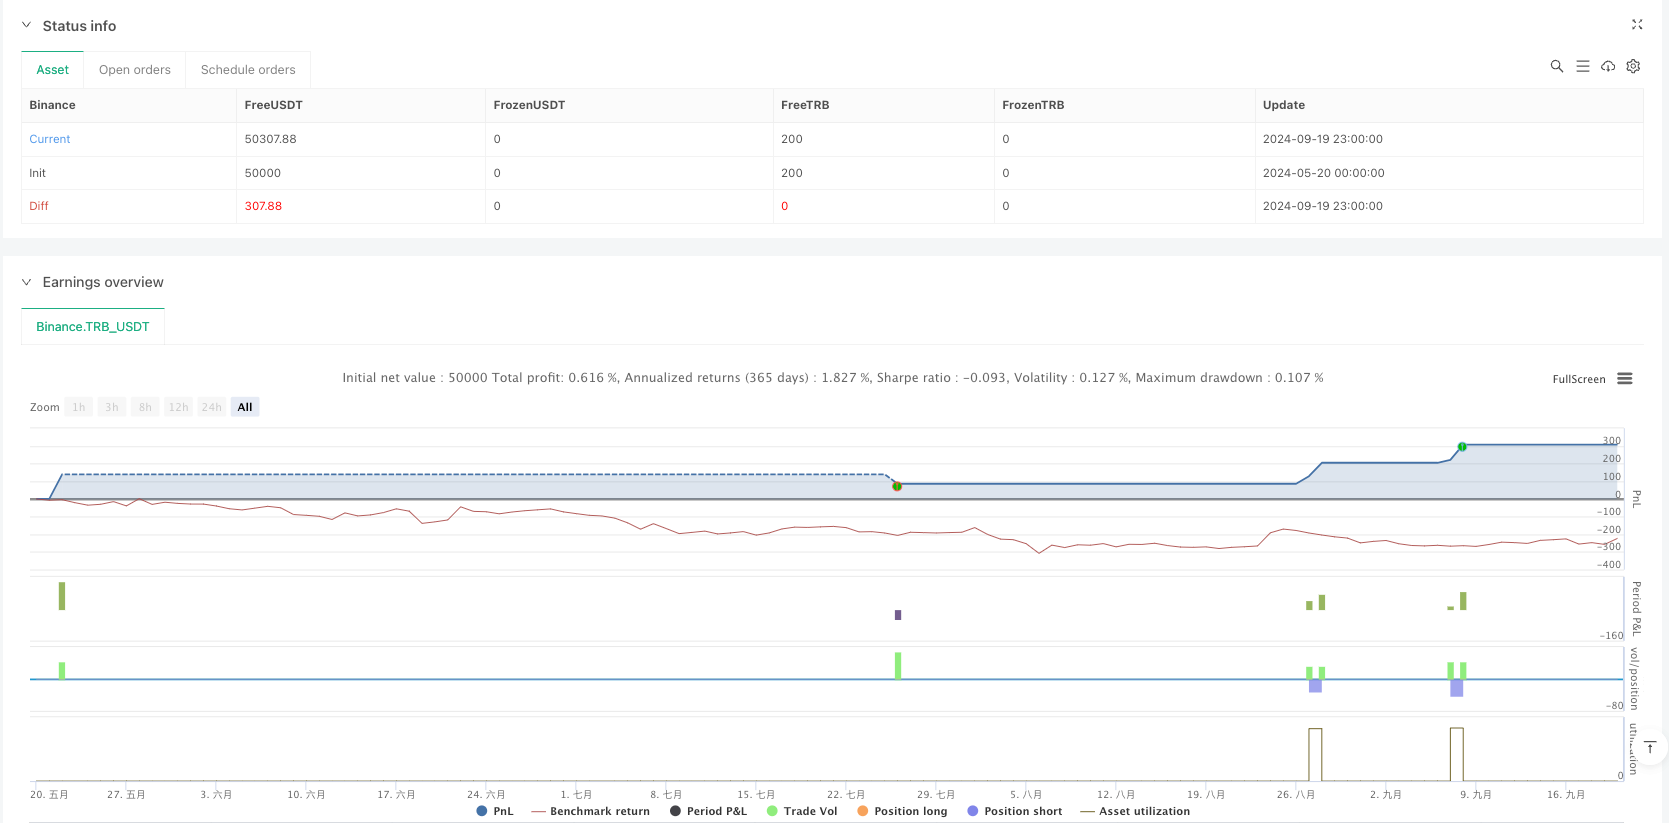
Overview
This is a high-frequency trading strategy system that combines Bollinger Bands, Moving Average Convergence Divergence (MACD), and volume analysis. The strategy captures market reversal opportunities by identifying price breakouts and reversals at Bollinger Bands, confirmed by MACD momentum indicators and volume analysis. The system implements a daily trade limit and comprehensive risk management mechanisms.
Strategy Principles
The strategy is based on three core indicator combinations:
- Bollinger Bands: Uses a 20-period Simple Moving Average (SMA) as the middle band, with a standard deviation multiplier of 2.0 for upper and lower bands. Trading signals are generated when prices revert after breaking the bands.
- MACD Indicator: Employs standard parameters (12,26,9) to confirm price momentum. Bullish signals are confirmed when the MACD line is above the signal line, and bearish signals when below.
- Volume Analysis: Uses a 20-period moving average to confirm volume, requiring signal-bar volume to reach at least the average level to ensure market participation.
Strategy Advantages
- Multiple Signal Confirmation: Triple verification through Bollinger Bands, MACD, and volume significantly improves signal reliability.
- Visual Design: The system provides rich chart indicators, including Bollinger Band fills, signal markers, and background color changes, facilitating quick identification of trading opportunities.
- Comprehensive Risk Control: Implements fixed stop-loss and take-profit targets, with daily trade limits effectively controlling risk exposure.
- Systematic Operation: The strategy provides clear entry and exit conditions, reducing uncertainty from subjective judgment.
Strategy Risks
- Market Volatility Risk: False breakout signals may occur in highly volatile markets, leading to trading losses.
- Slippage Risk: High-frequency trading environments may face significant slippage costs, affecting actual returns.
- Liquidity Risk: Volume conditions may limit trading opportunities during periods of insufficient market liquidity.
- Systematic Risk: Fixed parameter settings may not adapt to dramatic changes in market conditions.
Strategy Optimization Directions
- Dynamic Parameter Optimization: Introduce adaptive parameter adjustment mechanisms to automatically adjust Bollinger Bands and MACD parameters based on market conditions.
- Market Cycle Recognition: Add market cycle identification modules to employ different trading strategies under different market cycles.
- Risk Management Enhancement: Consider implementing dynamic stop-loss mechanisms that adjust stop positions based on market volatility.
- Signal Filter Enhancement: Add trend strength filters to avoid excessive trading signals in ranging markets.
Summary
The strategy constructs a complete trading system through the combination of Bollinger Band reversal signals, MACD trend confirmation, and volume verification. The system's visual design and strict risk control make it particularly suitable for intraday trading. While certain market risks exist, continuous optimization and parameter adjustment enable the strategy to maintain stable performance across different market environments.
Source Pine Script
/*backtest
start: 2024-05-20 00:00:00
end: 2024-09-20 00:00:00
period: 1h
basePeriod: 1h
exchanges: [{"eid":"Binance","currency":"TRB_USDT"}]
*/

//@version=5
// Bollinger Bounce Reversal Strategy - Visual Edition
//
// Description:
// This strategy seeks to capture reversal moves at extreme price levels ("bounce points") using Bollinger Bands.
// A long entry is triggered when the price, after being below the lower Bollinger Band, crosses upward above it,
// provided that the MACD line is above its signal line (indicating bullish momentum) and volume is strong.
// Conversely, a short entry is triggered when the price, after being above the upper Bollinger Band, crosses downward
// below it, with the MACD line below its signal line and high volume.
// To help avoid overtrading, the strategy limits entries to a maximum of 5 trades per day.
// Risk management is applied via fixed stop‑loss and take‑profit orders.
// This version overlays many visual cues on the chart: filled Bollinger Bands, signal markers, background colors,
// and an on‑chart information table displaying key values.
//
// Backtesting Parameters:
// • Initial Capital: $10,000
// • Commission: 0.1% per trade
// • Slippage: 1 tick per bar
//
// Disclaimer:
// Past performance is not indicative of future results. This strategy is experimental and provided solely for educational
// purposes. Please backtest and paper trade under your own conditions before live deployment.
//
// Author: [Your Name]
// Date: [Date]

strategy("Bollinger Bounce Reversal Strategy - Visual Edition", overlay=true, initial_capital=10000,
     default_qty_type=strategy.percent_of_equity, default_qty_value=5,
     commission_type=strategy.commission.percent, commission_value=0.1, slippage=1)

// ─── INPUTS ─────────────────────────────────────────────────────────────
bbPeriod        = input.int(20, "Bollinger Bands Period", minval=1)
bbStd           = input.float(2.0, "BB StdDev Multiplier", step=0.1)
macdFast        = input.int(12, "MACD Fast Length", minval=1)
macdSlow        = input.int(26, "MACD Slow Length", minval=1)
macdSignal      = input.int(9,  "MACD Signal Length", minval=1)
volAvgPeriod    = input.int(20, "Volume MA Period", minval=1)
volFactor       = input.float(1.0, "Volume Spike Factor", step=0.1)  // Volume must be >= volAvg * factor
stopLossPerc    = input.float(2.0,  "Stop Loss (%)", step=0.1) * 0.01
takeProfitPerc  = input.float(4.0,  "Take Profit (%)", step=0.1) * 0.01

// ─── CALCULATIONS ─────────────────────────────────────────────────────────
basis    = ta.sma(close, bbPeriod)
dev      = bbStd * ta.stdev(close, bbPeriod)
upperBB  = basis + dev
lowerBB  = basis - dev

[macdLine, signalLine, _] = ta.macd(close, macdFast, macdSlow, macdSignal)
volAvg   = ta.sma(volume, volAvgPeriod)

// ─── VISUALS: Bollinger Bands & Fill ───────────────────────────────────────
pBasis = plot(basis, color=color.gray, title="BB Basis")
pUpper = plot(upperBB, color=color.red, title="Upper BB")
pLower = plot(lowerBB, color=color.green, title="Lower BB")
fill(pUpper, pLower, color=color.new(color.blue, 90), title="BB Fill")

// ─── DAILY TRADE LIMIT ─────────────────────────────────────────────────────
// Reset the daily trade count at the start of each new day; limit entries to 5 per day.
var int tradesToday = 0
if ta.change(time("D"))
    tradesToday := 0

// ─── SIGNAL LOGIC ─────────────────────────────────────────────────────────
// Define a "bounce" signal:
// For a long signal, require that the previous bar was below the lower band and the current bar crosses above it,
// the MACD line is above its signal, and volume is high.
longSignal = (close[1] < lowerBB and close > lowerBB) and (macdLine > signalLine) and (volume >= volFactor * volAvg)
// For a short signal, require that the previous bar was above the upper band and the current bar crosses below it,
// the MACD line is below its signal, and volume is high.
shortSignal = (close[1] > upperBB and close < upperBB) and (macdLine < signalLine) and (volume >= volFactor * volAvg)

// Plot visual signal markers on the chart.
plotshape(longSignal, title="Long Signal", style=shape.labelup, location=location.belowbar, color=color.green, text="Long", size=size.small)
plotshape(shortSignal, title="Short Signal", style=shape.labeldown, location=location.abovebar, color=color.red, text="Short", size=size.small)

// Change background color on signal bars for an extra cue.
bgcolor(longSignal ? color.new(color.green, 80) : shortSignal ? color.new(color.red, 80) : na, title="Signal BG")

// Only enter trades if fewer than 5 have been taken today.
if longSignal and (tradesToday < 5)
    strategy.entry("Long", strategy.long)
    tradesToday += 1

if shortSignal and (tradesToday < 5)
    strategy.entry("Short", strategy.short)
    tradesToday += 1

// ─── RISK MANAGEMENT: STOP-LOSS & TAKE-PROFIT ─────────────────────────────
// For long positions: set stop loss and take profit relative to the entry price.
if strategy.position_size > 0
    strategy.exit("Long Exit", "Long", stop=strategy.position_avg_price*(1 - stopLossPerc), limit=strategy.position_avg_price*(1 + takeProfitPerc))
// For short positions: set stop loss and take profit relative to the entry price.
if strategy.position_size < 0
    strategy.exit("Short Exit", "Short", stop=strategy.position_avg_price*(1 + stopLossPerc), limit=strategy.position_avg_price*(1 - takeProfitPerc))
Published by ianzeng123 on the FMZ strategy square · last modified 2025-02-20. Collected in the Quant Trading Vault. Unvalidated research: re-test with your own data and costs before trusting it.
Build this with AgenKit
A spec is not a trading system. Paste this into your coding agent and AgenKit runs a specialist team — architecture, test-first build, risk gates, review — with paper trading on by default.
/agenkit build a production-grade trading bot with a backtest engine, risk controls and paper trading by default from strategies/High-Frequency-Trading-Strategy-Analysis-System-Based-on-Bollinger-Bands-and-MACD-Indicators.md- npx agenkit install engineering-kit in your project
- Paste the command into your agent and approve each phase
- Get tests, backtest, risk controls and a paper-trading switch
Understand it first
Before you run this, read the lesson behind the idea and how to backtest it honestly. Specs like this one are the survivors of an unknown number of trials; deflate their results accordingly.
Related specs
- Multi Indicator Dynamic Trading Strategy with Volume Confirmation SystemPine Script · Breakout · 1h
- Triple BB Bands Breakout with RSI StrategyPine Script · Breakout · 1h
- Bollinger Bands Dynamic Breakout StrategyPine Script · Breakout · 1h
- Cross boundary Dynamic Range Quantitative Trading Strategy Based on Bollinger BandsPine Script · Breakout · 3h
- Dynamic Bollinger Bands Breakout Quantitative Trading StrategyPine Script · Breakout · 2d
- Momentum Breakout Moving Average StrategyPine Script · Breakout · 1d