Holy Grail Strategy
The Holy Grail strategy is a quantitative trading strategy that combines a dual moving average system with the ADX indicator. It aims to identify the direction and strength of the trend and trade at trend reversals…
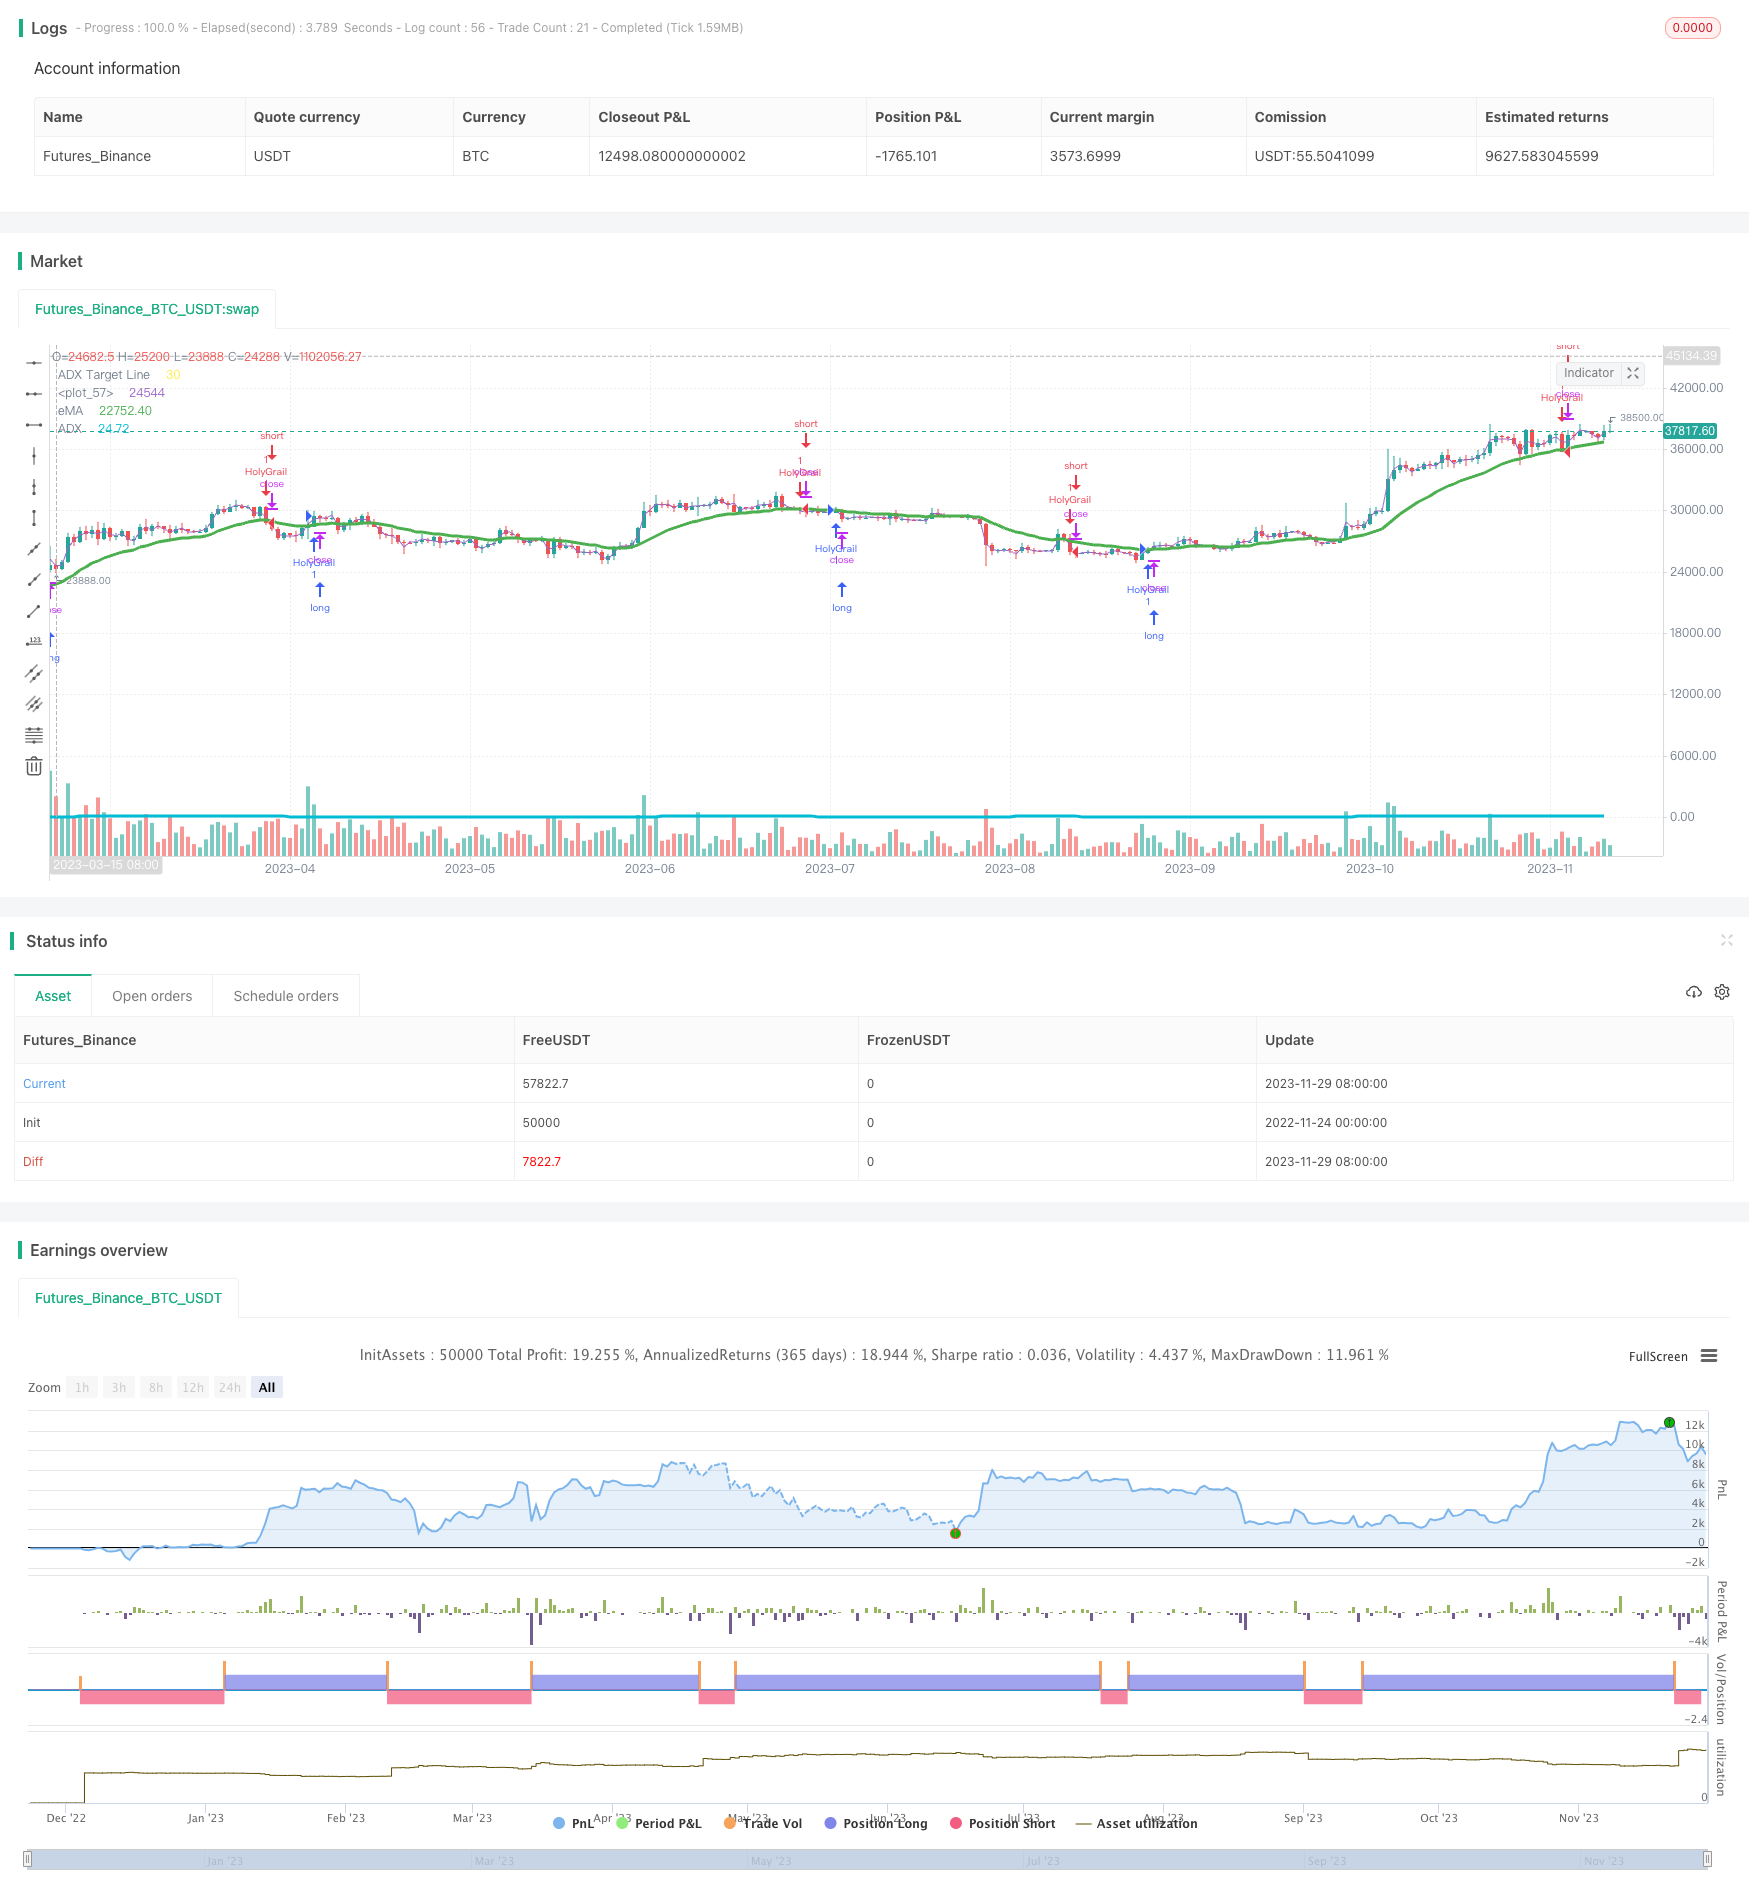
Holy Grail Strategy
The Holy Grail strategy is a quantitative trading strategy that combines a dual moving average system with the ADX indicator. It aims to identify the direction and strength of the trend and trade at trend reversals.
Strategy Principle
The strategy uses both the 20-day exponential moving average (EMA) and the ADX indicator to identify entry opportunities. Specifically, it will issue trading signals in the following two cases:
When the ADX value is below 30 (indicating a weaker trend), and the price breaks through the 20-day EMA from below, go long;
When the ADX value is above 30 (indicating a stronger trend), and the price breaks through the 20-day EMA from above, go short.
It can be seen that this strategy relies on the ADX to judge the strength and direction of the trend, and then combines the support and resistance of the moving average to look for reversal opportunities. It integrates the concepts of trend following and mean reversion.
Advantage Analysis
The biggest advantage of the Holy Grail strategy is that it takes into account both the direction and strength of the trend, which can effectively avoid false breakouts and reduce the probability of stop loss. Specifically, this strategy has the following advantages:
- Using a dual moving average system can effectively identify trends;
- With the help of ADX to evaluate the strength of the trend, invalid breakouts can be avoided;
- Combining reversal and trend trading concepts can both capture trends and reverse at turning points;
- The operation rules are clear and simple, easy to implement.
Risk Analysis
The Holy Grail strategy also has some risks, mainly in the following areas:
- ADX as an auxiliary judgment indicator will also issue wrong signals;
- Crossovers of double moving averages cannot completely avoid losses caused by small rallies;
- Improper parameter settings (such as ADX target values, moving average periods, etc.) may cause signals to be too frequent or conservative.
To reduce the above risks, parameters can be adjusted to achieve the best effect. Stop loss can also be set to control single losses. In addition, it is also necessary to test strategies on different varieties and cycles.
Optimization Directions
There are still many optimization directions for the Holy Grail strategy:
- Try different types of moving averages, such as weighted moving averages, etc.
- The ADX target value can be optimized as a parameter;
- Different cycle parameters can be tested, such as 10-day, 30-day EMA;
- Other auxiliary indicators can be added, such as RSI, Bollinger Bands, etc. to confirm trading signals.
Adjusting parameters or adding new indicators may increase the profitability or win rate of the strategy. But any optimization requires sufficient backtesting to ensure its robustness.
Summary
In summary, the Holy Grail strategy combines the advantages of double moving averages and the ADX indicator, and uses clear trading rules to capture trend reversals. It has the potential to perform well. However, traders still need to optimize parameter combinations and stop loss rules to adapt to different market environments. Moreover, no matter how improved, it is impossible to completely avoid stop loss, which is a dilemma faced by every trading strategy.
Parameters
| Name | Default | What it controls |
|---|---|---|
| v_input_1 | 2018 | Backtest Start Year |
| v_input_2 | 4 | Backtest Start Month |
| v_input_3 | 15 | Backtest Start Day |
| v_input_4 | 2018 | Backtest Stop Year |
| v_input_5 | 5 | Backtest Stop Month |
| v_input_6 | 30 | Backtest Stop Day |
| v_input_7 | true | Color Background? |
| v_input_8 | 14 | DI Length |
| v_input_9 | 14 | ADX Smoothing |
| v_input_10 | 30 | ADX Target Line |
Source Pine Script
/*backtest
start: 2022-11-24 00:00:00
end: 2023-11-30 00:00:00
period: 1d
basePeriod: 1h
exchanges: [{"eid":"Futures_Binance","currency":"BTC_USDT"}]
*/

//@version=3
strategy("LAT Holy Grail v3", overlay=true)

/////////////TEST TIME ////////////////////////
testStartYear = input(2018, "Backtest Start Year")
testStartMonth = input(4, "Backtest Start Month")
testStartDay = input(15, "Backtest Start Day")
testPeriodStart = timestamp(testStartYear,testStartMonth,testStartDay,0,0)

testStopYear = input(2018, "Backtest Stop Year")
testStopMonth = input(5, "Backtest Stop Month")
testStopDay = input(30, "Backtest Stop Day")
testPeriodStop = timestamp(testStopYear,testStopMonth,testStopDay,0,0)

// A switch to control background coloring of the test period
testPeriodBackground = input(title="Color Background?", type=bool, defval=true)
testPeriodBackgroundColor = testPeriodBackground and (time >= testPeriodStart) and (time <= testPeriodStop) ? #00FF00 : na
bgcolor(testPeriodBackgroundColor, transp=97)

testPeriod() =>
    time >= testPeriodStart and time <= testPeriodStop ? true : false
//////////////////////////////////////////////////////////////////////

myema= ema(close, 20)
plot(myema, color=green, title="eMA", linewidth=3)


//longCondition = (crossover(close, myema)) //and adx3 < target
//if (longCondition)
    //strategy.entry("My Long Entry Id", strategy.long)

//shortCondition = (crossunder(close, myema)) //and adx3 > target
//if (shortCondition)
    //strategy.entry("My Short Entry Id", strategy.short)

    //////////////////////////////////////////////////////////
    ///////////////////////////////////////   DMI  ///////////////////////////////////////////////
len3 = input(14, minval=1, title="DI Length")                           /////////////////////
lensig3 = input(14, title="ADX Smoothing", minval=1, maxval=50)         ////////////////////
up3 = change(high)                                                      ///////////////////
down3 = -change(low)                                                    //////////////////
plusDM3 = na(up3) ? na : (up3 > down3 and up3 > 0 ? up3 : 0)            /////////////////
minusDM3 = na(down3) ? na : (down3 > up3 and down3 > 0 ? down3 : 0)     ////////////////
trur3 = rma(tr, len3)                                                   ///////////////
plus3 = fixnan(100 * rma(plusDM3, len3) / trur3)                        //////////////
minus3 = fixnan(100 * rma(minusDM3, len3) / trur3)                      /////////////
sum3 = plus3 + minus3                                                   ////////////
adx3 = 100 * rma(abs(plus3 - minus3) / (sum3 == 0 ? 1 : sum3), lensig3) ///////////
//plot(plus3, color=green, style=circles, linewidth=2, title="+DI")     //////////
//plot(minus3, color=red, style=circles, linewidth=2, title="-DI")      /////////
plot(adx3, color=aqua, style=line, linewidth=3, title="ADX")            ////////
target = input(30, title=" ADX Target Line")                            ///////
plot(target, color=yellow, title="ADX Target Line")                     //////
/////////////////////////////////////////////////////////////////////////////////////////////////

plot(hl2)


///////////////////////////////////////////////  eMA SIGNAL LINE   ///////////////////////////////////////

//////////////////////////////////////////////////////////////////////////////////////////////////////////

//////////////////////////////////////// HOLY GRAIL STRATEGY ///////////////////////////////////////////////////////////////////

if (adx3 <= target) and crossover(close, myema)
    strategy.entry("HolyGrail", strategy.long, comment="Long")

if (adx3 >= target) and crossunder(close, myema)
    strategy.entry("HolyGrail", strategy.short, comment="Short")
Published by ChaoZhang on the FMZ strategy square · last modified 2023-12-01. Collected in the Quant Trading Vault. Unvalidated research: re-test with your own data and costs before trusting it.
Build this with AgenKit
A spec is not a trading system. Paste this into your coding agent and AgenKit runs a specialist team — architecture, test-first build, risk gates, review — with paper trading on by default.
/agenkit build a production-grade trading bot with a backtest engine, risk controls and paper trading by default from strategies/Holy-Grail-Strategy.md- npx agenkit install engineering-kit in your project
- Paste the command into your agent and approve each phase
- Get tests, backtest, risk controls and a paper-trading switch
Understand it first
Before you run this, read the lesson behind the idea and how to backtest it honestly. Specs like this one are the survivors of an unknown number of trials; deflate their results accordingly.
Related specs
- Moving Average Crossover and Upper Rail Breakthrough Impulse StrategyPine Script · Breakout · 1m
- Quantitative Trading Strategy Based on Ichimoku with Multiple SignalsPine Script · Breakout · 1h
- Momentum Breakout Intraday Trading StrategyPine Script · Breakout · 5m
- Multi Indicator Trend Following and Volatility Breakout StrategyPine Script · Breakout · 2h
- Multi Timeframe Trend Breakout Strategy with RSI Filter and ATR Based Risk ManagementPine Script · Breakout
- Triple Pattern Oscillation Trading StrategyPine Script · Breakout · 1h