Strategy vault / Trend following
Hurst Future Lines of Demarcation Strategy
The Hurst Future Lines of Demarcation Strategy is a trading strategy based on the concept of Future Line of Demarcation (FLD) introduced by J.M. Hurst in the 1970s. The strategy predicts future price movements by…
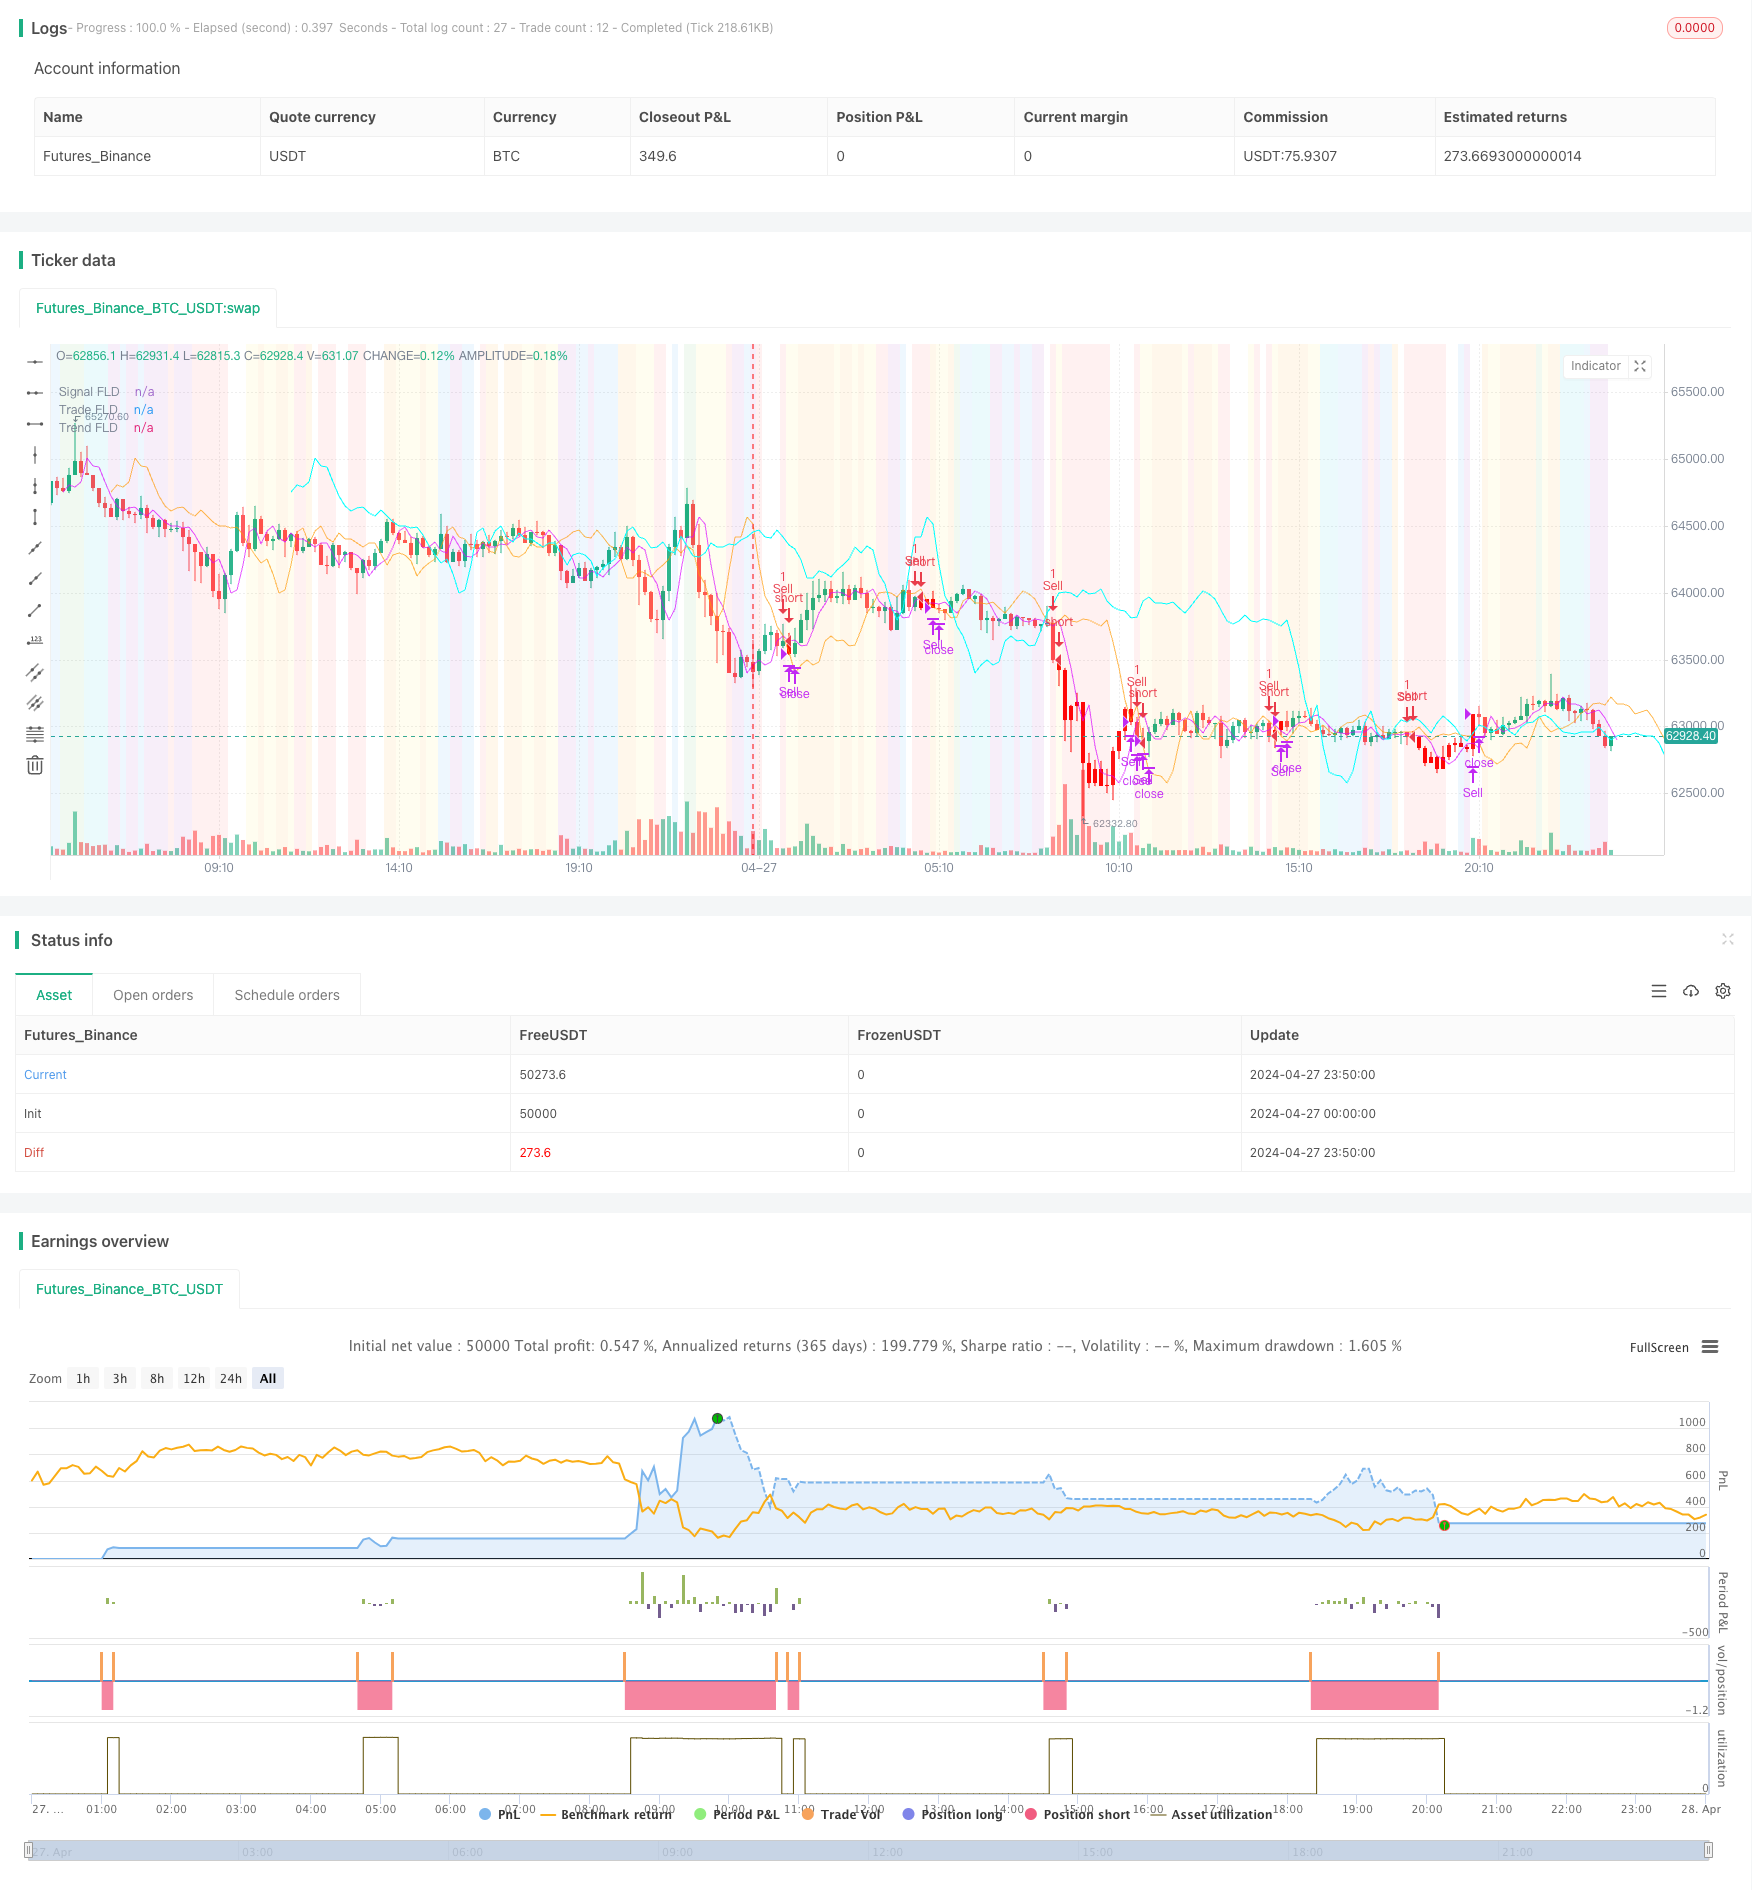
Overview
The Hurst Future Lines of Demarcation Strategy is a trading strategy based on the concept of Future Line of Demarcation (FLD) introduced by J.M. Hurst in the 1970s. The strategy predicts future price movements by drawing a simple yet profound line on a financial chart, which is constructed by offsetting the price data half a cycle ahead on the time axis. Specifically, the strategy focuses on the interplay between three Hurst Cycles: the Signal Cycle, the Trade Cycle, and the Trend Cycle. By observing the crossover and divergence patterns between the price and the FLD lines, traders can gauge market trends or consolidations and determine entry and exit points.
Strategy Principle
The core of the Hurst Future Lines of Demarcation Strategy is to offset the price data half a cycle ahead on the time axis to construct the Future Line of Demarcation (FLD). For example, in the context of a 40-day cycle, the FLD would be represented by shifting the current price data 20 days forward on the chart. The strategy primarily focuses on three Hurst Cycles: the Signal Cycle (default: 20 days), the Trade Cycle (default: 20 days), and the Trend Cycle (default: 80 days). By observing the crossover and divergence patterns between the price and these three FLD lines, traders can determine market trends or consolidations. When the price is above the Signal FLD, the Signal FLD is above the Trade FLD, and the Trade FLD is above the Trend FLD, the market is in an uptrend (Phase A); when the price breaks below the Signal FLD, the market enters a pullback (Phase B). Similarly, other phases (C through H) have corresponding price and FLD line interaction patterns. The strategy also includes adjustable "Close the Trade" triggers, such as Price, Signal FLD, Trade FLD, or Trend FLD, to determine trade exits.
Strategy Advantages
The main advantages of the Hurst Future Lines of Demarcation Strategy include:
- Simplicity: The strategy is based on the simple concept of FLD and is easy to understand and apply.
- Forward-looking: By offsetting the price data forward, the FLD provides a forecast of future price movements.
- Multi-cycle analysis: The strategy combines three different Hurst Cycles, offering a more comprehensive market analysis.
- Trend and consolidation identification: By observing the interaction patterns between the price and FLD lines, traders can determine market trends or consolidations.
- Customizability: The strategy provides adjustable "Close the Trade" triggers, allowing traders to set exit points based on their preferences.
Strategy Risks
Despite its advantages, the Hurst Future Lines of Demarcation Strategy also has some potential risks:
- Parameter sensitivity: The strategy's performance may be sensitive to parameters such as cycle lengths, and different parameter settings may lead to different results.
- Market adaptability: The strategy may underperform in certain market conditions, such as unclear trends or high volatility.
- Lag: Since the FLD is calculated based on historical data, there may be a certain degree of lag.
- Overtrading: If the "Close the Trade" triggers are not set properly, it may lead to overtrading and high transaction costs.
To mitigate these risks, traders can consider parameter optimization, adjusting the strategy for different market conditions, and setting appropriate stop-loss and risk management measures.
Strategy Optimization Directions
The Hurst Future Lines of Demarcation Strategy can be optimized in the following aspects:
- Parameter optimization: Optimize parameters such as cycle lengths and "Close the Trade" triggers to improve the strategy's performance.
- Multi-timeframe analysis: Apply the strategy to different timeframes to gain a more comprehensive market perspective.
- Combination with other indicators: Combine the FLD with other technical indicators (e.g., moving averages, oscillators) to enhance signal reliability.
- Risk management: Introduce stop-loss and position sizing mechanisms to control risks and optimize returns.
- Market adaptability: Develop targeted optimization approaches for different market conditions (e.g., trending, oscillating).
Through these optimization measures, the Hurst Future Lines of Demarcation Strategy can better adapt to various market environments, improving its stability and profitability.
Conclusion
The Hurst Future Lines of Demarcation Strategy is an innovative trading strategy based on J.M. Hurst's concept of Future Line of Demarcation. By offsetting the price data half a cycle ahead on the time axis to construct the Future Line of Demarcation and combining three different Hurst Cycles (Signal Cycle, Trade Cycle, and Trend Cycle), the strategy provides a forecast of future price movements. Traders can determine market trends or consolidations and identify entry and exit points by observing the crossover and divergence patterns between the price and FLD lines. Although the strategy has advantages such as simplicity, forward-looking nature, and multi-cycle analysis, it also has some potential risks, including parameter sensitivity, market adaptability, and lag. To optimize the strategy, traders can consider parameter optimization, multi-timeframe analysis, combination with other indicators, risk management, and market adaptability. Overall, the Hurst Future Lines of Demarcation Strategy offers traders a unique perspective and tool to anticipate and seize market opportunities.
Parameters
| Name | Default | What it controls |
|---|---|---|
| v_input_1_ohlc4 | 0 | Source: ohlc4 | high | low | open | hl2 | hlc3 | hlcc4 | close |
| v_input_bool_1 | false | Smooth FLD |
| v_input_2 | 33 | FLD transparency |
| v_input_int_1 | 5 | FLD Smoothing |
| v_input_string_1 | 0 | Input Close Trigger 1: Price | Signal | Trade | Trend | None |
| v_input_string_2 | 0 | Input Close Trigger 2: Trade | Signal | Price | Trend | None |
| v_input_color_1 | #da00ff | Quarter Cycle Color |
| v_input_int_2 | 5 | Signal Cycle Length |
| v_input_color_2 | #ff9800 | Trade Cycle Color |
| v_input_int_3 | 20 | Trade Cycle Length |
| v_input_color_3 | aqua | Double Cycle Color |
| v_input_int_4 | 80 | Trend Cycle Length |
Source Pine Script
/*backtest
start: 2024-04-27 00:00:00
end: 2024-04-28 00:00:00
period: 10m
basePeriod: 1m
exchanges: [{"eid":"Futures_Binance","currency":"BTC_USDT"}]
*/

// This source code is subject to the terms of the Mozilla Public License 2.0 at https://mozilla.org/MPL/2.0/
// © BarefootJoey

//@version=5
strategy("Hurst Future Lines of Demarcation Strategy", overlay=true)

// FLD Settings
source      = input(ohlc4, 'Source')
smoothFLD   = input.bool(false, 'Smooth FLD')
FLDtransp   = input(33, 'FLD transparency')
FLDsmooth   = input.int(5, "FLD Smoothing", minval=1, tooltip="Number of trading days to smooth the FLD")
FLD_out = ta.sma(source , smoothFLD ? FLDsmooth : 1)

close_buy_in_1 = input.string('Price', 'Input Close Trigger 1', options=['Price', 'Signal', 'Trade', 'Trend', 'None'])
close_buy_in_2 = input.string('Trade', 'Input Close Trigger 2', options=['Price', 'Signal', 'Trade', 'Trend', 'None'])

// Quarter Cycle (Default: 20 day) Length Pivot Cycle
col_q = input.color(#da00ff, "Quarter Cycle Color")
cyc_q = input.int(5, "Signal Cycle Length")
plot(FLD_out, color=color.new(col_q, FLDtransp), title='Signal FLD', offset = math.round(cyc_q/2) )

// Trade Cycle (Default: 20 day) Length Pivot Cycle
col = input.color(#ff9800, "Trade Cycle Color")
cyc = input.int(20, "Trade Cycle Length")
plot(FLD_out, color=color.new(col, FLDtransp), title='Trade FLD', offset = math.round(cyc/2) )

// Double Cycle (Default: 80 day) Length Pivot Cycle
col_d = input.color(color.aqua, "Double Cycle Color")
cyc_d = input.int(80, "Trend Cycle Length")
plot(FLD_out, color=color.new(col_d, FLDtransp), title='Trend FLD', offset = math.round(cyc_d/2) )

// Strategy Plots
price = source
signal = FLD_out[math.round(cyc_q/2)]
trade = FLD_out[math.round(cyc/2)]
trend = FLD_out[math.round(cyc_d/2)]

// Trend State
var state = 0
if signal > trade and trade > trend
    state := 1 // (A)
    state
if state == 1 and price < signal
    state := 2 // (B)
    state
if signal < trade and trade > trend
    state := 3 // (C)
    state
if state == 3 and price < signal
    state := 4 // (D)
    state
if signal < trade and trade < trend
    state := 5 // (E)
    state
if state == 5 and price < signal
    state := 6 // (F)
    state
if signal > trade and trade < trend
    state := 7 // (G)
    state
if state == 7 and price < signal
    state := 8 // (H)
    state
state := state

// Strategy Definitions
close_buy_out_1 = close_buy_in_1 == 'Price' ? price : close_buy_in_1 == 'Signal' ? signal : close_buy_in_1 == 'Trade' ? trade : close_buy_in_1 == 'Trend' ? trend : na
close_buy_out_2 = close_buy_in_2 == 'Price' ? price : close_buy_in_2 == 'Signal' ? signal : close_buy_in_2 == 'Trade' ? trade : close_buy_in_2 == 'Trend' ? trend : na
buy = ta.crossover(price, signal) and state == 1
close_buy = strategy.position_size>0 and ta.crossunder(close_buy_out_1, close_buy_out_2)
sell = ta.crossunder(price, signal) and state == 6
close_sell = strategy.position_size<0 and ta.crossover(close_buy_out_1, close_buy_out_2)

// FLD Interaction State Background
interaction_color = state == 1 ? color.green : // A
  state == 2 ? color.aqua : // B
  state == 3 ? color.blue : // C
  state == 4 ? color.purple : // D
  state == 5 ? color.white : // E
  state == 6 ? color.red :// F
  state == 7 ? color.orange : // G
  state == 8 ? color.yellow : na // H

bgcolor(color.new(interaction_color, 90), title= "A-H Background")

bar_color = strategy.position_size>0 ? #00ff0a : strategy.position_size<0 ? #FF0000 : na
barcolor(bar_color)

if buy
    strategy.entry("Buy", strategy.long)
if close_buy
    strategy.close("Buy", qty_percent=100)

if sell
    strategy.entry("Sell", strategy.short)
if close_sell
    strategy.close("Sell", qty_percent=100)

// EoS made w/ ❤ by @BarefootJoey ✌??Published by ChaoZhang on the FMZ strategy square · last modified 2024-04-29. Collected in the Quant Trading Vault. Unvalidated research: re-test with your own data and costs before trusting it.
Build this with AgenKit
A spec is not a trading system. Paste this into your coding agent and AgenKit runs a specialist team — architecture, test-first build, risk gates, review — with paper trading on by default.
/agenkit build a production-grade trading bot with a backtest engine, risk controls and paper trading by default from strategies/Hurst-Future-Lines-of-Demarcation-Strategy.md- npx agenkit install engineering-kit in your project
- Paste the command into your agent and approve each phase
- Get tests, backtest, risk controls and a paper-trading switch
Understand it first
Before you run this, read the lesson behind the idea and how to backtest it honestly. Specs like this one are the survivors of an unknown number of trials; deflate their results accordingly.
Related specs
- Bollinger Bands Precise Crossover Quantitative StrategyPine Script · Trend following · 1h
- Comprehensive Trading System Combining SMA Crossover Strategy with Fair Value Gap PullbackPine Script · Trend following · 1d
- Dual Moving Average Trend Following System with Adaptive Dynamic Filtering StrategyPine Script · Trend following · 30m
- EMA AROON ASHPine Script · Trend following · 3m
- EMA SMA Trend Following with Swing Trading Strategy Combined Volume Filter and Percentage Take Profit Stop Loss SystemPine Script · Trend following · 1d
- Fixed Range Volume Profile And Anchored VWAP Trend Identification Strategy With Dynamic Stop LossPine Script · Trend following · 1h