Strategy vault / Trend following
Ichimoku Cloud Day Trading Strategy
This strategy implements intraday stock trading using Ichimoku Cloud lines. It belongs to short-term trading strategies. It utilizes the conversion line, base line and leading lines of Ichimoku Cloud to generate…
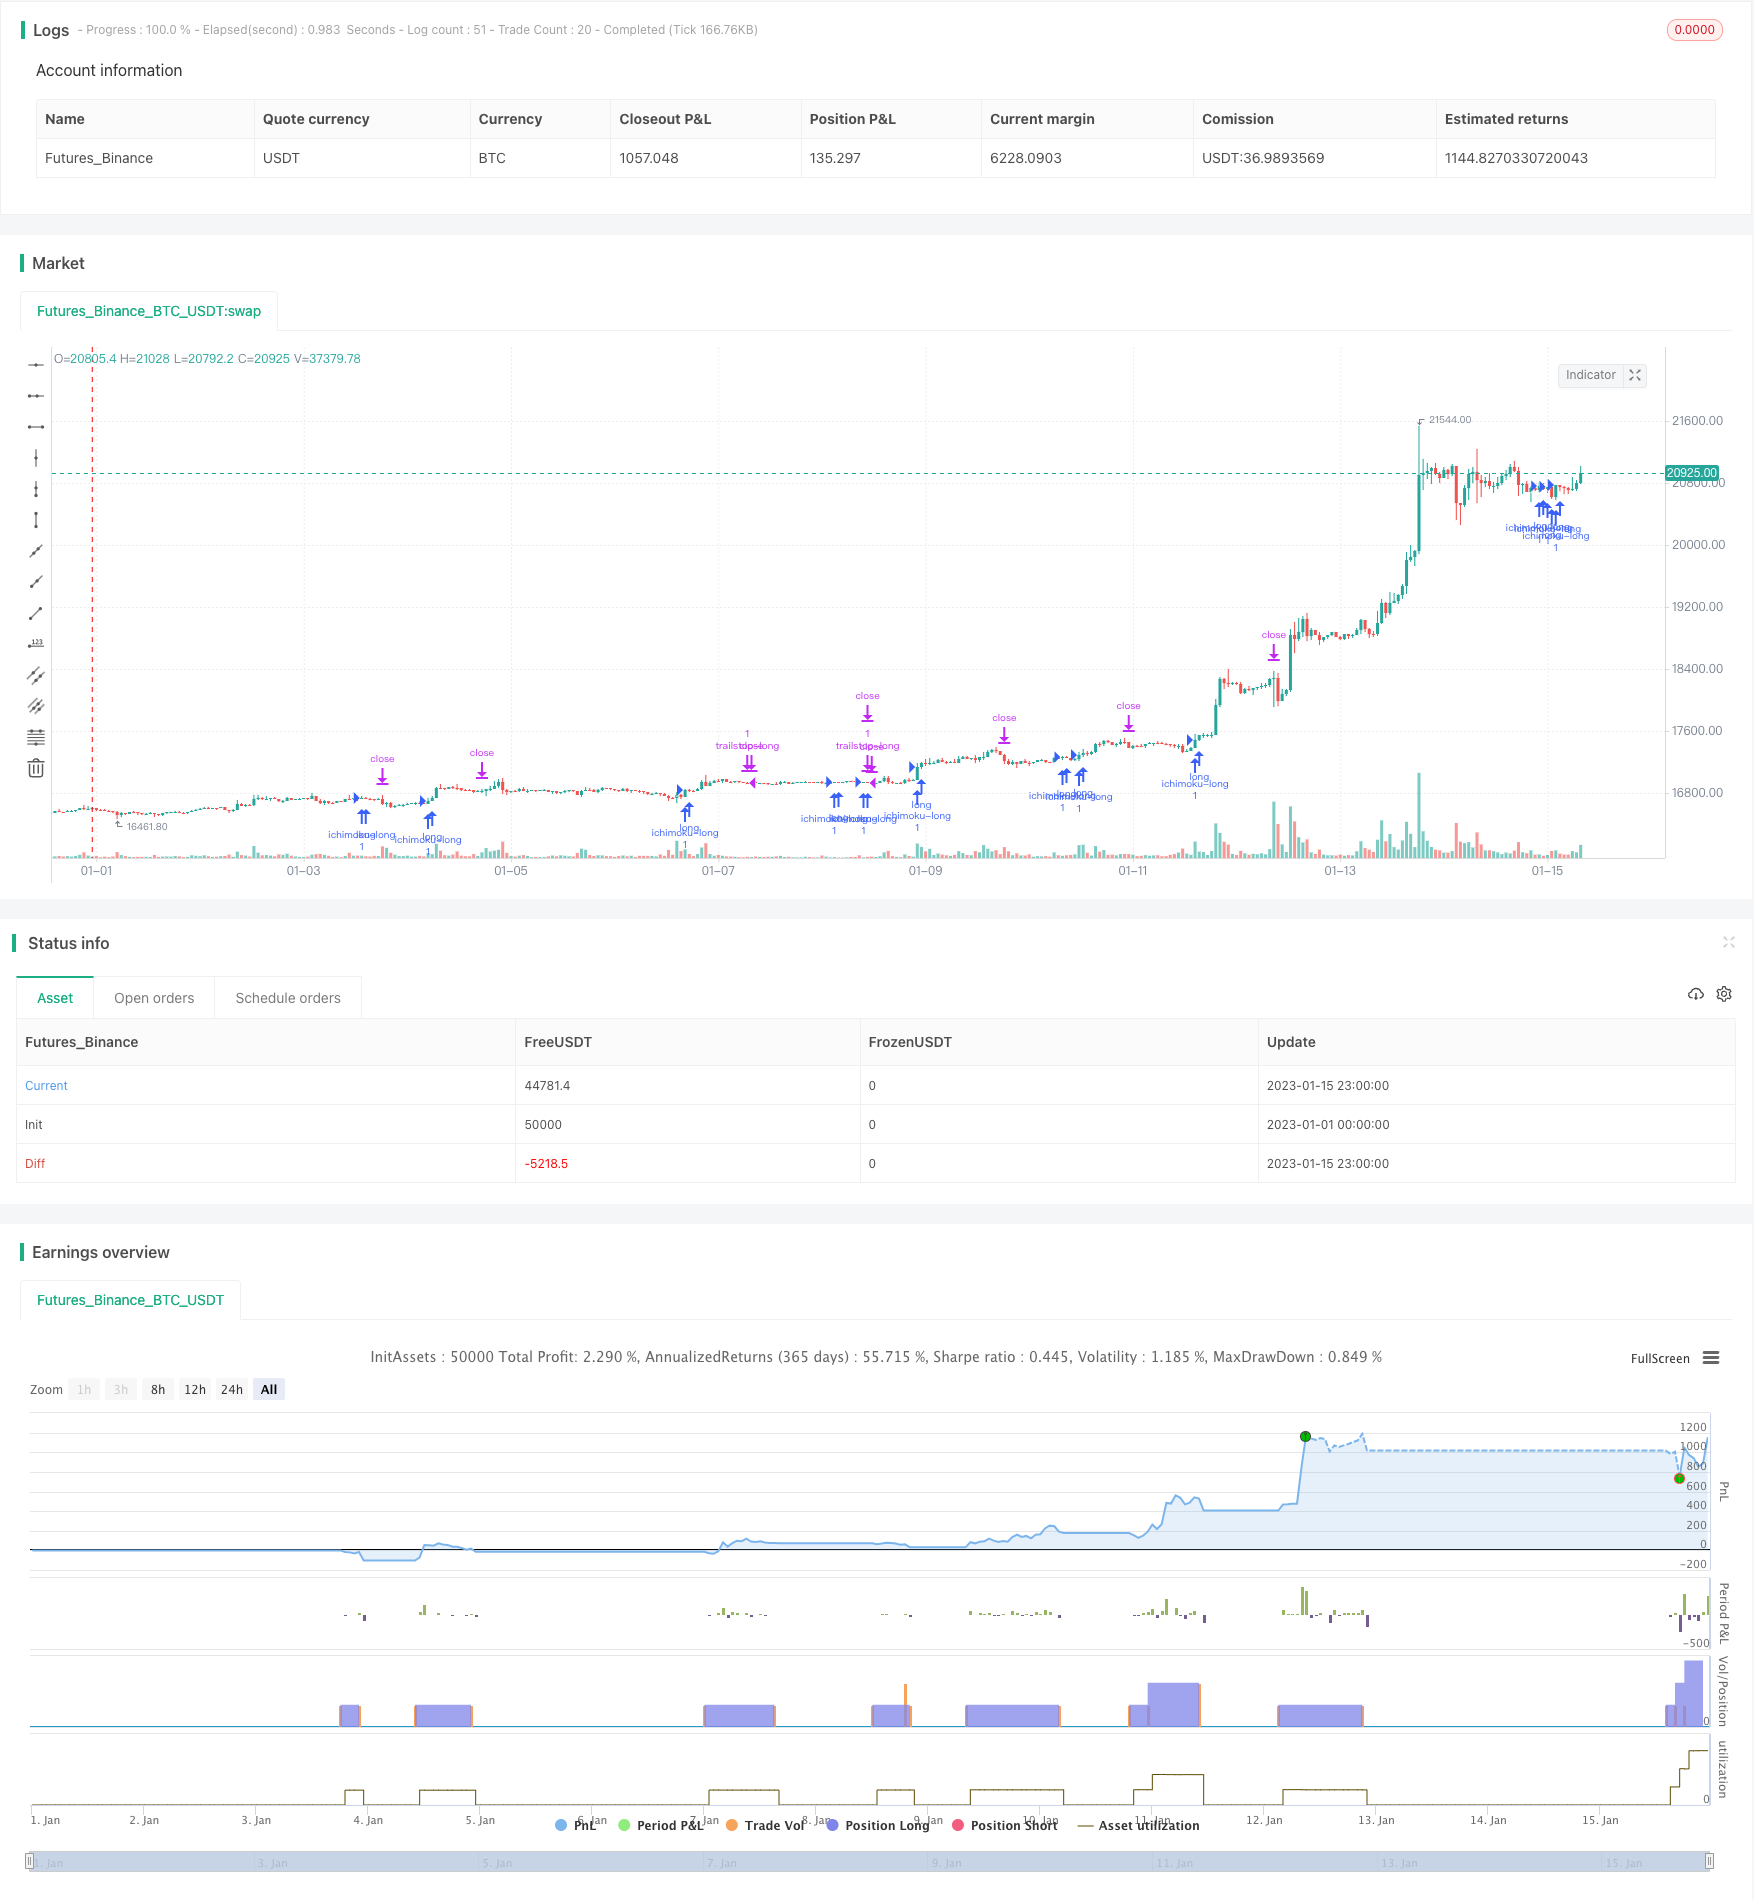
Overview
This strategy implements intraday stock trading using Ichimoku Cloud lines. It belongs to short-term trading strategies. It utilizes the conversion line, base line and leading lines of Ichimoku Cloud to generate trading signals, and uses Parabolic SAR for stop loss trailing, achieving double protection.
Principles
The Ichimoku Cloud consists of the conversion line, base line, leading line 1 and leading line 2. The conversion line is the average of the closing price and the highest and lowest prices over the past 9 days, reflecting the recent equilibrium state of the stock price. The base line is the average of the highest and lowest prices over the past 26 days, representing the medium to long term equilibrium state. Leading line 1 is the average of the base line and conversion line, reflecting the future trend. Leading line 2 is the average of the highest and lowest prices over the past 52 days. These equilibrium lines combine to form the trading signals.
When the closing price breaks through the base line upwards and is above the leading line 2, a buy signal is generated. When the closing price breaks the base line downwards and is below the leading line 1, a sell signal is generated. The Parabolic SAR is used for stop loss trailing, generating a stop loss signal when the price is below the SAR.
This strategy utilizes the combination of equilibrium lines to determine future price trends and the sustainability of the current trend. It belongs to typical trend following strategies. It follows the trend by trading when buy and sell signals appear. Meanwhile, the SAR stop loss and take profit mechanism avoids enlarging losses.
Advantages
- Using equilibrium lines to determine future trends improves accuracy
The equilibrium lines contain price information of different periods, reflecting changes in trends in advance. Using a combination improves accuracy compared to single indicators. It can identify trading signals more accurately.
- SAR trailing stop provides double protection
SAR can flexibly track the stock price for stop loss. Combining with equilibrium lines, it allows timely stop loss after profit taking, avoiding enlarged losses.
- Simple parameters, easy to implement
This strategy has minimal parameters without complex technical indicators like curve fitting, simple and practical to implement. Default values can already achieve good results.
- Suitable for intraday and short-term trading
It identifies trading signals from intraday price changes, suitable for short-term trading. It can fully capitalize on intraday fluctuations for profits.
Risks
- Drawdown risk
Trend following trading leads to higher drawdowns. Reasonable stop loss levels must be set to limit per trade loss.
- Whipsaw risk
Frequent trading signals may be generated during range-bound markets, unfavorable for profitability. Parameters can be adjusted to filter out some signals.
- Over-optimization risk
Simple parameters are susceptible to over-optimization. Real trading performance may not be ideal. Robustness tests should be conducted to prevent over-fitting.
- Results vary across different instruments
Performance depends on the trading instruments. Trending stocks with clear trends should be chosen to maximize strategy efficacy.
Enhancement Opportunities
- Add filters with other indicators
Other indicators like moving averages can be added to filter uncertain signals and avoid false trades.
- Dynamic adjustment of stop loss
SAR parameters can be dynamically adjusted based on market volatility, for more flexible stop loss.
- Parameter optimization
More systematic optimization and combinatorial testing can find better parameter sets to improve performance.
- Adjust position sizing by market regime
Position sizing and leverage can be dynamically adjusted based on market conditions like index trends, to control risks.
Conclusion
This strategy utilizes Ichimoku Cloud's trading signals and Parabolic SAR for stop loss trailing. It is a simple and practical short-term trading strategy. It capitalizes on Ichimoku Cloud's trend prediction capability for breakout trading. The stop loss mechanism avoids enlarging losses. Proper drawdown control, stock selection and parameter tuning are needed for implementation. With these addressed, it is an easy to implement strategy with respectable performance for intraday trading.
Parameters
| Name | Default | What it controls |
|---|---|---|
| v_input_1 | 9 | Conversion Line Periods |
| v_input_2 | 26 | Base Line Periods |
| v_input_3 | 52 | Lagging Span 2 Periods |
| v_input_4 | 26 | Displacement |
| v_input_5 | true | Use Parabolic SAR for Trailing Stop |
| v_input_6 | 0.02 | Parabolic SAR Start |
| v_input_7 | 0.02 | Parabolic SAR Increment |
| v_input_8 | 0.2 | Parabolic SAR Maximum |
Source Pine Script
/*backtest
start: 2023-01-01 00:00:00
end: 2023-01-16 00:00:00
period: 1h
basePeriod: 15m
exchanges: [{"eid":"Futures_Binance","currency":"BTC_USDT"}]
*/

//@version=3
//
//  Based on the trading strategy described at
//    http://stockcharts.com/school/doku.php?id=chart_school:trading_strategies:ichimoku_cloud
//
//  See Also:
//    - Backtesting and forwardtesting (of TradingView Strategies) <https://www.tradingview.com/wiki/Strategies#Backtesting_and_forwardtesting>
//    - 9 Mistakes Quants Make that Cause Backtests to Lie <https://blog.quantopian.com/9-mistakes-quants-make-that-cause-backtests-to-lie-by-tucker-balch-ph-d/>
//    - When Backtests Meet Reality <http://financial-hacker.com/Backtest.pdf>
//    - Why MT4 backtesting does not work <http://www.stevehopwoodforex.com/phpBB3/viewtopic.php?f=28&t=4020>
//
//
// -----------------------------------------------------------------------------
// Copyright 2018 sherwind
//
// This program is free software: you can redistribute it and/or modify
// it under the terms of the GNU General Public License as published by
// the Free Software Foundation, either version 3 of the License, or
// any later version.
//
// This program is distributed in the hope that it will be useful,
// but WITHOUT ANY WARRANTY; without even the implied warranty of
// MERCHANTABILITY or FITNESS FOR A PARTICULAR PURPOSE.  See the
// GNU General Public License for more details.
//
// The GNU General Public License can be found here
// <http://www.gnu.org/licenses/>.
//
// -----------------------------------------------------------------------------
//

strategy(title="Ichimoku Cloud Strategy", shorttitle="Ichimoku Strategy", overlay=true, pyramiding=3)

conversionPeriods   = input(9,  minval=1, title="Conversion Line Periods"),
basePeriods         = input(26, minval=1, title="Base Line Periods")
laggingSpan2Periods = input(52, minval=1, title="Lagging Span 2 Periods"),
displacement        = input(26, minval=1, title="Displacement")

usePSARTrailStop    = input(true, title="Use Parabolic SAR for Trailing Stop")
psarStart           = input(0.02, title="Parabolic SAR Start")
psarIncrement       = input(0.02, title="Parabolic SAR Increment")
psarMaximum         = input(0.2,  title="Parabolic SAR Maximum")


donchian(len) => avg(lowest(len), highest(len))

conversionLine = donchian(conversionPeriods)
baseLine  = donchian(basePeriods)
leadLine1 = avg(conversionLine, baseLine)
leadLine2 = donchian(laggingSpan2Periods)
leadLineDisp1 = leadLine1[displacement]
leadLineDisp2 = leadLine2[displacement]

psar = sar(psarStart, psarIncrement, psarMaximum)

// BUY Signal:
// close > leading span b and
// leading span a > leading span b and
// close crosses over base line and
// close > parabolic sar
buySignal = close > leadLineDisp2 and
  leadLineDisp1 > leadLineDisp2 and
  crossover(close, baseLine) and
  (usePSARTrailStop ? close > psar : not usePSARTrailStop)

// Sell Signal:
// close < leading span a and
// leading span a < leading span b and
// close crosses under base line and
// close < psar
sellSignal = close < leadLineDisp1 and
  leadLineDisp1 < leadLineDisp2 and
  crossunder(close, baseLine) and
  (usePSARTrailStop ? close < psar : not usePSARTrailStop)

hasLong  = strategy.position_size > 0
hasShort = strategy.position_size < 0


strategy.entry("ichimoku-long", strategy.long, when = buySignal)
strategy.entry("ichimoku-short", strategy.short, when = sellSignal)

strategy.exit("trailstop-long", "ichimoku-long", stop = psar, when = hasLong and usePSARTrailStop)
strategy.exit("trailstop-short", "ichimoku-short", stop = psar, when = hasShort and usePSARTrailStop)
Published by ChaoZhang on the FMZ strategy square · last modified 2023-10-16. Collected in the Quant Trading Vault. Unvalidated research: re-test with your own data and costs before trusting it.
Build this with AgenKit
A spec is not a trading system. Paste this into your coding agent and AgenKit runs a specialist team — architecture, test-first build, risk gates, review — with paper trading on by default.
/agenkit build a production-grade trading bot with a backtest engine, risk controls and paper trading by default from strategies/Ichimoku-Cloud-Day-Trading-Strategy.md- npx agenkit install engineering-kit in your project
- Paste the command into your agent and approve each phase
- Get tests, backtest, risk controls and a paper-trading switch
Understand it first
Before you run this, read the lesson behind the idea and how to backtest it honestly. Specs like this one are the survivors of an unknown number of trials; deflate their results accordingly.
Related specs
- Trend Following Strategy Based on Moving AveragesPine Script · Trend following · 1d
- Dual ATR Channel Trend Following StrategyPine Script · Trend following · 15m
- Triple Supertrend Ichimoku Cloud Quantitative Trading StrategyPine Script · Trend following · 1d
- A Strict Trend Following Strategy Based on Ichimoku Kinko HyoPine Script · Trend following · 30m
- ADX Based One Hour TENKAN KIJUN Cross Trend Tracking StrategyPine Script · Trend following · 1h
- Cloud based Trend Strategy Using Ichimoku CloudPine Script · Trend following · 1h