Linear Regression
ue to public demand Linear Regression Formula Scraped Calculation With Alerts Here is the Linear Regression Script For traders Who love rich features Features ++ Multi time frame - Source Regression from a different…
ue to public demand
Linear Regression Formula Scraped Calculation With Alerts
Here is the Linear Regression Script For traders Who love rich features
Features ++ Multi time frame -> Source Regression from a different Chart ++ Customized Colors -> This includes the pine lines ++ Smoothing -> Allow Filtered Regression; Note: Using 1 Defaults to the original line. The default is 1 ++ Alerts On Channel/Range Crossing
Usage ++ Use this for BreakOuts and Reversals ++ This Script is not to be used Independently
Risks Please note, this script is the likes of Bollinger bands and poses a risk of falling in a trend range. Signals may Keep running on the same direction while the market is reversing.
Requests If you have any feature requests, comment below or dm me. I will answer when i can. Feel free to utilize this on your chart and share your ideas
For developers who want to use this on their chart, Please use this script The original formula for calculation is posted there
❤❤❤ I hope you love this. From my heart! ❤❤❤
backtest
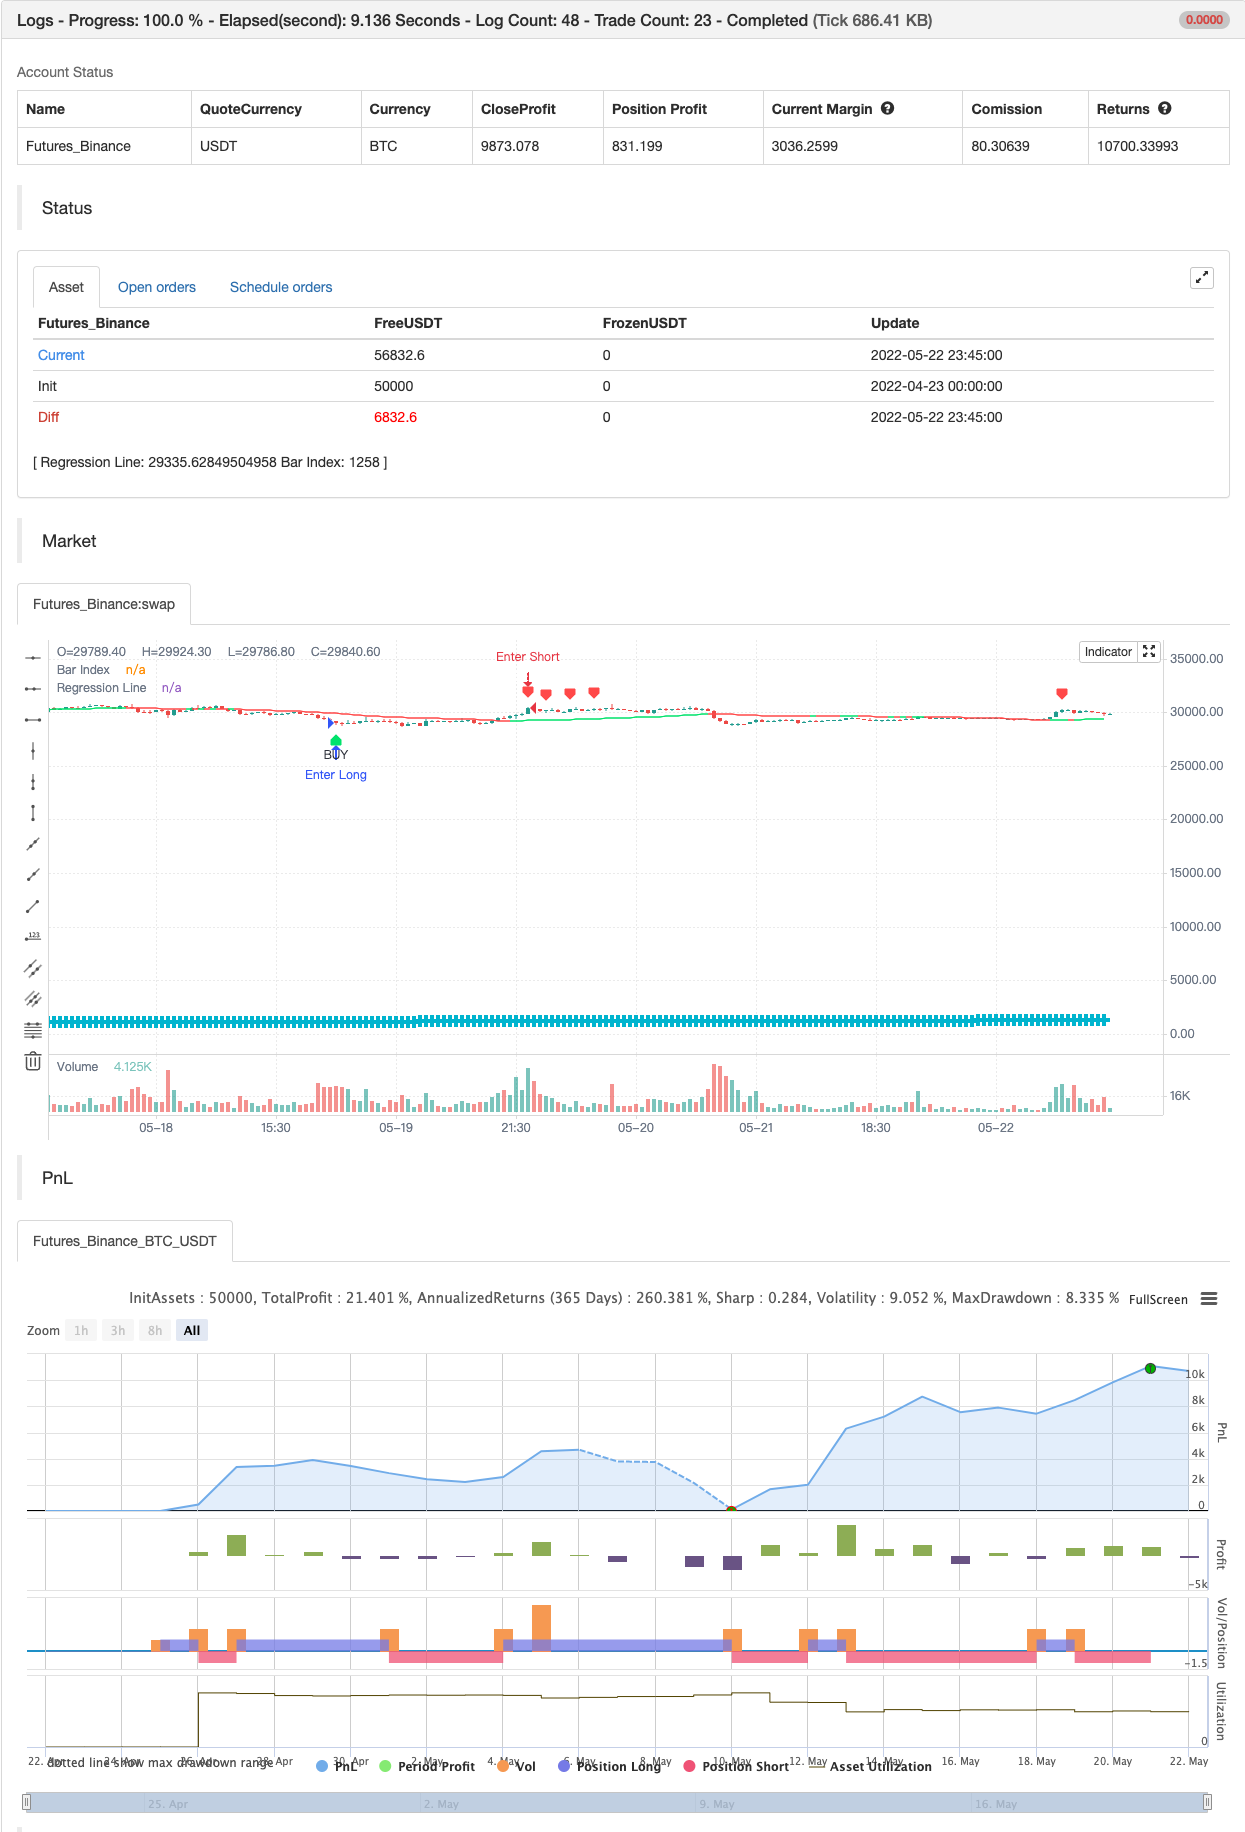
Parameters
| Name | Default | What it controls |
|---|---|---|
| v_input_1_close | 0 | source: close | high | low | open | hl2 | hlc3 | hlcc4 | ohlc4 |
| v_input_2 | 100 | length |
| v_input_3 | false | offset |
| v_input_4 | 2 | Deviation |
| v_input_5 | true | smoothing |
| v_input_6 | Resolution | |
| v_input_7 | 4 | S&R Thickness |
| v_input_8 | 0 | Signals Display: Recent | All |
| v_input_9 | 0 | Up Color: Lime | Red | Orange | Teal | Yellow | White | Black |
| v_input_10 | 0 | Down Color: Red | Lime | Orange | Teal | Yellow | White | Black |
| v_input_11 | false | End At Bar Index |
Source Pine Script
/*backtest
start: 2022-04-23 00:00:00
end: 2022-05-22 23:59:00
period: 45m
basePeriod: 5m
exchanges: [{"eid":"Futures_Binance","currency":"BTC_USDT"}]
*/

// This source code is subject to the terms of the Mozilla Public License 2.0 at https://mozilla.org/MPL/2.0/
// © LucemAnb
// User Version

//@version=4
study("Linear Regression ++ [Lucem Anb]", "Lin Reg ++ [Lucem Anb]", overlay=true)


source      = input(close)
length      = input(100, minval=1)
offset      = input(0, minval=0)
dev         = input(2.0, "Deviation")
smoothing   = input(1, minval=1)
mtf_val     = input("", "Resolution", input.resolution)
line_thick  = input(4, "S&R Thickness", minval=1, maxval=4)
signals     = input("Recent", "Signals Display", options=["Recent", "All"])
p           = input("Lime", "Up Color", options=["Red", "Lime", "Orange", "Teal", "Yellow", "White", "Black"])
q           = input("Red", "Down Color", options=["Red", "Lime", "Orange", "Teal", "Yellow", "White", "Black"])
goto        = input(0, "End At Bar Index")

cc(x) => x=="Red"?color.red:x=="Lime"?color.lime:x=="Orange"?color.orange:x=="Teal"?
 color.teal:x=="Yellow"?color.yellow:x=="Black"?color.black:color.white
data(x) => sma(security(syminfo.tickerid, mtf_val!="" ? mtf_val : timeframe.period, x), smoothing)

linreg = data(linreg(source, length, offset))
linreg_p = data(linreg(source, length, offset+1))
plot(linreg, "Regression Line", cc(linreg>linreg[1]?p:q), editable=false)

x = bar_index
slope = linreg - linreg_p
intercept = linreg - x*slope
deviationSum = 0.0
for i=0 to length-1
    deviationSum:= deviationSum + pow(source[i]-(slope*(x-i)+intercept), 2)
deviation = sqrt(deviationSum/(length))
x1 = x-length
x2 = x
y1 = slope*(x-length)+intercept
y2 = linreg

updating = goto <= 0 or x < goto


dm_current = -deviation*dev + y2
dp_current = deviation*dev + y2
buy = crossunder(close, dm_current)
sell = crossover(close, dp_current)
alertcondition(buy, "Buy Lin Reg", "Crossing On the Lower Regression Channel")
alertcondition(sell, "Sell Lin Reg", "Crossing On the Higher Regression Channel")

plotshape(buy, "BUY", shape.labelup, location.belowbar, color.lime, text='BUY', textcolor=color.black, show_last=signals=="All"?99999999:length)
plotshape(sell, "SELL", shape.labeldown, location.abovebar, color.red, text='SELL', textcolor=color.white, show_last=signals=="All"?99999999:length)

plot(x, "Bar Index", color.aqua, line_thick, plot.style_cross, display=display.none)

if buy
    strategy.entry("Enter Long", strategy.long)
else if sell
strategy.entry("Enter Short", strategy.short)Published by ChaoZhang on the FMZ strategy square · last modified 2022-05-24. Collected in the Quant Trading Vault. Unvalidated research: re-test with your own data and costs before trusting it.
Build this with AgenKit
A spec is not a trading system. Paste this into your coding agent and AgenKit runs a specialist team — architecture, test-first build, risk gates, review — with paper trading on by default.
/agenkit build a production-grade trading bot with a backtest engine, risk controls and paper trading by default from strategies/Linear-Regression.md- npx agenkit install engineering-kit in your project
- Paste the command into your agent and approve each phase
- Get tests, backtest, risk controls and a paper-trading switch
Understand it first
Before you run this, read the lesson behind the idea and how to backtest it honestly. Specs like this one are the survivors of an unknown number of trials; deflate their results accordingly.
Related specs
- Adaptive Bollinger Breakout with Moving Average Quantitative Strategy SystemPine Script · Breakout · 1h
- BB Breakout StrategyPine Script · Breakout · 1d
- Bollinger Band Breakout Trend Following StrategyPine Script · Breakout · 1d
- Bollinger Band Channel Breakout Trading StrategyPine Script · Breakout · 1d
- Bollinger Band T3 Moving Average StrategyPine Script · Breakout · 10m
- Bollinger Bands Breakout Trading StrategyPine Script · Breakout · 1h