Strategy vault / Trend following
Long term Moving Average Crossover Renko Strategy
This strategy is a moving average crossover strategy based on Renko candlestick charts. It uses the TEMA indicator to construct crossover signals and combines long-term moving averages for filtering, aiming to…
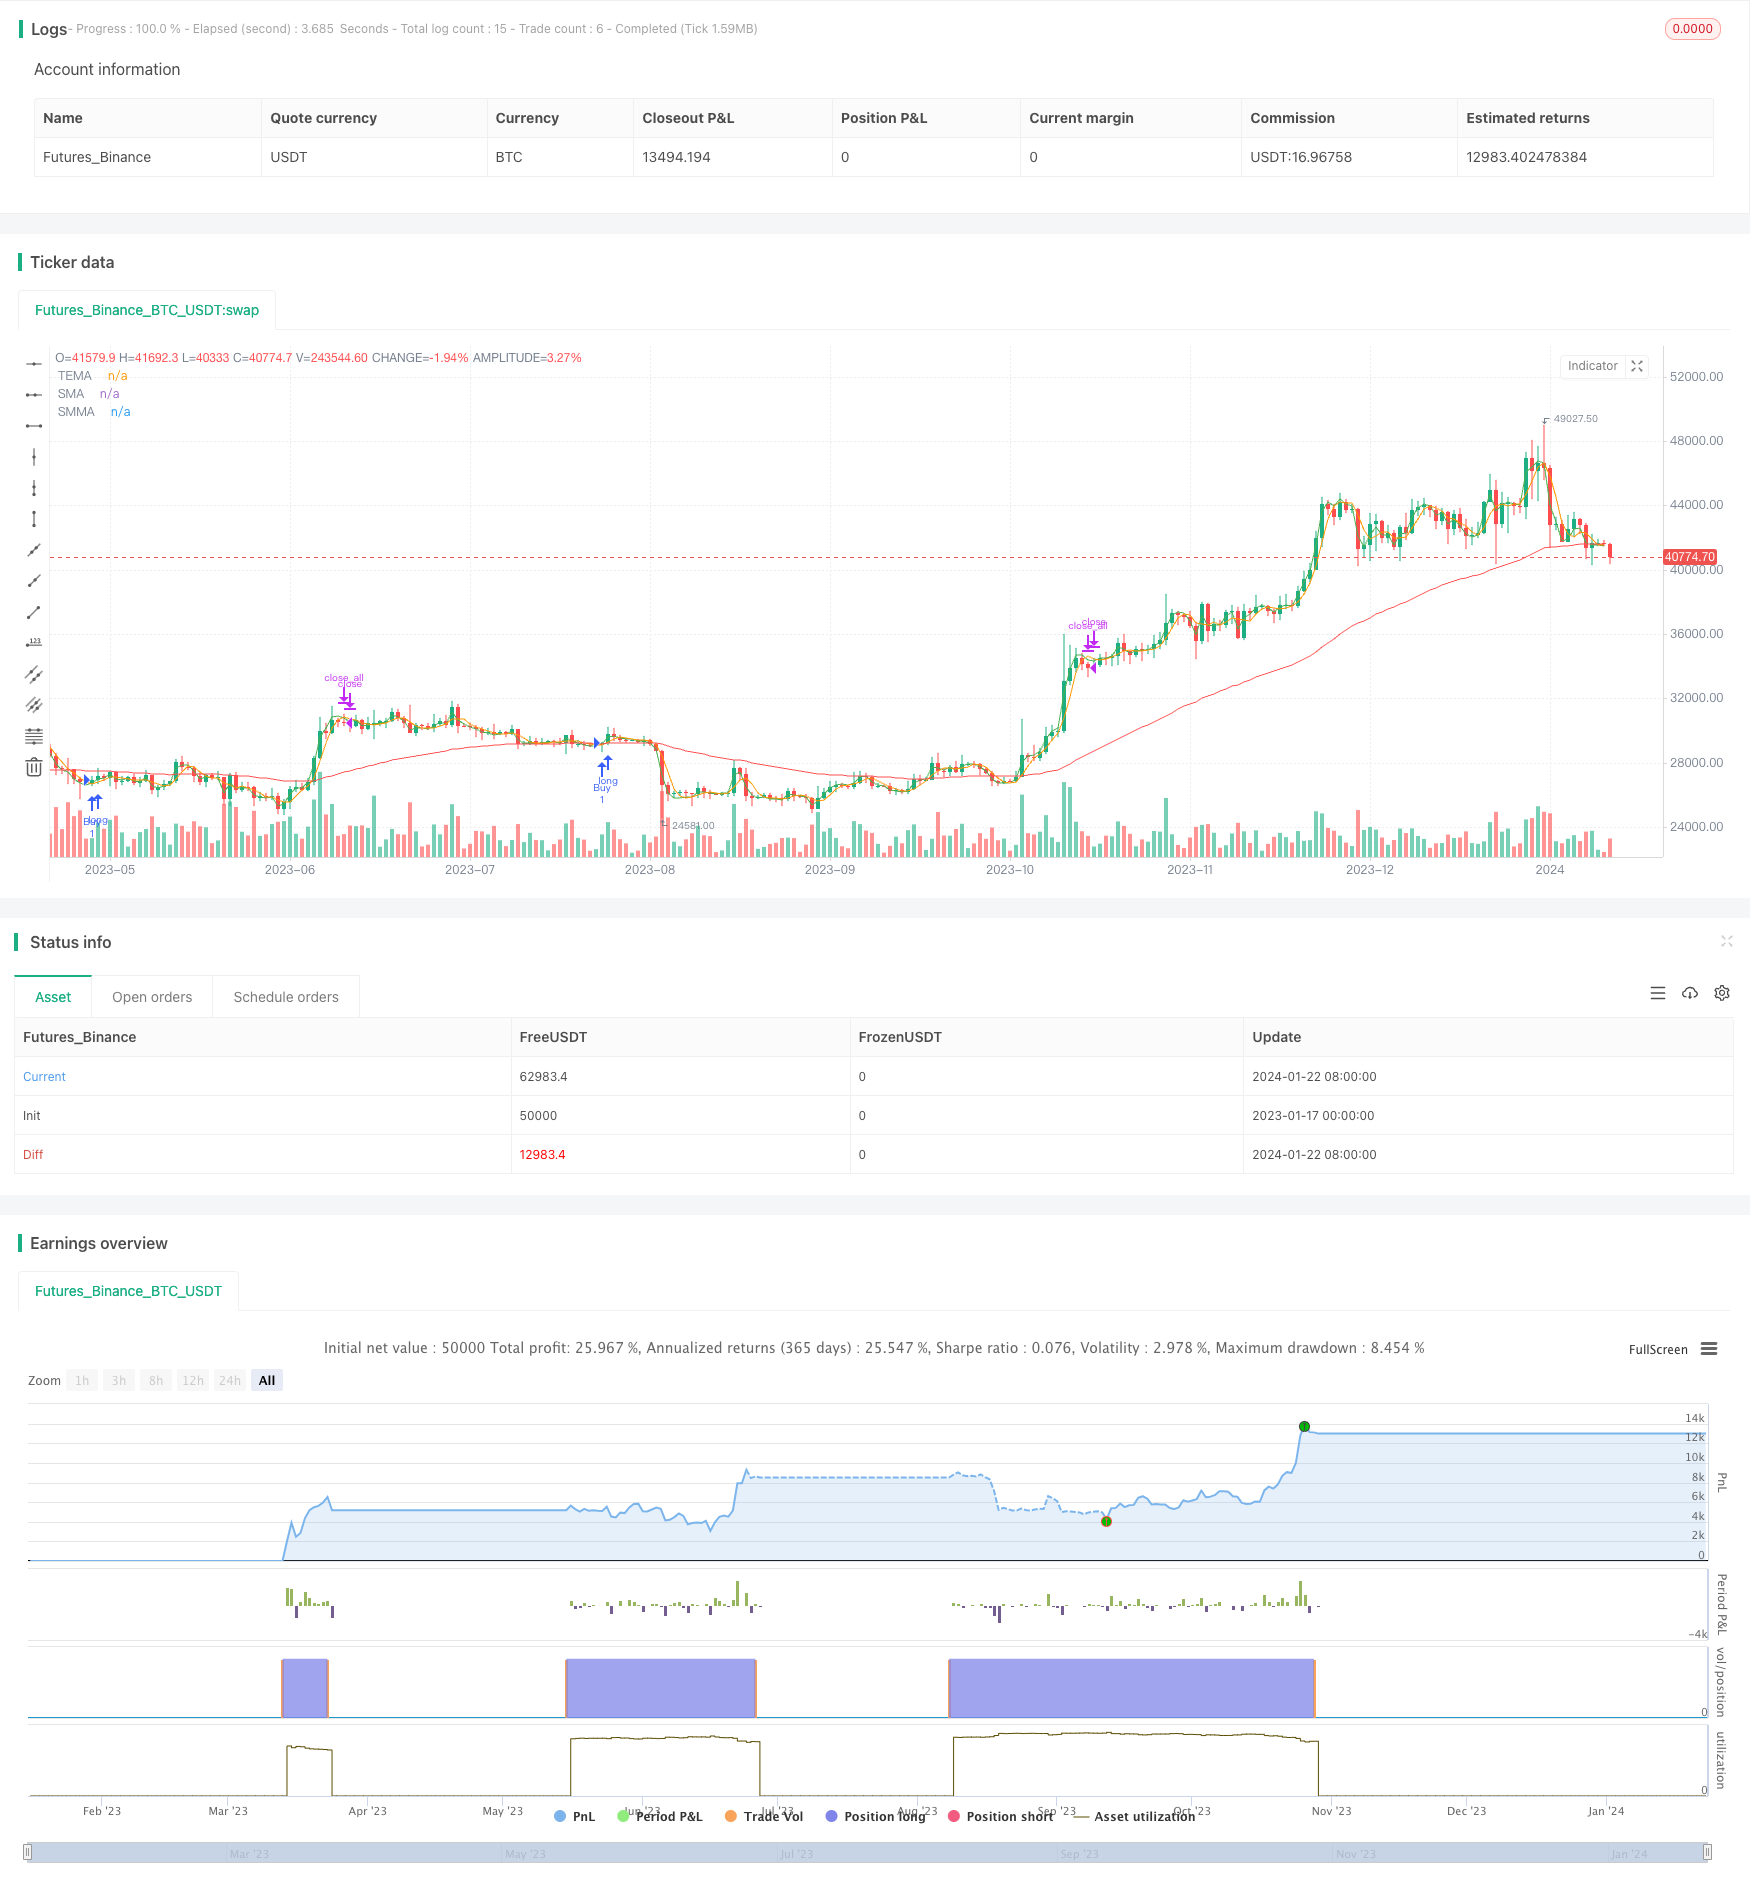
Overview
This strategy is a moving average crossover strategy based on Renko candlestick charts. It uses the TEMA indicator to construct crossover signals and combines long-term moving averages for filtering, aiming to identify trends on Renko charts and generate buy and sell signals.
Strategy Logic
The main signal source of this strategy comes from the golden cross and death cross of the short-term TEMA indicator and SMA indicator. Specifically, the logic is:
When the short-term TEMA crosses over the short-term SMA, go long; when the short-term TEMA crosses below the short-term SMA, close positions.
In addition, the strategy also sets two optional parameters avg_protection and gain_protection to adjust the entry and stop loss logic:
When avg_protection>0, only buy when the close price is lower than the current average holding price, which can reduce the cost basis;
When gain_protection>0, only sell when the close price exceeds the entry price by a certain percentage to lock in profits.
Finally, the strategy also uses a long-term SMMA indicator as a trend filter. Only when the close price is below SMMA will a long signal be triggered.
Advantage Analysis
The main advantages of this strategy are:
- Based on Renko candlestick charts, it can effectively filter out noise and identify trends;
- Use the TEMA indicator to construct signals with high sensitivity and tracking ability;
- The adjustable parameters are rich to control the entry strategy;
- The combination of long-term and short-term moving averages can capture opportunities in trends.
Risk Analysis
This strategy also has some risks:
- Renko itself has an uneven timeline that cannot control interval times;
- The high sensitivity of TEMA also leads to more false signals;
- Improper parameter settings may lead to missing trades.
To mitigate these risks, proper parameter tuning, setting stop losses etc. can be adopted.
Optimization Directions
The main optimization directions for this strategy are:
- Test different parameter combinations to find the optimal parameters;
- Add stop loss strategies such as trailing stop loss, range stop loss, etc. to reduce DD;
- Combine other indicators for signal filtering to reduce false signals;
- Test parameter effectiveness across different products.
Conclusion
In general, this is a basic, simple but highly practical moving average crossover strategy. It mainly relies on the excellent noise reduction effect of Renko bars and the high sensitivity of the TEMA indicator to generate signals. Meanwhile, the collaboration between long-term and short-term moving averages also enhances its trend following capability. With parameter tuning and proper optimization, this strategy can become an effective choice for quantitative trading.
Parameters
| Name | Default | What it controls |
|---|---|---|
| v_input_1 | 5 | temaLength |
| v_input_2 | 3 | smaLength |
| v_input_3 | 30 | smmaLength |
| v_input_4 | 2 | minGainPercent |
| v_input_5 | true | avg_protection |
| v_input_6 | true | gain_protection |
Source Pine Script
/*backtest
start: 2023-01-17 00:00:00
end: 2024-01-23 00:00:00
period: 1d
basePeriod: 1h
exchanges: [{"eid":"Futures_Binance","currency":"BTC_USDT"}]
*/

//@version=2
strategy("TEMA Cross", overlay = true)

tema(src, len) =>
    3*ema(src, len) - 3*ema(ema(src, len), len) + ema(ema(ema(src, len),len),len)

smma(src, len) =>
    sa = 0.0
    sa := na(sa[1]) ? sma(src, len) : (sa[1] * (len - 1) + src) / len
    sa

temaLength = input(5)
smaLength = input(3)
smmaLength = input(30)
tema1 = tema(close, temaLength)
sma1 = sma(tema1, smaLength)
smma1 = smma(close,smmaLength)


plot(tema1, color = green, title = "TEMA")
plot(sma1, color = orange, title = "SMA")
plot(smma1, color = red, title = "SMMA")
minGainPercent = input(2)
gainMultiplier = minGainPercent * 0.01 + 1

avg_protection = input(1)
gain_protection = input(1)

longCondition = crossover(tema1, sma1) and tema1 < smma1
shortCondition = crossunder(tema1, sma1)

strategy.entry("Buy", strategy.long, when = longCondition and (avg_protection >= 1 ? (na(strategy.position_avg_price) ? true : close <= strategy.position_avg_price) : true))
strategy.close_all(when = shortCondition and (gain_protection >=1 ? (close >= gainMultiplier * strategy.position_avg_price) : true))
Published by ChaoZhang on the FMZ strategy square · last modified 2024-01-24. Collected in the Quant Trading Vault. Unvalidated research: re-test with your own data and costs before trusting it.
Build this with AgenKit
A spec is not a trading system. Paste this into your coding agent and AgenKit runs a specialist team — architecture, test-first build, risk gates, review — with paper trading on by default.
/agenkit build a production-grade trading bot with a backtest engine, risk controls and paper trading by default from strategies/Long-term-Moving-Average-Crossover-Renko-Strategy.md- npx agenkit install engineering-kit in your project
- Paste the command into your agent and approve each phase
- Get tests, backtest, risk controls and a paper-trading switch
Understand it first
Before you run this, read the lesson behind the idea and how to backtest it honestly. Specs like this one are the survivors of an unknown number of trials; deflate their results accordingly.
Related specs
- ADX MA and EMA Long Only Trend Tracking StrategyPine Script · Trend following · 1d
- ATR and Moving Average Crossover Hybrid StrategyPine Script · Trend following · 1h
- Bollinger Band Moving Average Crossover StrategyPine Script · Trend following · 1h
- Bollinger Bands and EMA Trend Following StrategyPine Script · Trend following · 1h
- Bollinger Bands and RSI Trend Following StrategyPine Script · Trend following · 1h
- Candlestick Pattern Trend Filter StrategyPine Script · Trend following · 1d