Strategy vault / Trend following
Low Frequency Fourier Transform Trend Following Moving Average Strategy
This strategy is a trend following strategy that uses low frequency Fourier transform to extract the low frequency trend components from the price series and combines three moving averages (fast, medium and slow) to…
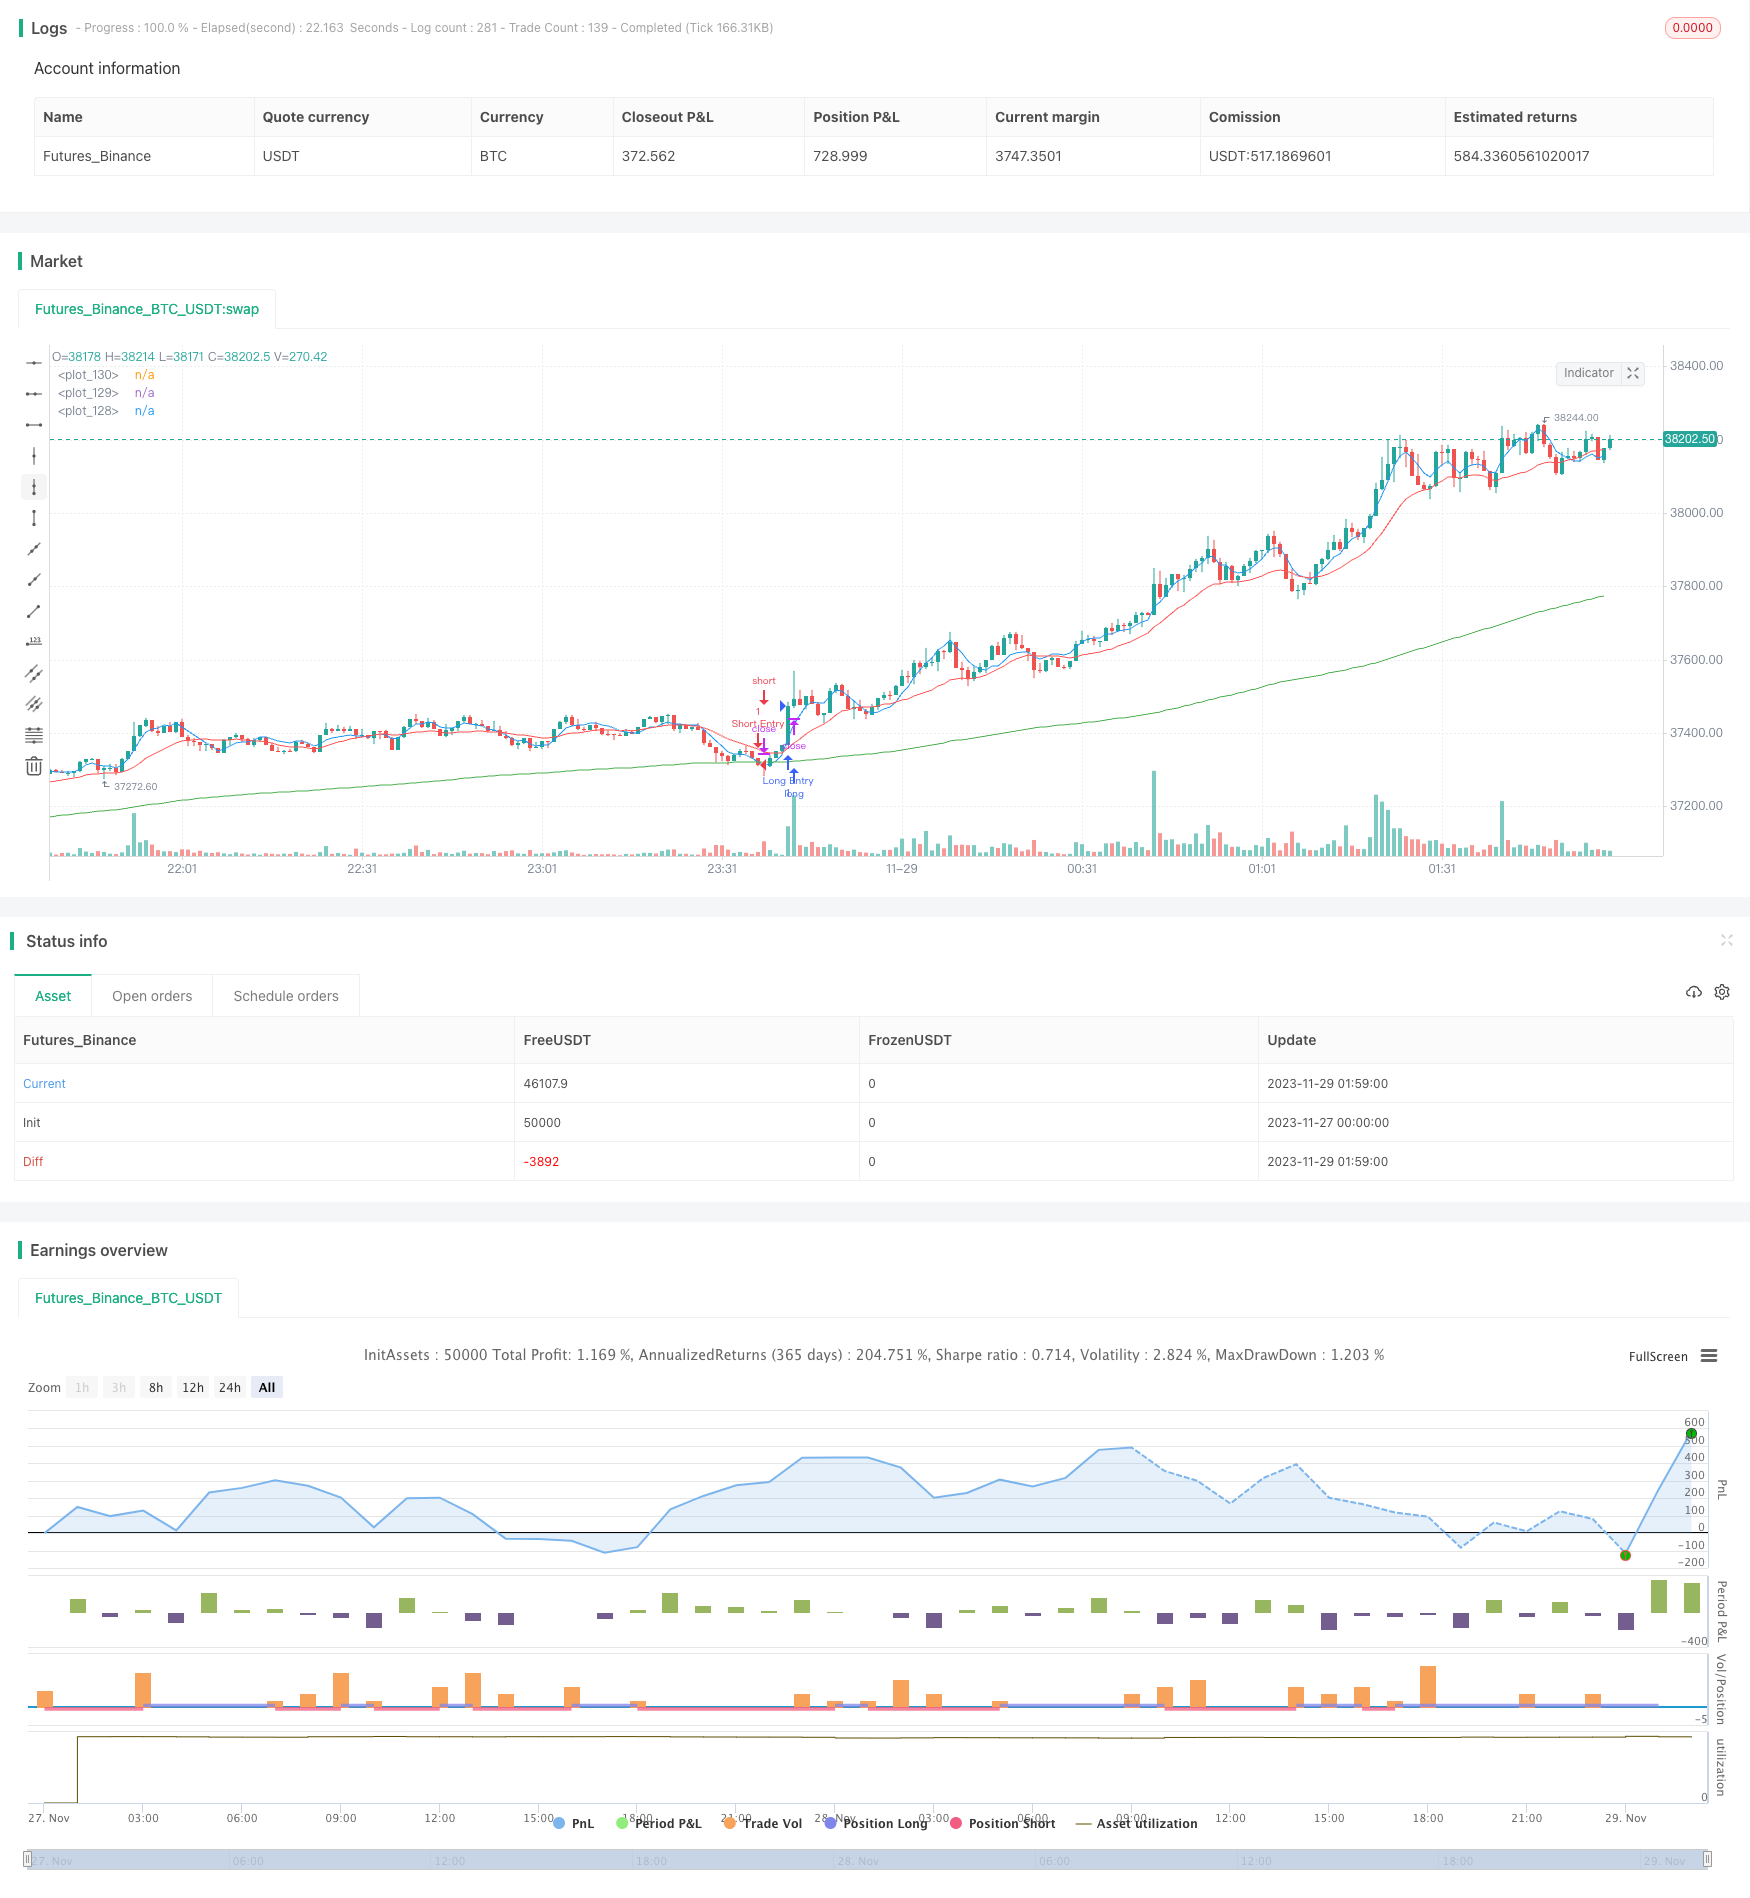
Overview
This strategy is a trend following strategy that uses low frequency Fourier transform to extract the low frequency trend components from the price series and combines three moving averages (fast, medium and slow) to identify trends and generate trading signals. It goes long when the fast MA crosses above the medium MA and the price is above the slow MA, and goes short when the fast MA crosses below the medium MA and the price is below the slow MA. This strategy is suitable for tracking medium- and long-term trends.
Strategy Logic
Use low frequency Fourier transform to extract the low frequency trend components from the price series. The low frequency Fourier transform can effectively filter out high frequency noise, making the extracted trend signals smoother.
Use three moving averages (fast, medium and slow) to judge trends. The slow MA has a period of 200, the medium MA has a period of 20, and the fast MA has a period of 5. The slow MA filters out noise, the medium MA captures trend reversals, and the fast MA generates trading signals.
When the fast MA crosses above the medium MA and the price is above the slow MA, the market is judged to be entering an upward trend, go long. When the fast MA crosses below the medium MA and the price is below the slow MA, the market is judged to be entering a downward trend, go short.
This is a trend following strategy. Once a trend is identified, it will try to hold the position as long as possible to profit from the trend.
Advantage Analysis
The use of low frequency Fourier transform effectively filters out high frequency noise, making the identified trend signals more reliable and stable.
The adoption of fast, medium and slow MAs effectively judges the reversal of market trends and avoids false signals. The large parameter setting of the slow MA effectively filters out noise.
This strategy has significant advantages in tracking medium- and long-term trends. Once a trend is identified, it will continue to add positions to track the trend, thus obtaining excess returns.
This strategy has large parameter optimization space. Users can adjust parameters according to different varieties and cycles to improve adaptability.
Risk Analysis
As a trend following strategy, this strategy cannot effectively determine and react to trend reversals caused by sudden events, which may lead to increased losses.
In oscillating markets, this strategy will generate more profitable and losing trades. But it can still be profitable eventually, requiring some psychological endurance.
Traditional trend following strategies tend to "dull", exiting trends prematurely is a problem that this strategy needs to solve.
Stop loss can be set to control single loss. Sudden event tests can also be included in backtesting to assess the risk resistance of the strategy.
Optimization Directions
Try different moving average algorithms to adapt more varieties and cycles.
Add stop loss, consecutive loss exit and other stop loss strategies to control risks.
Add trend strength indicators to avoid too many transactions in oscillating and weak trend markets.
Add machine learning models to judge trend reversals, making the strategy somewhat adaptive to sudden events.
Summary
This low frequency Fourier transform trend following moving average strategy has the advantages of filtering noise, identifying trends, and tracking trends. It is suitable for medium- and long-term holding. As a trend following strategy, it mainly faces the risks of trend reversal and sustained oscillation. There are coping strategies for these risks. In general, this strategy has large parameter space and high optimization potential. It is suitable for investors with certain strategy development and risk control capabilities to verify in live trading.
Parameters
| Name | Default | What it controls |
|---|---|---|
| v_input_1_close | 0 | Source: close | high | low | open | hl2 | hlc3 | hlcc4 | ohlc4 |
| v_input_2 | 200 | Slow MA period |
| v_input_3 | 20 | Mid MA period |
| v_input_4 | 5 | Fast MA period |
| v_input_5 | true | Use MA |
| v_input_6 | true | First sinusoid |
| v_input_7 | 2 | Second sinusoid |
| v_input_8 | 3 | Third sinusoid |
| v_input_9 | 0 | MA Type: EMA | SMA | ALMA | FRAMA | RMA | SWMA | VWMA | WMA | LinearRegression |
| v_input_10 | false | Use linear regression? |
| v_input_11 | 13 | Linear regression lenght |
| v_input_12 | false | Linear regression offset |
| v_input_13 | 0 | Lookback Period: 64 | 4 | 8 | 16 | 32 | 2 | 128 | 256 | 512 | 1024 | 2048 | 4096 |
| v_input_14 | false | Take Profit Points |
| v_input_15 | false | Stop Loss Points |
| v_input_16 | false | Trailing Stop Loss Points |
| v_input_17 | false | Trailing Stop Loss Offset Points |
Source Pine Script
/*backtest
start: 2023-11-27 00:00:00
end: 2023-11-29 02:00:00
period: 1m
basePeriod: 1m
exchanges: [{"eid":"Futures_Binance","currency":"BTC_USDT"}]
*/

// This source code is subject to the terms of the Mozilla Public License 2.0 at https://mozilla.org/MPL/2.0/
// © 03.freeman

//@version=4
strategy("FTSMA", overlay=true )
src=input(close,"Source")
slowMA=input(200,"Slow MA period")
mediumMA=input(20,"Mid MA period")
fastMA=input(5,"Fast MA period")
plotSMA=input(true,"Use MA")
sin1=input(1,"First sinusoid",minval=1)
sin2=input(2,"Second sinusoid",minval=1)
sin3=input(3,"Third sinusoid",minval=1)
smoothinput = input('EMA', title = "MA Type", options =['EMA', 'SMA', 'ALMA','FRAMA','RMA', 'SWMA', 'VWMA','WMA','LinearRegression'])
linearReg=input(false, "Use linear regression?")
linregLenght=input(13, "Linear regression lenght")
linregOffset=input(0, "Linear regression offset")

//------FRAMA ma---------
ma(src, len) =>
    float result = 0
    int len1 = len/2
    frama_SC=200
    frama_FC=1
    e = 2.7182818284590452353602874713527
    w = log(2/(frama_SC+1)) / log(e) // Natural logarithm (ln(2/(SC+1))) workaround
    H1 = highest(high,len1)
    L1 = lowest(low,len1)
    N1 = (H1-L1)/len1
    H2_ = highest(high,len1)
    H2 = H2_[len1]
    L2_ = lowest(low,len1)
    L2 = L2_[len1]
    N2 = (H2-L2)/len1
    H3 = highest(high,len)
    L3 = lowest(low,len)
    N3 = (H3-L3)/len
    dimen1 = (log(N1+N2)-log(N3))/log(2)
    dimen = iff(N1>0 and N2>0 and N3>0,dimen1,nz(dimen1[1]))
    alpha1 = exp(w*(dimen-1))
    oldalpha = alpha1>1?1:(alpha1<0.01?0.01:alpha1)
    oldN = (2-oldalpha)/oldalpha
    N = (((frama_SC-frama_FC)*(oldN-1))/(frama_SC-1))+frama_FC
    alpha_ = 2/(N+1)
    alpha = alpha_<2/(frama_SC+1)?2/(frama_SC+1):(alpha_>1?1:alpha_)
    frama = 0.0
    frama :=(1-alpha)*nz(frama[1]) + alpha*src
    result := frama
    result

// ----------MA calculation - ChartArt and modified by 03.freeman-------------
calc_ma(src,l) =>
    _ma = smoothinput=='SMA'?sma(src, l):smoothinput=='EMA'?ema(src, l):smoothinput=='WMA'?wma(src, l):smoothinput=='LinearRegression'?linreg(src, l,0):smoothinput=='VWMA'?vwma(src,l):smoothinput=='RMA'?rma(src, l):smoothinput=='ALMA'?alma(src,l,0.85,6):smoothinput=='SWMA'?swma(src):smoothinput=='FRAMA'?ma(sma(src,1),l):na

//----------------------------------------------


//pi = acos(-1)
// Approximation of Pi in _n terms --- thanks to e2e4mfck
f_pi(_n) =>
    _a = 1. / (4. * _n + 2)
    _b = 1. / (6. * _n + 3)
    _pi = 0.
    for _i = _n - 1 to 0
        _a := 1 / (4. * _i + 2) - _a / 4.
        _b := 1 / (6. * _i + 3) - _b / 9.
    _pi := (4. * _a) + (4. * _b) - _pi
pi=f_pi(20)

//---Thanks to xyse----https://www.tradingview.com/script/UTPOoabQ-Low-Frequency-Fourier-Transform/
//Declaration of user-defined variables
N = input(defval=64, title="Lookback Period", type=input.integer, minval=2, maxval=600, confirm=false, step=1, options=[2,4,8,16,32,64,128,256,512,1024,2048,4096])

//Real part of the Frequency Domain Representation
ReX(k) =>
    sum = 0.0
    for i=0 to N-1
        sum := sum + src[i]*cos(2*pi*k*i/N)
    return = sum

//Imaginary part of the Frequency Domain Representation
ImX(k) =>
    sum = 0.0
    for i=0 to N-1
        sum := sum + src[i]*sin(2*pi*k*i/N)
    return = -sum

//Get sinusoidal amplitude from frequency domain
ReX_(k) =>
    case = 0.0
    if(k!=0 and k!=N/2)
        case := 2*ReX(k)/N
    if(k==0)
        case := ReX(k)/N
    if(k==N/2)
        case := ReX(k)/N
    return = case

 //Get sinusoidal amplitude from frequency domain
ImX_(k) =>
    return = -2*ImX(k)/N

//Get full Fourier Transform
x(i, N) =>
    sum1 = 0.0
    sum2 = 0.0
    for k=0 to N/2
        sum1 := sum1 + ReX_(k)*cos(2*pi*k*i/N)
    for k=0 to N/2
        sum2 := sum2 + ImX_(k)*sin(2*pi*k*i/N)
    return = sum1+sum2

//Get single constituent sinusoid
sx(i, k) =>
    sum1 = ReX_(k)*cos(2*pi*k*i/N)
    sum2 = ImX_(k)*sin(2*pi*k*i/N)
    return = sum1+sum2
//Calculations for strategy
SLOWMA = plotSMA?calc_ma(close+sx(0,sin1),slowMA):close+sx(0,sin1)
MEDMA = plotSMA?calc_ma(close+sx(0,sin2),mediumMA):close+sx(0,sin2)
FASTMA = plotSMA?calc_ma(close+sx(0,sin3),fastMA):close+sx(0,sin3)

SLOWMA := linearReg?linreg(SLOWMA,linregLenght,linregOffset):SLOWMA
MEDMA := linearReg?linreg(MEDMA,linregLenght,linregOffset):MEDMA
FASTMA := linearReg?linreg(FASTMA,linregLenght,linregOffset):FASTMA

//Plot 3 Low-Freq Sinusoids
plot(SLOWMA, color=color.green)
plot(MEDMA, color=color.red)
plot(FASTMA, color=color.blue)

//  Strategy: (Thanks to JayRogers)
// === STRATEGY RELATED INPUTS ===
// the risk management inputs
inpTakeProfit   = input(defval = 0, title = "Take Profit Points", minval = 0)
inpStopLoss     = input(defval = 0, title = "Stop Loss Points", minval = 0)
inpTrailStop    = input(defval = 0, title = "Trailing Stop Loss Points", minval = 0)
inpTrailOffset  = input(defval = 0, title = "Trailing Stop Loss Offset Points", minval = 0)

// === RISK MANAGEMENT VALUE PREP ===
// if an input is less than 1, assuming not wanted so we assign 'na' value to disable it.
useTakeProfit   = inpTakeProfit  >= 1 ? inpTakeProfit  : na
useStopLoss     = inpStopLoss    >= 1 ? inpStopLoss    : na
useTrailStop    = inpTrailStop   >= 1 ? inpTrailStop   : na
useTrailOffset  = inpTrailOffset >= 1 ? inpTrailOffset : na

longCondition = FASTMA>MEDMA and close > SLOWMA             //crossover(FASTMA, MEDMA) and close > SLOWMA
if (longCondition)
    strategy.entry("Long Entry", strategy.long)

shortCondition = FASTMA<MEDMA and close < SLOWMA            //crossunder(FASTMA, MEDMA) and close < SLOWMA
if (shortCondition)
    strategy.entry("Short Entry", strategy.short)

// === STRATEGY RISK MANAGEMENT EXECUTION ===
// finally, make use of all the earlier values we got prepped
strategy.exit("Exit Buy", from_entry = "Long Entry", profit = useTakeProfit, loss = useStopLoss, trail_points = useTrailStop, trail_offset = useTrailOffset)
strategy.exit("Exit Sell", from_entry = "Short Entry", profit = useTakeProfit, loss = useStopLoss, trail_points = useTrailStop, trail_offset = useTrailOffset)Published by ChaoZhang on the FMZ strategy square · last modified 2023-12-05. Collected in the Quant Trading Vault. Unvalidated research: re-test with your own data and costs before trusting it.
Build this with AgenKit
A spec is not a trading system. Paste this into your coding agent and AgenKit runs a specialist team — architecture, test-first build, risk gates, review — with paper trading on by default.
/agenkit build a production-grade trading bot with a backtest engine, risk controls and paper trading by default from strategies/Low-Frequency-Fourier-Transform-Trend-Following-Moving-Average-Strategy.md- npx agenkit install engineering-kit in your project
- Paste the command into your agent and approve each phase
- Get tests, backtest, risk controls and a paper-trading switch
Understand it first
Before you run this, read the lesson behind the idea and how to backtest it honestly. Specs like this one are the survivors of an unknown number of trials; deflate their results accordingly.
Related specs
- ADX MA and EMA Long Only Trend Tracking StrategyPine Script · Trend following · 1d
- ATR and Moving Average Crossover Hybrid StrategyPine Script · Trend following · 1h
- Bollinger Band Moving Average Crossover StrategyPine Script · Trend following · 1h
- Bollinger Bands and EMA Trend Following StrategyPine Script · Trend following · 1h
- Bollinger Bands and RSI Trend Following StrategyPine Script · Trend following · 1h
- Candlestick Pattern Trend Filter StrategyPine Script · Trend following · 1d