MACD Closing Turtle Hybrid Strategy
This strategy combines the MACD indicator's golden cross and dead cross signals, the closing price's relationship with the median line, and price volatility characteristics to determine entry and exit points. It also…
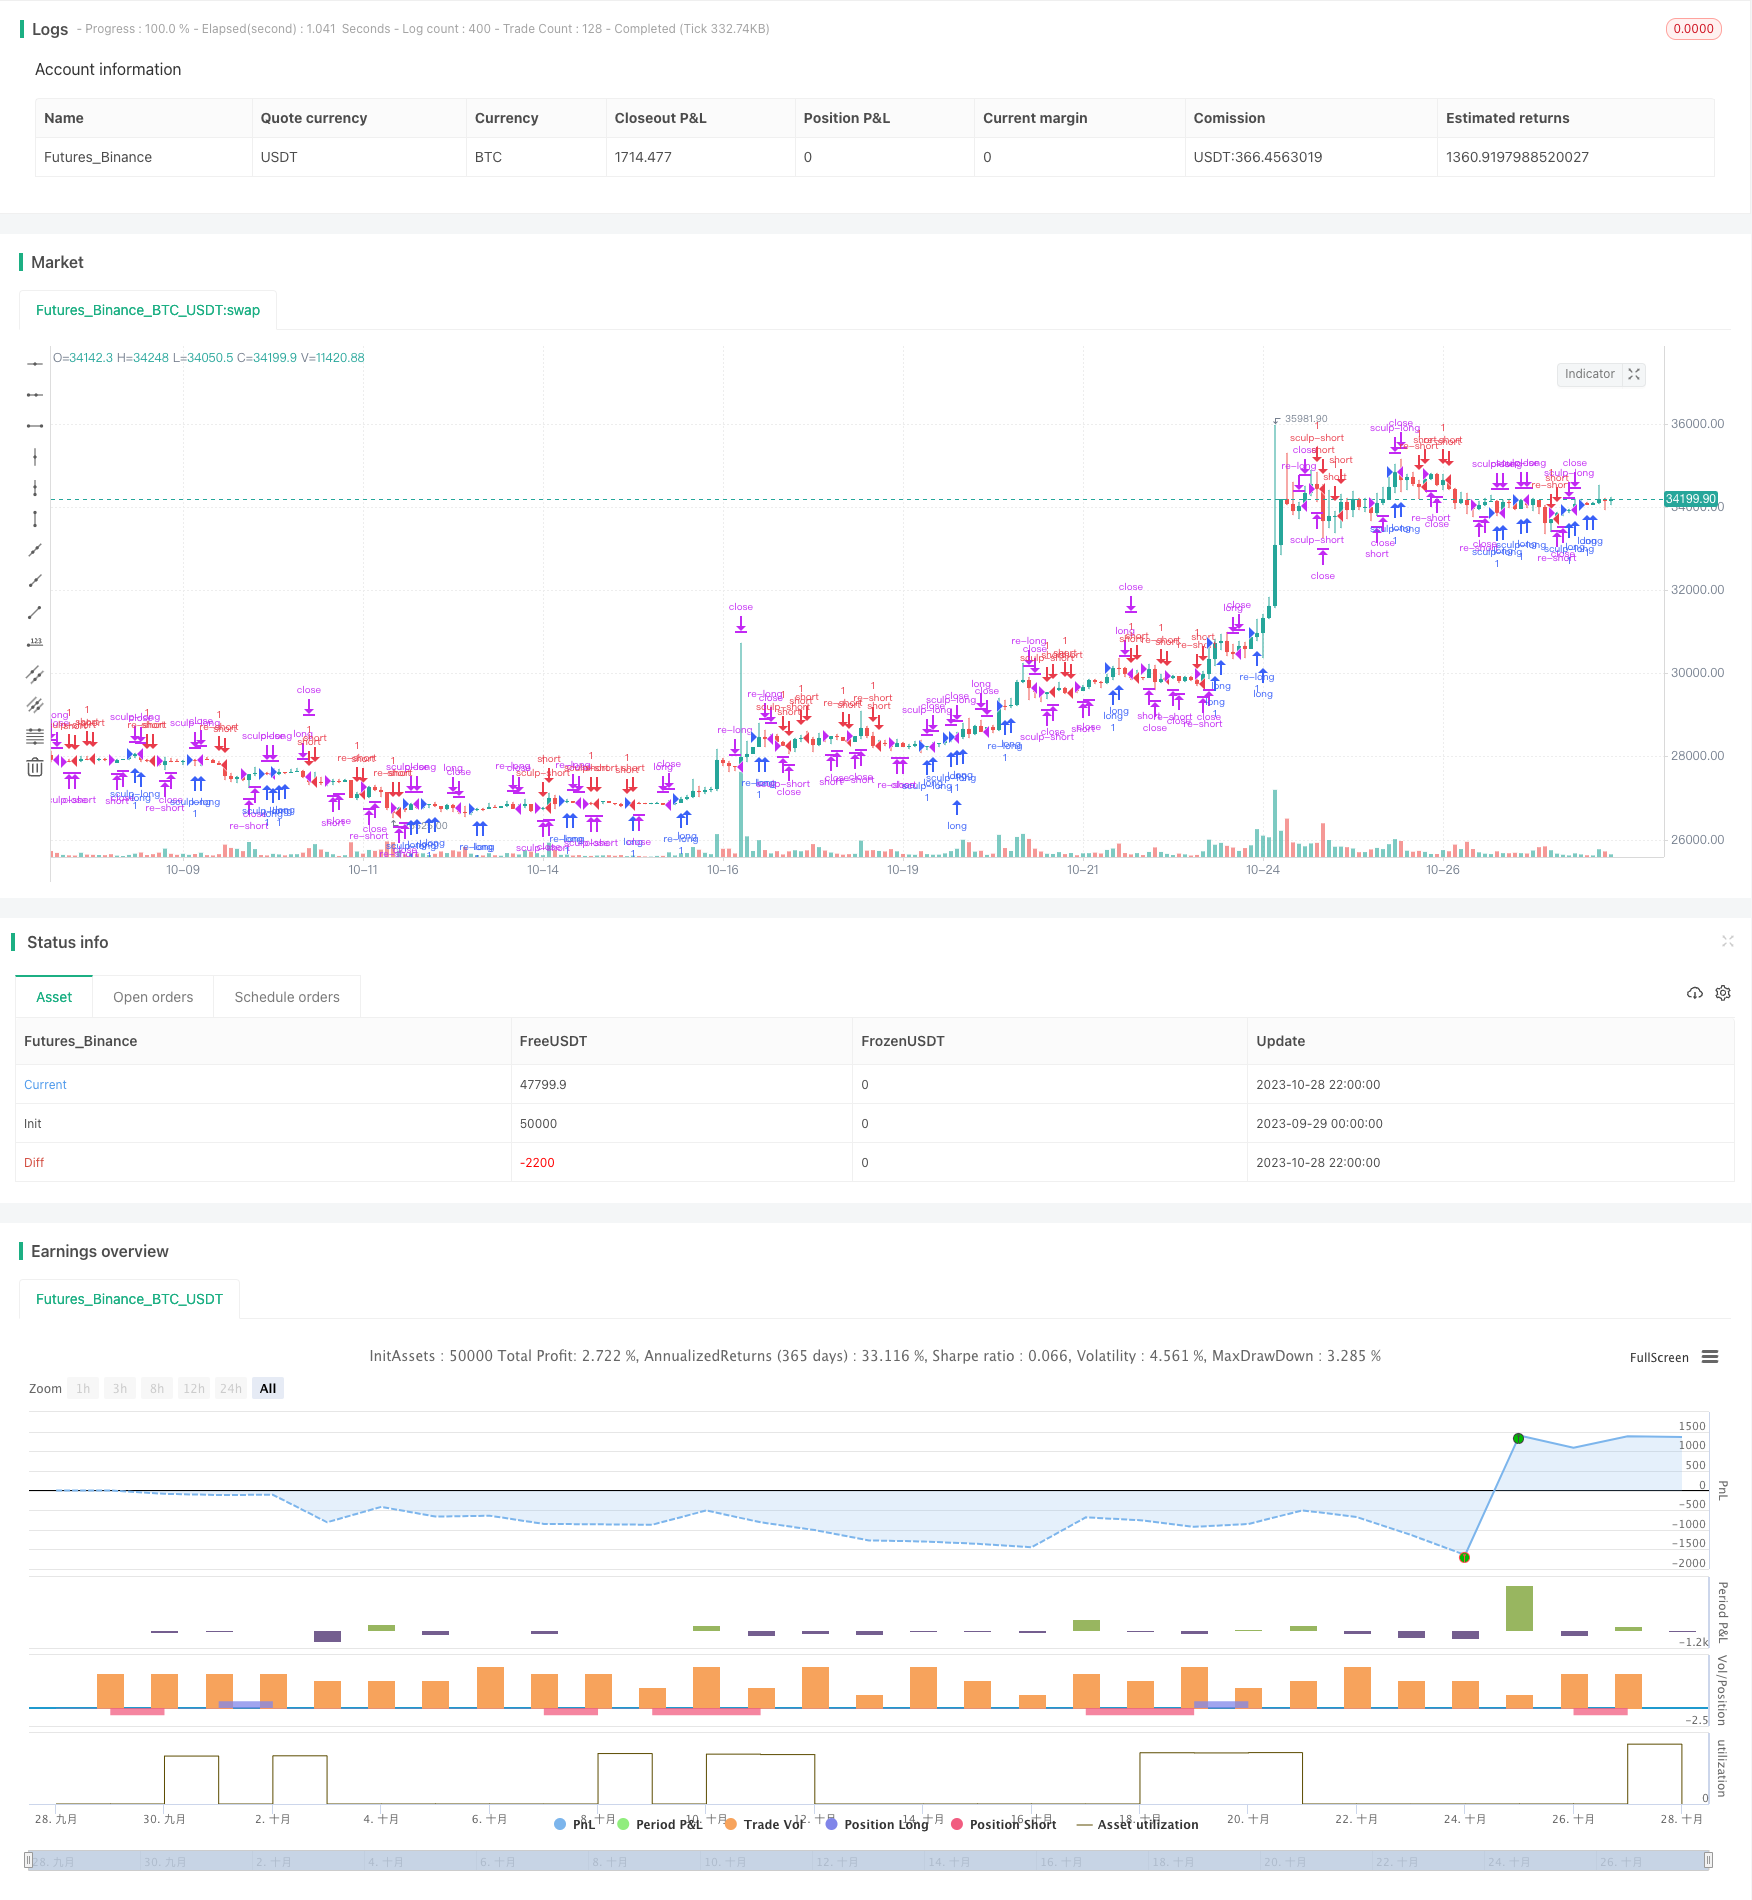
Overview
This strategy combines the MACD indicator's golden cross and dead cross signals, the closing price's relationship with the median line, and price volatility characteristics to determine entry and exit points. It also sets re-entry and correction entry mechanisms to gain more trading opportunities while controlling risks and realizing steady returns.
Strategy Principles
The strategy is mainly based on the following principles:
Use MACD fast line and slow line golden cross and dead cross to determine bull and bear markets and specific entry points.
Use the closing price's relationship with the median line to determine the end of trends and exit points.
Set re-entry mechanism to re-enter the market in the same direction after the end of the current MACD trend to increase profit.
Set correction entry mechanism to add positions during partial price corrections within a trend.
Dynamically adjust positions based on the above to maximize profits within trends while exiting quickly when the trend ends.
Specifically, the strategy first checks if a golden cross or dead cross occurs between the MACD fast and slow lines to go long or short. It then checks if the closing price touches the median line to determine the end of the trend and close positions.
In addition, the strategy has a re-entry mechanism to re-open positions in the original direction if MACD continues to show signals in the same direction after the initial trend ends. There is also a correction entry mechanism to moderately add positions during small pullbacks before full reversals.
Through these settings, the strategy can dynamically adjust positions, increase entry and exit frequencies, and maximize returns while controlling risks within trends.
Advantages
The main advantages of this multi-indicator strategy are:
MACD identifies trends and reversal points for entry.
Closing price and median line relationship accurately determines trend end.
Re-entry increases capital utilization efficiency.
Correction entry timely adds positions to capture trends.
High trade frequency with controllable risk yields high profit factors.
Customizable parameters for optimization across products and markets.
Clear logic and concise code for easy live trading.
Sufficient backtest data ensures reliability.
Risks
The main risks are:
Probability of false MACD signals needs verification with other indicators.
Stops that are too tight may get stopped out by volatile moves.
Increased trade frequency requires controlling capital utilization.
Correction entries can cause losses during pullbacks.
Optimization required for different products and markets.
Requires ongoing backtesting and optimization.
Slippage costs need consideration for live trading.
Risk management measures include using stops to limit losses, evaluating capital utilization, optimizing parameters per product via backtesting, monitoring market dynamics to refine parameters, and accounting for slippage in tests.
Enhancement Opportunities
Enhancement opportunities:
Add other indicators to verify signals, e.g. KDJ.
Implement adaptive dynamic stops.
Optimize re-entry and correction entry logic.
Parameter optimization per product.
Optimize capital utilization for entries.
Incorporate volume indicators to avoid losses from pullback entries.
Add exit mechanisms like moving stops.
Build automated trading bot.
Account for real-world factors like slippage.
These can further improve stability, adaptability, automation, and live performance.
Conclusion
This strategy integrates MACD signals, closing price analysis, and multiple entry mechanisms to maximize trends while controlling risk. It has high capital efficiency and ease of implementation but requires risk control and optimization. Automation can make it a robust quantitative trading system.
Parameters
| Name | Default | What it controls |
|---|---|---|
| v_input_1 | 2 | Re-enter Delay |
| v_input_2 | 4 | Sculp Delay |
| v_input_3 | 12 | Fast Length |
| v_input_4 | 26 | Slow Length |
| v_input_5_close | 0 | Source: close | high | low | open | hl2 | hlc3 | hlcc4 | ohlc4 |
| v_input_6 | 9 | Signal Smoothing |
| v_input_7 | false | Simple MA(Oscillator) |
| v_input_8 | true | Simple MA(Signal Line) |
| v_input_9 | 21 | EMA Period |
| v_input_10 | 19 | Start Date |
| v_input_11 | 9 | Start Month |
| v_input_12 | 2017 | Start Year |
| v_input_13 | 31 | End Date |
| v_input_14 | 3 | End Month |
| v_input_15 | 2021 | End Year |
Source Pine Script
/*backtest
start: 2023-09-29 00:00:00
end: 2023-10-29 00:00:00
period: 2h
basePeriod: 15m
exchanges: [{"eid":"Futures_Binance","currency":"BTC_USDT"}]
*/

// This source code is subject to the terms of the Mozilla Public License 2.0 at https://mozilla.org/MPL/2.0/
// © Puckapao

//@version=4
// strategy(title="MACD", shorttitle="MACD", overlay=true, initial_capital=10000.00, currency="USD", default_qty_type=strategy.cash, default_qty_value=10000.00)
// Getting inputs
reenter_delay = input(title="Re-enter Delay", type=input.integer, defval=2)
sculp_delay = input(title="Sculp Delay", type=input.integer, defval=4)
fast_length = input(title="Fast Length", type=input.integer, defval=12)
slow_length = input(title="Slow Length", type=input.integer, defval=26)
src = input(title="Source", type=input.source, defval=close)
signal_length = input(title="Signal Smoothing", type=input.integer, minval = 1, maxval = 50, defval = 9)
sma_source = input(title="Simple MA(Oscillator)", type=input.bool, defval=false)
sma_signal = input(title="Simple MA(Signal Line)", type=input.bool, defval=true)
ema_period = input(title="EMA Period", type=input.integer, defval=21)

// Get date
startDate = input(title="Start Date", type=input.integer,
     defval=19, minval=1, maxval=31)
startMonth = input(title="Start Month", type=input.integer,
     defval=09, minval=1, maxval=12)
startYear = input(title="Start Year", type=input.integer,
     defval=2017, minval=1800, maxval=2100)

endDate = input(title="End Date", type=input.integer,
     defval=31, minval=1, maxval=31)
endMonth = input(title="End Month", type=input.integer,
     defval=3, minval=1, maxval=12)
endYear = input(title="End Year", type=input.integer,
     defval=2021, minval=1800, maxval=2100)

// STEP 2:
// Look if the close time of the current bar
// falls inside the date range
inDateRange =  true

reenter_cnt = 0
reenter_cnt := nz(reenter_cnt[1])

sculp_cnt = 0
sculp_cnt := nz(sculp_cnt[1])

close_cnt = 0
close_cnt := nz(close_cnt[1])

on_long = false
on_long := nz(on_long[1])

on_short = false
on_short := nz(on_short[1])

sculp = false
reenter = false
slowdown = false

ema = ema(close, ema_period)

// Plot colors
col_grow_above = #26A69A
col_grow_below = #FFCDD2
col_fall_above = #B2DFDB
col_fall_below = #EF5350
col_macd = #0094ff
col_signal = #ff6a00
// Calculating
fast_ma = sma_source ? sma(src, fast_length) : ema(src, fast_length)
slow_ma = sma_source ? sma(src, slow_length) : ema(src, slow_length)
macd = fast_ma - slow_ma
signal = sma_signal ? sma(macd, signal_length) : ema(macd, signal_length)
hist = macd - signal
// plot(hist, title="Histogram", style=plot.style_columns, color=(hist>=0 ? (hist[1] < hist ? col_grow_above : col_fall_above) : (hist[1] < hist ? col_grow_below : col_fall_below) ), transp=0 )
// plot(macd, title="MACD", color=col_macd, transp=0)
// plot(signal, title="Signal", color=col_signal, transp=0)

cross_up = crossover(macd, signal)
cross_down = crossunder(macd, signal)

if (inDateRange)

    over_macd = macd > 0 and signal > 0 ? true : false
    under_macd = macd < 0 and signal < 0 ? true : false
    over_water = close > ema ? true : false
    under_water = close < ema ? true : false
    slowdown := hist >= 0 ? (hist[1] > hist ? true : false) : (hist[1] > hist ? false : true)
    reenter := hist >= 0 ? (hist[1] < hist ? true : false) : (hist[1] > hist ? true : false)
    sculp := (hist >= 0 ? (hist[1] > hist ? true : false) : (hist[1] < hist ? true : false))

    if(reenter == true)
        if(reenter_cnt < reenter_delay)
            reenter_cnt := reenter_cnt + 1
    else
        if(reenter_cnt > 0)
            reenter_cnt := reenter_cnt - 1

    if(sculp == true)
        if(sculp_cnt < sculp_delay)
            sculp_cnt := sculp_cnt + 1
    else
        if(sculp_cnt > 0)
            sculp_cnt := sculp_cnt - 1

    if(slowdown == false)
        if(close_cnt < 2)
            close_cnt := close_cnt + 1
        else
            close_cnt := 0

    // plotchar(fork_cnt, "fork count", "")
    // plotchar(spoon_cnt, "spoon count", "")

    // Entry
    if (cross_up == true)
        strategy.entry("long", strategy.long, comment = "long", alert_message = "long")
        on_long := true
        on_short := false
    if (cross_down == true)
        strategy.entry("short", strategy.short, comment = "short", alert_message = "short")
        on_short := true
        on_long := false

    // Sculp bottom / top
    if (sculp == true and sculp_cnt >= sculp_delay)
        if (hist >= 0)
            strategy.entry("sculp-short", strategy.short, comment = "sculp-short", alert_message = "sculp-short")
        else
            strategy.entry("sculp-long", strategy.long, comment = "sculp-long", alert_message = "sculp-long")

        sculp_cnt := 0
        sculp := false

    // Re-Entry
    if (reenter == true and reenter_cnt >= reenter_delay)
        if (hist >= 0)
            strategy.entry("re-long", strategy.long, comment = "re-long", alert_message = "re-long")
        else
            strategy.entry("re-short", strategy.short, comment = "re-short", alert_message = "re-short")

        reenter_cnt := 0
        reenter := false

    // Close
    strategy.close("long", when = slowdown, comment = "close long", alert_message = "close long")
    strategy.close("short", when = slowdown, comment = "close short", alert_message = "close short")
    strategy.close("re-long", when = slowdown, comment = "close re-long", alert_message = "close re-long")
    strategy.close("re-short", when = slowdown, comment = "close re-short", alert_message = "close re-short")
    strategy.close("sculp-long", when = slowdown, comment = "close sculp-long", alert_message = "close sculp-long")
    strategy.close("sculp-short", when = slowdown, comment = "close sculp-short", alert_message = "close sculp-short")

    if (slowdown)
        if (hist >= 0)
            on_long := false
        else
            on_short := false


plotchar(slowdown, "close", "")
plotchar(reenter, "reenter", "")
plotchar(reenter_cnt, "reenter count", "")
plotchar(sculp, "sculp", "")
plotchar(sculp_cnt, "sculp count", "")Published by ChaoZhang on the FMZ strategy square · last modified 2023-10-30. Collected in the Quant Trading Vault. Unvalidated research: re-test with your own data and costs before trusting it.
Build this with AgenKit
A spec is not a trading system. Paste this into your coding agent and AgenKit runs a specialist team — architecture, test-first build, risk gates, review — with paper trading on by default.
/agenkit build a production-grade trading bot with a backtest engine, risk controls and paper trading by default from strategies/MACD-Closing-Turtle-Hybrid-Strategy.md- npx agenkit install engineering-kit in your project
- Paste the command into your agent and approve each phase
- Get tests, backtest, risk controls and a paper-trading switch
Understand it first
Before you run this, read the lesson behind the idea and how to backtest it honestly. Specs like this one are the survivors of an unknown number of trials; deflate their results accordingly.
Related specs
- Bull Market Tracking SystemPine Script · Breakout · 1h
- Dual Breakout Volatility Channel StrategyPine Script · Breakout · 1h
- EMA MACD Quantitative Strategy With Dual Track Running and Leading the Market IndexPine Script · Breakout · 1d
- Kana Candle Breakout Strategy Based on Moving Average and Support ResistancePine Script · Breakout · 1h
- Momentum Breakout Moving Average StrategyPine Script · Breakout · 1d
- Momentum Breakout Trading Strategy 440964Pine Script · Breakout · 5m