MACD Dual Moving Average Tracking Strategy
This strategy is named MACD Dual Moving Average Tracking Strategy . It uses MACD indicator's golden cross and death cross of dual moving averages as trading signals, combined with the previous day's lowest price as…
Overview
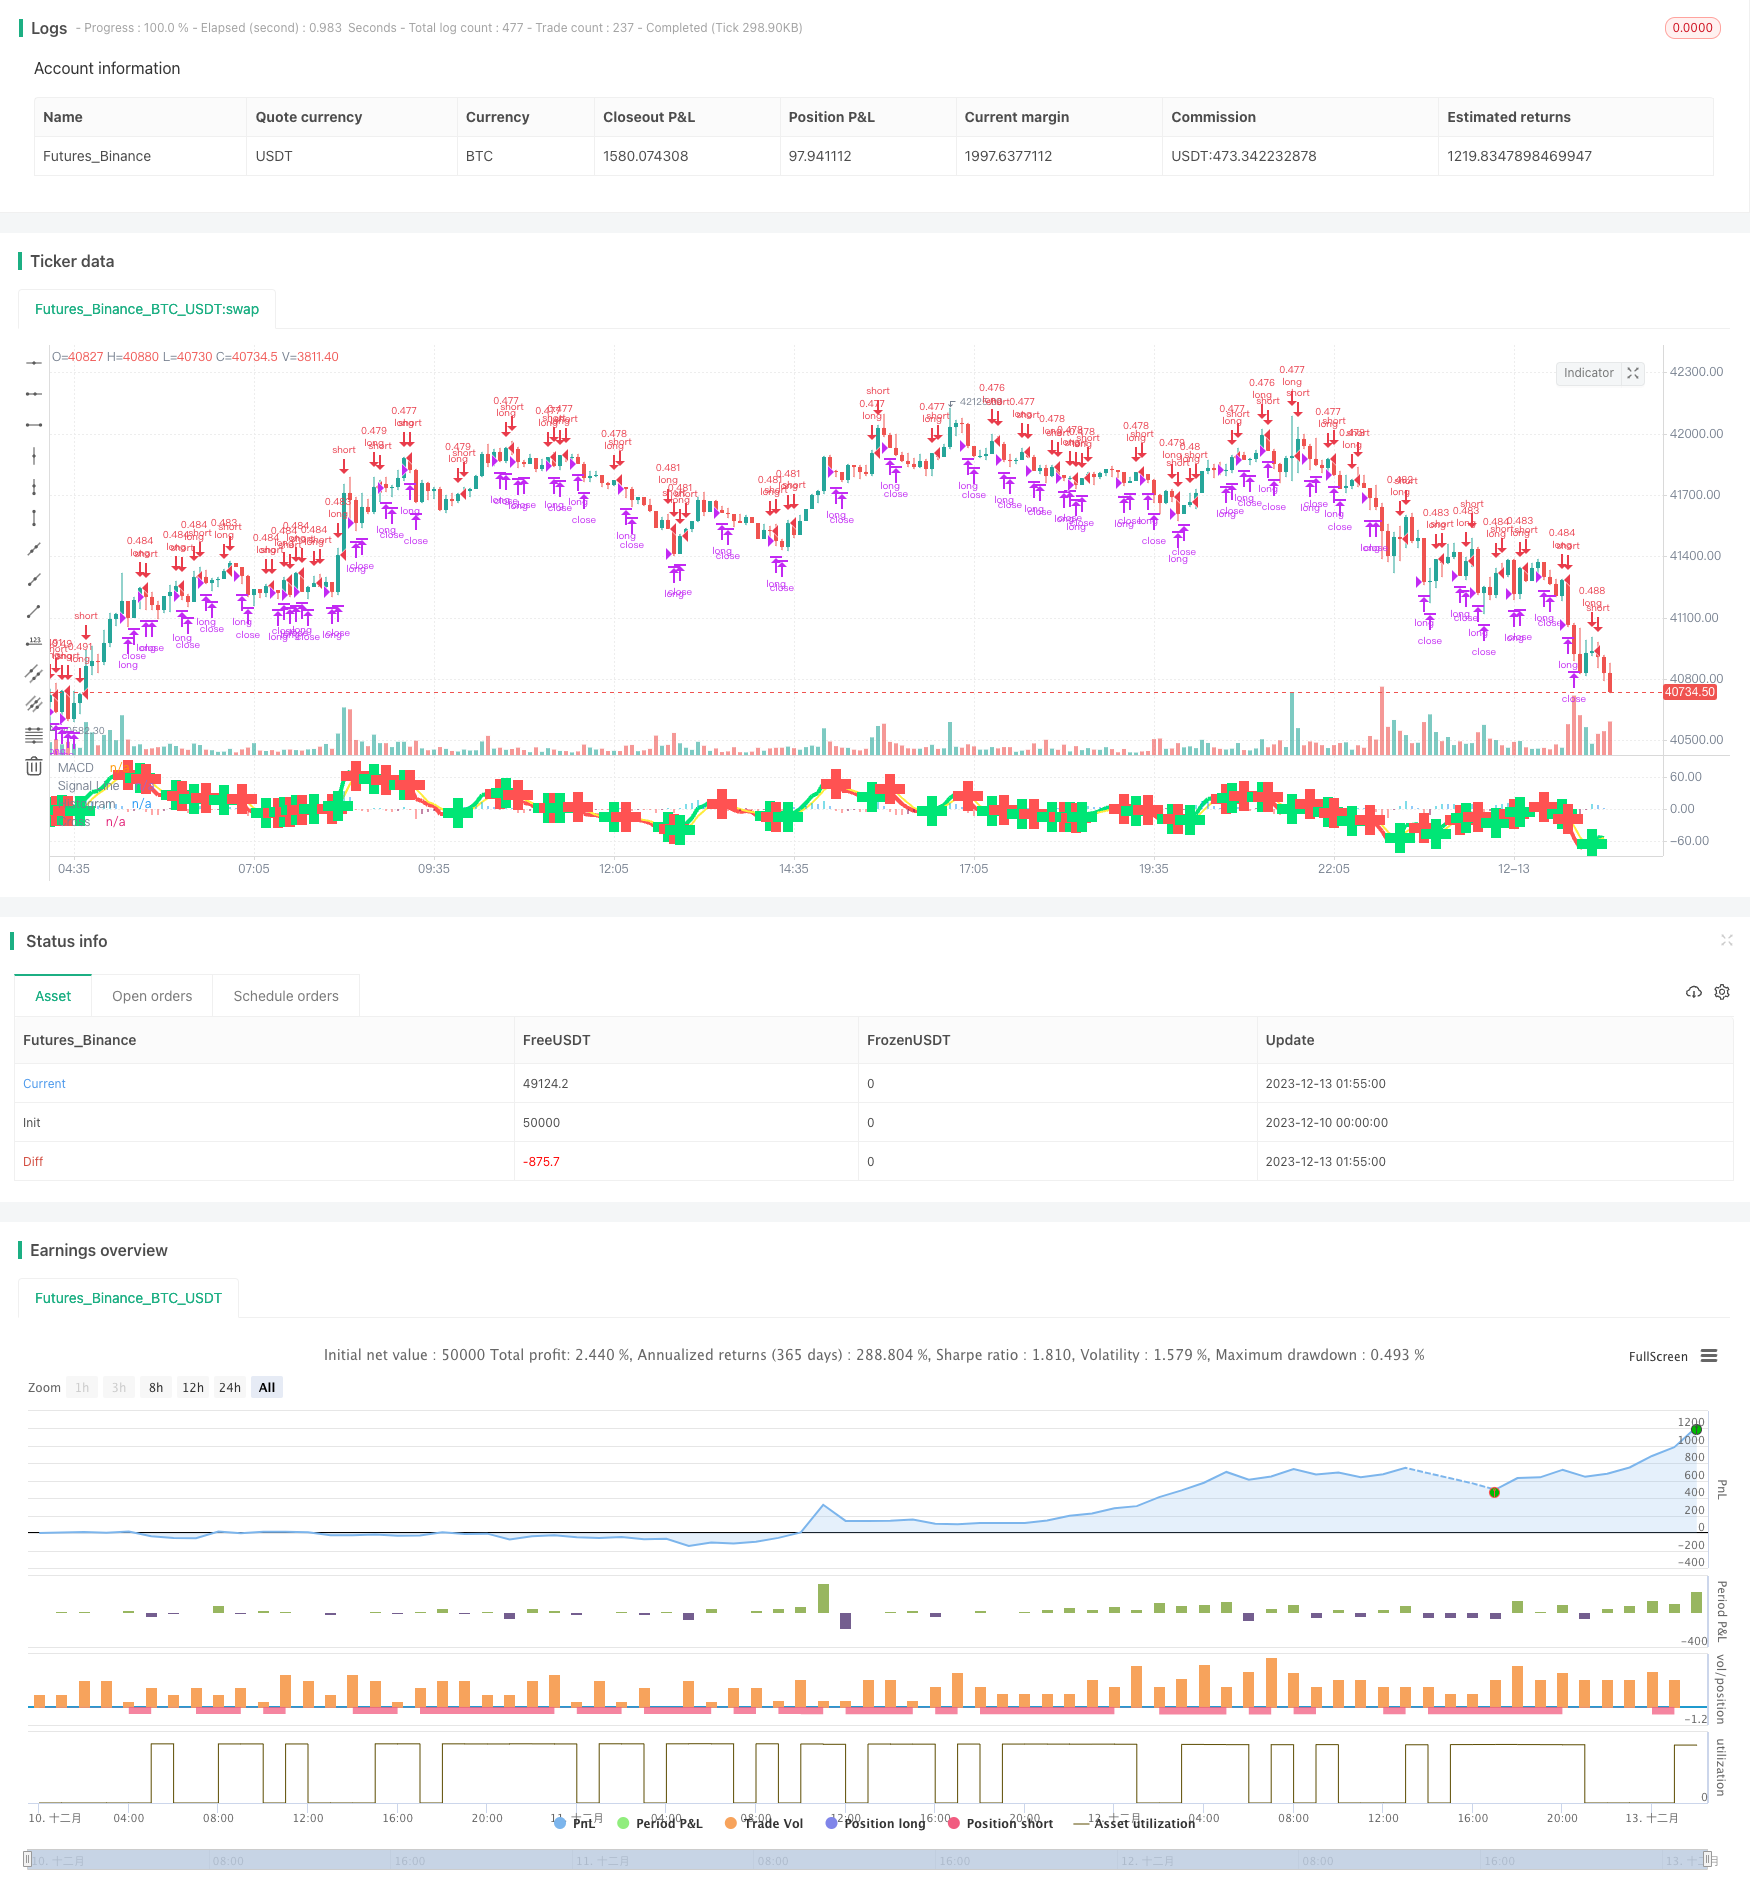
This strategy is named MACD Dual Moving Average Tracking Strategy. It uses MACD indicator's golden cross and death cross of dual moving averages as trading signals, combined with the previous day's lowest price as the stop loss point to track the short-term price movement.
Strategy Logic
- Calculate fast EMA(close,5), slow EMA(close,8) and signal SMA(MACD,3)
- Define long signal: when fast MA crosses above slow MA
- Define short signal: when fast MA crosses below slow MA or closing price is lower than previous day's lowest price
- Position size is initial capital 2000 USD divided by closing price
- Use short signal to close long position as stop loss
Advantage Analysis
- Use MACD indicator to determine overbought and oversold zones, with dual MAs to form trading signals, avoiding false breakout
- Track short-term trends, timely stop loss
- Dynamic adjustment of position size avoids excessively large single loss
Risk Analysis
- MACD indicator has lagging effect, may miss short-term opportunities
- Dual MA trading signals may produce false signals
- Stop loss point is too aggressive, with high frequency of being stopped out
Optimization Directions
- Optimize MACD parameters combination to improve indicator sensitivity
- Add trend judgment to avoid false signals from market consolidation
- Combine with Volatility Index to assess market volatility, adjust stop loss point
Summary
This strategy uses the classic MACD dual moving average combination indicator to determine overbought and oversold zones, generating trading signals, while introducing dynamic position sizing and previous day's lowest price as stop loss point design to capture short-term price fluctuations. The overall strategy logic is clear and easy to understand, worth further testing and optimization.
Parameters
| Name | Default | What it controls |
|---|---|---|
| v_input_1 | true | Use Current Chart Resolution? |
| v_input_2 | 60 | Use Different Timeframe? Uncheck Box Above |
| v_input_3 | true | Show MacD & Signal Line? Also Turn Off Dots Below |
| v_input_4 | true | Show Dots When MacD Crosses Signal Line? |
| v_input_5 | true | Show Histogram? |
| v_input_6 | true | Change MacD Line Color-Signal Line Cross? |
| v_input_7 | true | MacD Histogram 4 Colors? |
| v_input_8 | true | Vender cuando closing price < previous day low? |
| v_input_9 | 5 | fastLength |
| v_input_10 | 8 | slowLength |
| v_input_11 | 3 | signalLength |
Source Pine Script
/*backtest
start: 2023-12-10 00:00:00
end: 2023-12-13 02:00:00
period: 5m
basePeriod: 1m
exchanges: [{"eid":"Futures_Binance","currency":"BTC_USDT"}]
*/

//@version=2
// macd/cam v1 strategizing Chris Moody Macd indicator https://www.tradingview.com/script/OQx7vju0-MacD-Custom-Indicator-Multiple-Time-Frame-All-Available-Options/
// macd/cam v2 changing to macd 5,8,3
// macd/cam v2.1
//      Sell when lower than previous day low.
//      Initial capital of $2k. Buy/sell quantity of initial capital / close price
//      Quitar short action
//      Note: custom 1-week resolution seems to put AMD at 80% profitable

strategy(title="MACD/CAM 2.1", shorttitle="MACD/CAM 2.1") //
source = close
//get inputs from options
useCurrentRes = input(true, title="Use Current Chart Resolution?")
resCustom = input(title="Use Different Timeframe? Uncheck Box Above", defval="60")
smd = input(true, title="Show MacD & Signal Line? Also Turn Off Dots Below")
sd = input(true, title="Show Dots When MacD Crosses Signal Line?")
sh = input(true, title="Show Histogram?")
macd_colorChange = input(true,title="Change MacD Line Color-Signal Line Cross?")
hist_colorChange = input(true,title="MacD Histogram 4 Colors?")
venderLowerPrev = input(true,title="Vender cuando closing price < previous day low?")

res = useCurrentRes ? timeframe.period : resCustom

fastLength = input(5, minval=1), slowLength=input(8,minval=1)
signalLength=input(3,minval=1)

// find exponential moving average of price as x and fastLength var as y
fastMA = ema(source, fastLength)
slowMA = ema(source, slowLength)

macd = fastMA - slowMA
// simple moving average
signal = sma(macd, signalLength)
hist = macd - signal

outMacD = request.security(syminfo.tickerid, res, macd)
outSignal = request.security(syminfo.tickerid, res, signal)
outHist = request.security(syminfo.tickerid, res, hist)

histA_IsUp = outHist > outHist[1] and outHist > 0
histA_IsDown = outHist < outHist[1] and outHist > 0
histB_IsDown = outHist < outHist[1] and outHist <= 0
histB_IsUp = outHist > outHist[1] and outHist <= 0

//MacD Color Definitions
macd_IsAbove = outMacD >= outSignal
macd_IsBelow = outMacD < outSignal

plot_color = hist_colorChange ? histA_IsUp ? aqua : histA_IsDown ? blue : histB_IsDown ? red : histB_IsUp ? maroon :yellow :gray
macd_color = macd_colorChange ? macd_IsAbove ? lime : red : red
signal_color = macd_colorChange ? macd_IsAbove ? yellow : yellow : lime

circleYPosition = outSignal

plot(smd and outMacD ? outMacD : na, title="MACD", color=macd_color, linewidth=4)
plot(smd and outSignal ? outSignal : na, title="Signal Line", color=signal_color, style=line ,linewidth=2)
plot(sh and outHist ? outHist : na, title="Histogram", color=plot_color, style=histogram, linewidth=4)

circleCondition = sd and cross(outMacD, outSignal)

// Determine long and short conditions
longCondition  = circleCondition and macd_color == lime

redCircle = circleCondition and macd_color == red
redCirclePrevLow = redCircle or low<low[1]
shortCondition = redCircle
if (venderLowerPrev)
    shortCondition = redCirclePrevLow

strategy.initial_capital = 20000
// Set quantity to initial capital / closing price
cantidad = strategy.initial_capital/close

// Submit orders
strategy.entry(id="long", long=true, qty=cantidad, when=longCondition)
strategy.close(id="long", when=shortCondition)
plot(circleCondition ? circleYPosition : na, title="Cross", style=cross, linewidth=10, color=macd_color)
// hline(0, '0 Line', linestyle=solid, linewidth=2, color=white)Published by ChaoZhang on the FMZ strategy square · last modified 2023-12-18. Collected in the Quant Trading Vault. Unvalidated research: re-test with your own data and costs before trusting it.
Build this with AgenKit
A spec is not a trading system. Paste this into your coding agent and AgenKit runs a specialist team — architecture, test-first build, risk gates, review — with paper trading on by default.
/agenkit build a production-grade trading bot with a backtest engine, risk controls and paper trading by default from strategies/MACD-Dual-Moving-Average-Tracking-Strategy.md- npx agenkit install engineering-kit in your project
- Paste the command into your agent and approve each phase
- Get tests, backtest, risk controls and a paper-trading switch
Understand it first
Before you run this, read the lesson behind the idea and how to backtest it honestly. Specs like this one are the survivors of an unknown number of trials; deflate their results accordingly.
Related specs
- Bull Market Tracking SystemPine Script · Breakout · 1h
- Dual Breakout Volatility Channel StrategyPine Script · Breakout · 1h
- EMA MACD Quantitative Strategy With Dual Track Running and Leading the Market IndexPine Script · Breakout · 1d
- Kana Candle Breakout Strategy Based on Moving Average and Support ResistancePine Script · Breakout · 1h
- Momentum Breakout Moving Average StrategyPine Script · Breakout · 1d
- Momentum Breakout Trading Strategy 440964Pine Script · Breakout · 5m