Momentum Breakout and Trend Following Combination Strategy
This strategy is a combination strategy that integrates momentum indicators, trend following indicators and moving average indicators to realize trend following and breakout entry/exit. It mainly uses the combination…
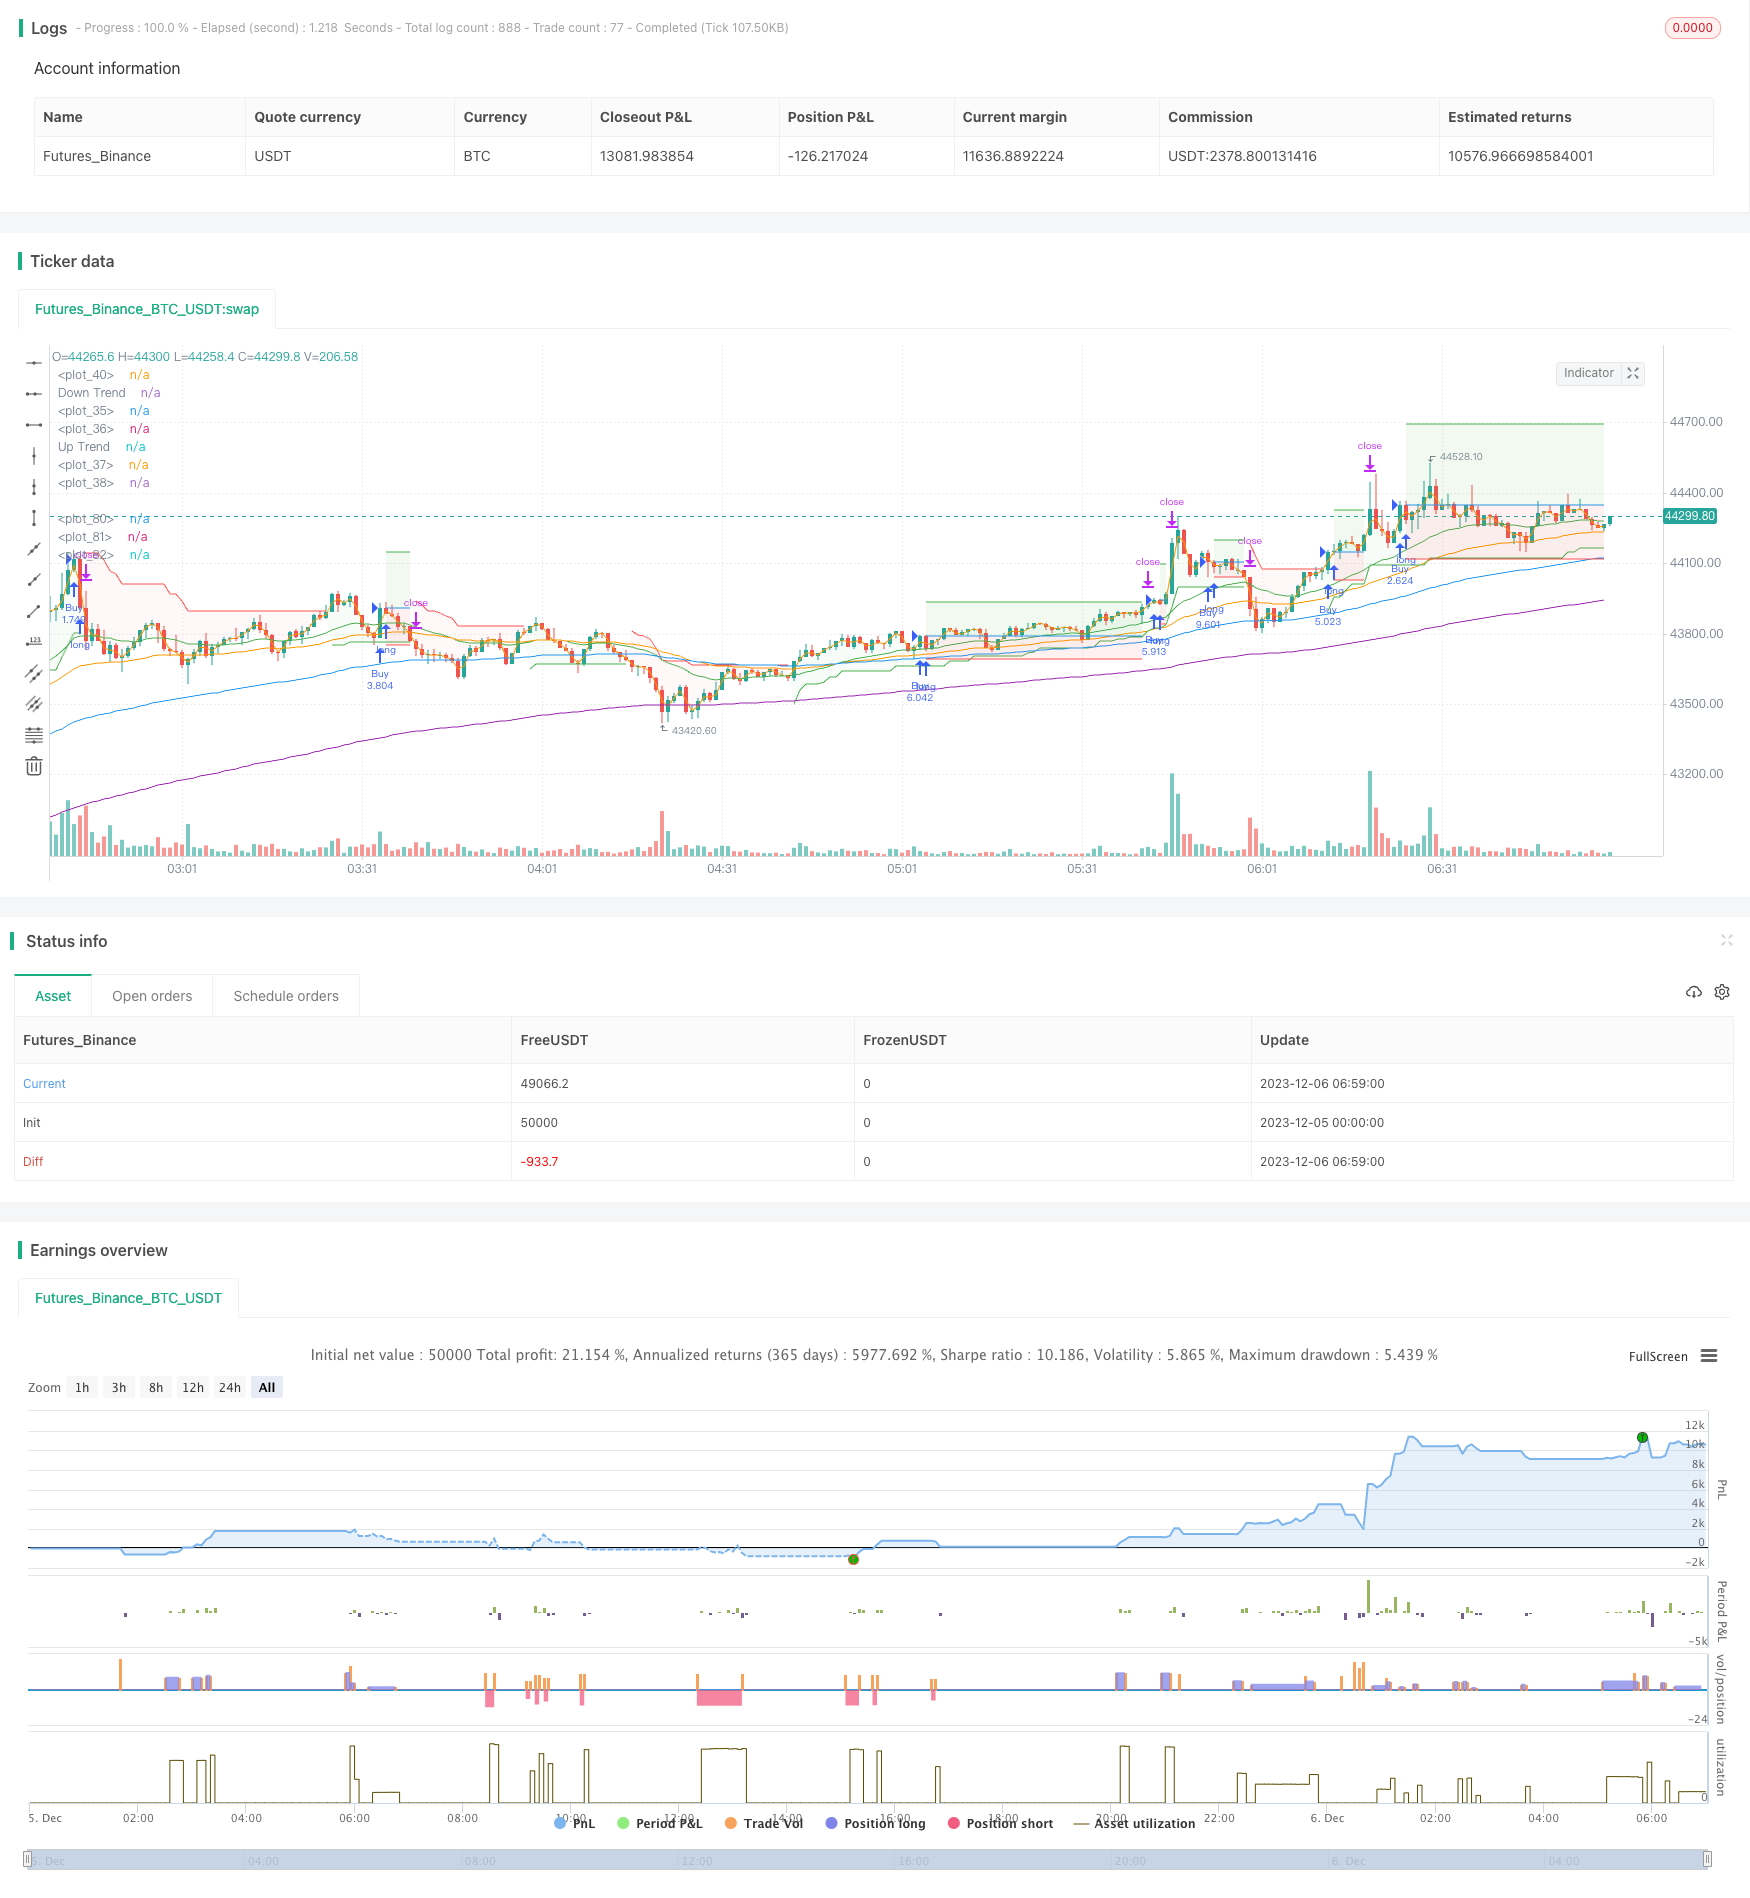
Overview
This strategy is a combination strategy that integrates momentum indicators, trend following indicators and moving average indicators to realize trend following and breakout entry/exit. It mainly uses the combination of Stochastic indicator and Supertrend indicator to determine entry/exit timing, and uses EMA lines to judge the main market trend.
Strategy Principle
The strategy consists of the following indicators:
EMA lines: Use EMA 25, 50, 100 and 200 to determine the main trend. When EMA25 crosses above EMA50 and EMA100 crosses above EMA200, it is an upward trend, otherwise it is a downward trend.
Supertrend trend following indicator: Parameters are Factor 3 and ATR 10 to judge whether the current price is in an uptrend or a downtrend. When Supertrend is green, it is an uptrend. When it is red, it is a downtrend.
Stochastic momentum indicator: %K 8 and %D 3 to determine if Stochastic generates golden cross or dead cross. When %K line crosses %D line from below, it is a golden cross signal, and vice versa for dead cross.
The buy strategy is: EMA shows uptrend + Supertrend shows uptrend + Stochastic golden cross.
The sell strategy is: EMA shows downtrend + Supertrend shows downtrend + Stochastic dead cross.
This strategy integrates trend, momentum and breakout indicators to reliably determine market moves and trading points.
Advantage Analysis
The main advantages of this strategy are:
Combining multiple indicators improves robustness and filters out fake breakouts effectively.
Adding momentum indicator can early spot turning points.
Customizable parameters suit different market environments.
Realizes relatively efficient stop loss and take profit setting.
Works well when backtested on high timeframes like daily.
Risk Analysis
There are also some risks:
Improper parameter settings may cause too frequent trading or unstable signals. Parameters need to be optimized.
There can still be misjudgements in timing. More filter indicators may be added.
Stop loss set on Stochastic extremes may be too close. Wider stop is worth testing.
Insufficient backtest data may cause bias in parameter fitting. Expand backtest period.
Optimization Directions
The strategy can be optimized in the following ways:
Test more parameter sets to find optimum. E.g. adjust Supertrend Factor.
Add more filter indicators like energy or volatility to reduce misjudgements.
Test different stop loss ways, e.g. percentage-based stop loss.
Optimize take profit, like trailing stop to lock in more profits.
Expand scope, adapt to more products or higher timeframes.
Conclusion
The strategy's logic is clear and indicator selection reasonable. It realizes trend following and momentum breakout trading with good backtest results. But there is still room for optimization, e.g. parameter tuning, adding filters, improving stops and profit taking. Multi-dimensional optimization can make the strategy more robust.
Parameters
| Name | Default | What it controls |
|---|---|---|
| v_input_1 | 1.5 | P/L |
| v_input_2 | true | Loss Percentage |
| v_input_3 | 10 | ATR Length |
| v_input_4 | 3 | Supertrend Factor |
| v_input_5 | 8 | %K Length |
| v_input_6 | 3 | %K Smoothing |
| v_input_7 | 3 | %D Smoothing |
| v_input_8 | 25 | EMA 1 Length |
| v_input_9 | 50 | EMA 2 Length |
| v_input_10 | 100 | EMA 3 Length |
| v_input_11 | 200 | EMA 4 Length |
Source Pine Script
/*backtest
start: 2023-12-05 00:00:00
end: 2023-12-06 07:00:00
period: 1m
basePeriod: 1m
exchanges: [{"eid":"Futures_Binance","currency":"BTC_USDT"}]
*/

//@version=4
strategy(title="Supertrend + Stoch Strategy", overlay=true)

// ---inputs---
pl = input(1.5, title="P/L", minval=0.1)
lossPercentage = input(1, title="Loss Percentage", minval=1, maxval=100)
atrPeriod = input(10, "ATR Length")
factor = input(3, "Supertrend Factor")
periodK = input(8, title="%K Length", minval=1)
smoothK = input(3, title="%K Smoothing", minval=1)
periodD = input(3, title="%D Smoothing", minval=1)
ema1l = input(25, title="EMA 1 Length", minval=1)
ema2l = input(50, title="EMA 2 Length", minval=1)
ema3l = input(100, title="EMA 3 Length", minval=1)
ema4l = input(200, title="EMA 4 Length", minval=1)

// ---lines---
ema1 = ema(close, ema1l)
ema2 = ema(close, ema2l)
ema3 = ema(close, ema3l)
ema4 = ema(close, ema4l)
trendUpper = ema1 > ema2 and ema3 > ema4
trendLower = ema1 < ema2 and ema3 < ema4

[supertrend, direction] = supertrend(factor, atrPeriod)
supertrendUpper = direction < 0
supertrendLower = direction > 0

k = sma(stoch(close, high, low, periodK), smoothK)
d = sma(k, periodD)
stochCrossOver = crossover(k, d)
stochCrossUnder = crossunder(k, d)

// ---plot---
plot(ema1, color=color.green)
plot(ema2, color=color.orange)
plot(ema3, color=color.blue)
plot(ema4, color=color.purple)

bodyMiddle = plot((open + close) / 2, display=display.none)
upTrend = plot(direction < 0 ? supertrend : na, "Up Trend", color = color.green, style=plot.style_linebr)
downTrend = plot(direction < 0 ? na : supertrend, "Down Trend", color = color.red, style=plot.style_linebr)
fill(bodyMiddle, upTrend, color.new(color.green, 95), fillgaps=false)
fill(bodyMiddle, downTrend, color.new(color.red, 95), fillgaps=false)

// ---stop place compute---
edge = 0.  // periodly high/low
edge := stochCrossOver ? high : stochCrossUnder ? low : k > d ? max(edge[1], high) : k < d ? min(edge[1], low) : edge[1]

// plot(edge)

// ---trade condition---
// longCond = trendUpper and supertrendUpper and stochCrossOver
// shortCond = trendLower and supertrendLower and stochCrossUnder
longCond = trendUpper and supertrendUpper and stochCrossOver and strategy.position_size == 0
shortCond = trendLower and supertrendLower and stochCrossUnder and strategy.position_size == 0

// ---stop & take---
stop = 0.
stop := nz(stop[1], stop)
take = 0.
take := nz(take[1], take)

if longCond
    stop := edge[1]
    take := close + (close - stop) * pl
if shortCond
    stop := edge[1]
    take := close - (stop - close) * pl

// ---trade---
qty = strategy.equity / abs(stop - close) / 100 * lossPercentage

strategy.entry("Buy", strategy.long, when=longCond, qty=qty)
strategy.exit("Close Buy","Buy", limit=take, stop=stop)

strategy.entry("Sell", strategy.short, when=shortCond, qty=qty)
strategy.exit("Close Sell","Sell", limit=take, stop=stop)

stopLine = plot(strategy.position_size != 0 ? stop : na, color=color.red, style=plot.style_linebr)
takeLine = plot(strategy.position_size != 0 ? take : na, color=color.green, style=plot.style_linebr)
entryLine = plot(strategy.position_size != 0 ? strategy.position_avg_price : na, color=color.blue, style=plot.style_linebr)
fill(entryLine, stopLine, color.new(color.red, 90), fillgaps=false)
fill(entryLine, takeLine, color.new(color.green, 90), fillgaps=false)Published by ChaoZhang on the FMZ strategy square · last modified 2023-12-13. Collected in the Quant Trading Vault. Unvalidated research: re-test with your own data and costs before trusting it.
Build this with AgenKit
A spec is not a trading system. Paste this into your coding agent and AgenKit runs a specialist team — architecture, test-first build, risk gates, review — with paper trading on by default.
/agenkit build a production-grade trading bot with a backtest engine, risk controls and paper trading by default from strategies/Momentum-Breakout-and-Trend-Following-Combination-Strategy.md- npx agenkit install engineering-kit in your project
- Paste the command into your agent and approve each phase
- Get tests, backtest, risk controls and a paper-trading switch
Understand it first
Before you run this, read the lesson behind the idea and how to backtest it honestly. Specs like this one are the survivors of an unknown number of trials; deflate their results accordingly.
Related specs
- Momentum Breakout Trading Strategy 440964Pine Script · Breakout · 5m
- Quantitative Strategy PSARZigZagMACDART Based on Multi Indicator CombinationPine Script · Breakout · 1m
- Quantitative Trading Price Breakthrough StrategyPine Script · Breakout · 1d
- Quantitative Trading Strategy Based on Ichimoku with Multiple SignalsPine Script · Breakout · 1h
- Dual MA Indicator Oscillating Price Tracking StrategyPine Script · Breakout · 2h
- Cross Timeframe SuperTrend Breakout StrategyPine Script · Breakout · 1h