Momentum Finding Strategy
This strategy uses multiple indicators such as Bollinger Bands, KC channels, and candlestick colors to determine market squeezes and releases, and combines establishment trend judgments based on moving averages to…
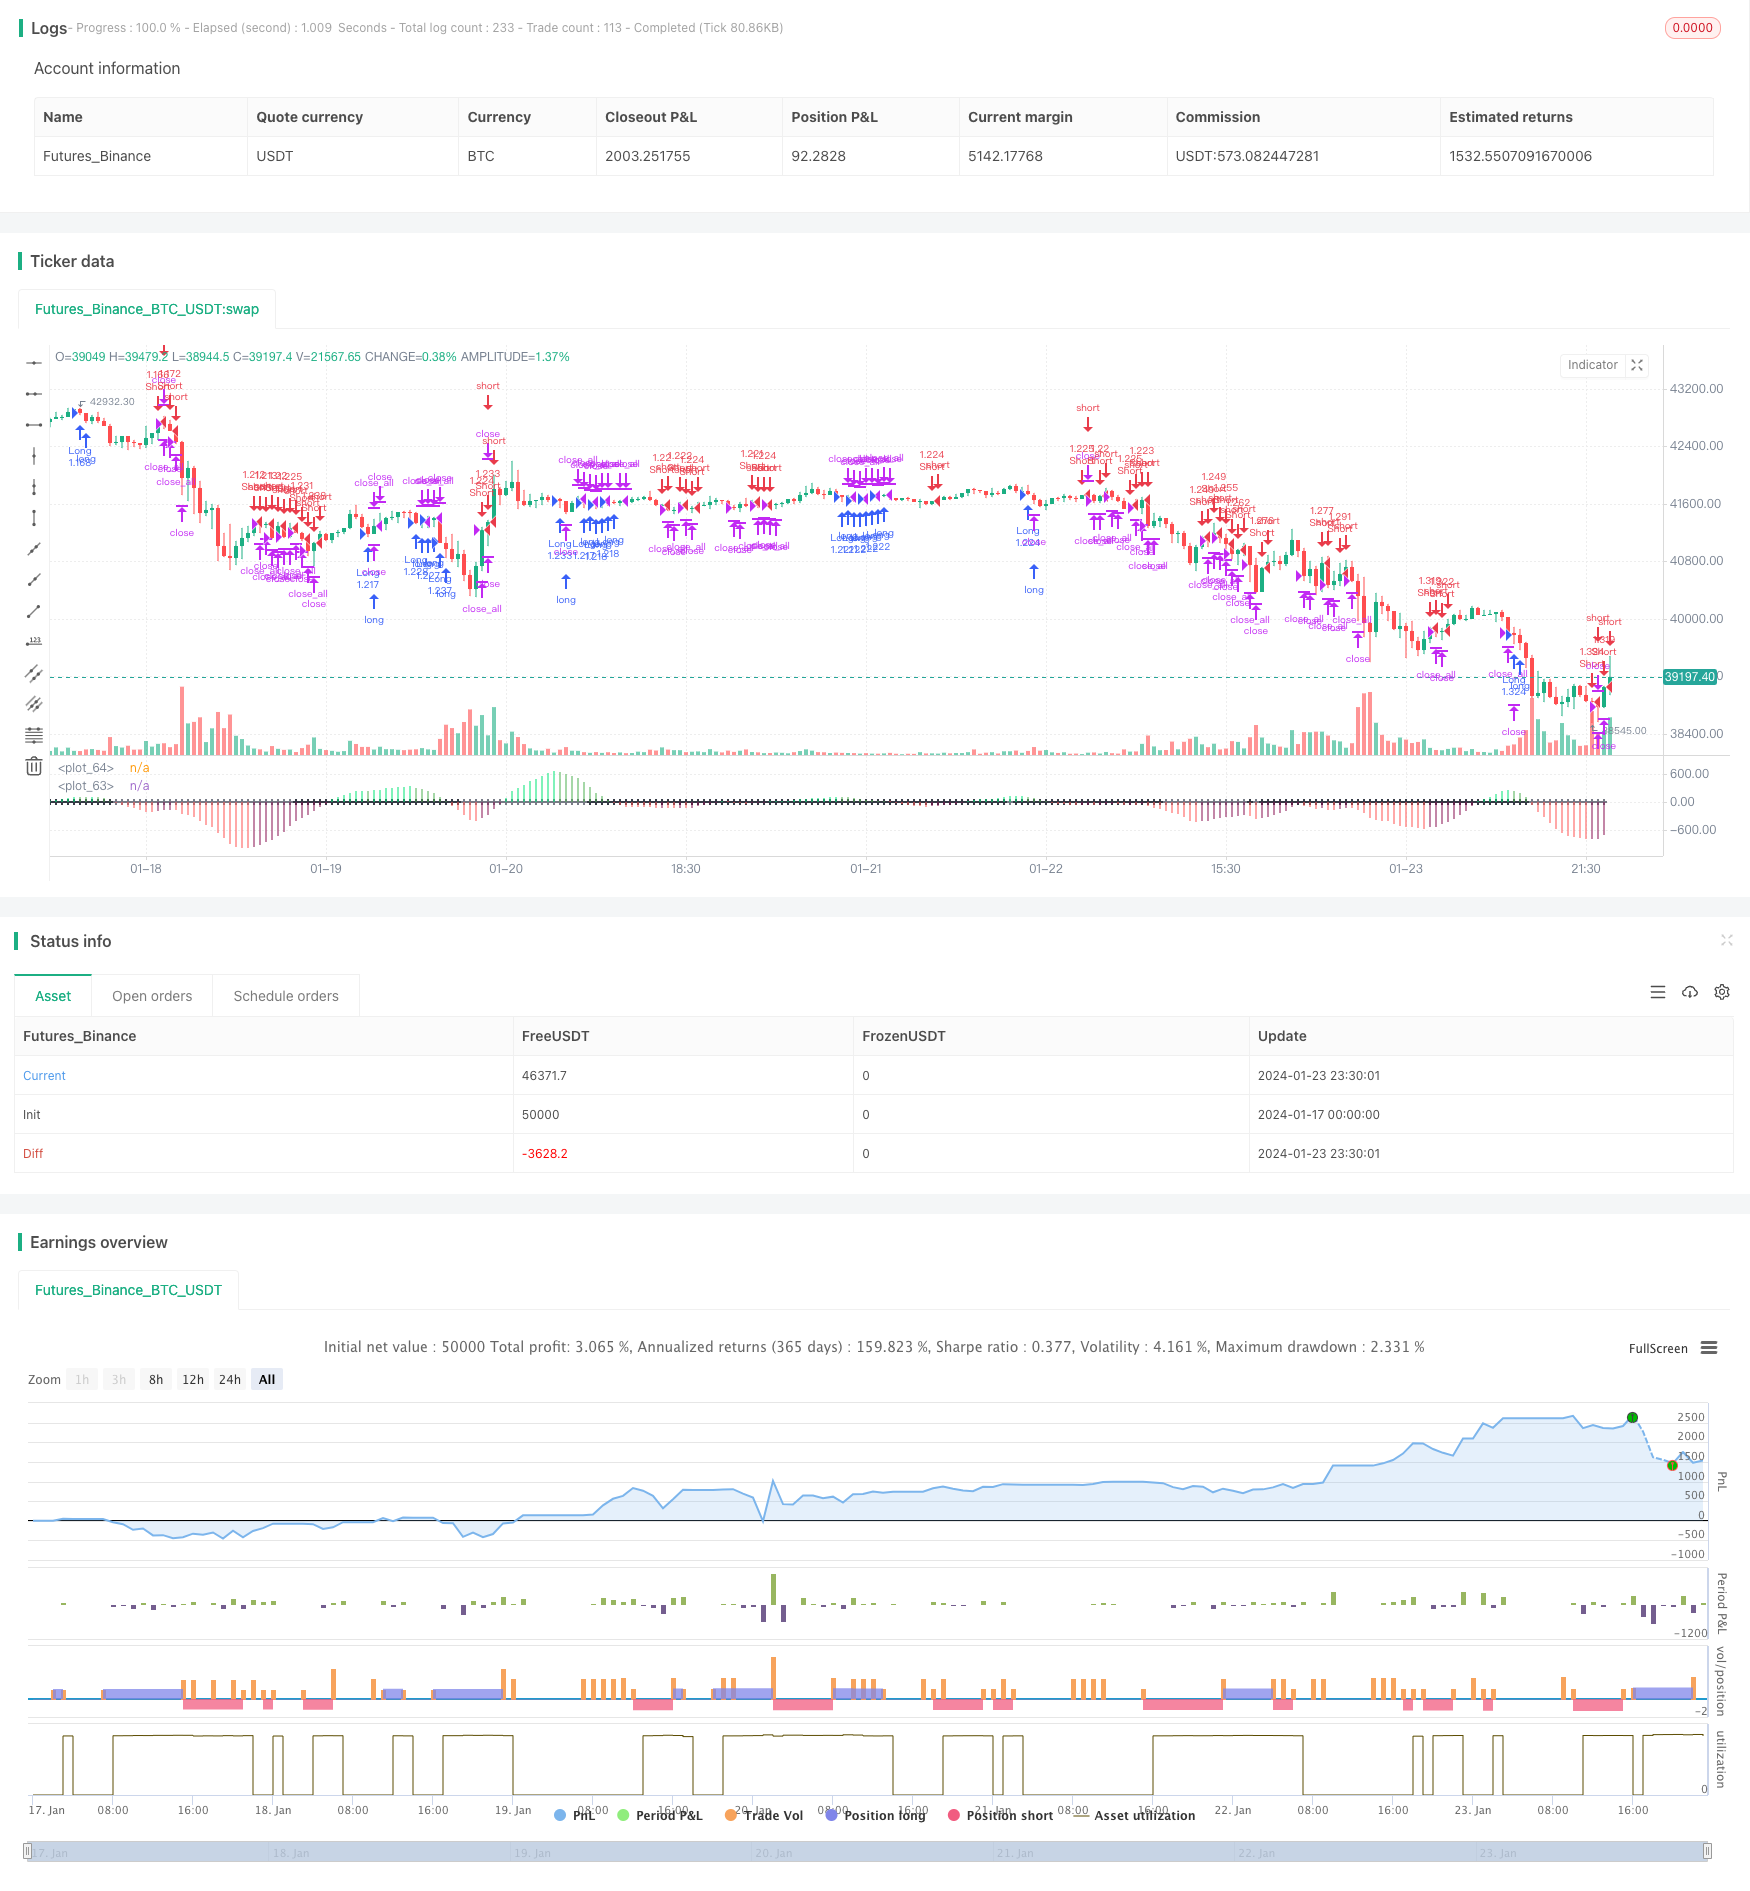
Overview
This strategy uses multiple indicators such as Bollinger Bands, KC channels, and candlestick colors to determine market squeezes and releases, and combines establishment trend judgments based on moving averages to make transactions when trend reversals occur.
Strategy Principle
Calculate Bollinger Bands. The middle rail of Bollinger Bands is the simple moving average of N-day closing prices, the upper rail is the middle rail + M times the N-day true range volatility of the KC channel, and the lower rail is the middle rail - M times the N-day true range volatility of the KC channel.
Calculate the KC channel. The middle rail of the KC channel is the simple moving average of N-day closing prices, the upper rail is the middle rail + M times the N-day true range volatility, and the lower rail is the middle rail - M times the N-day true range volatility.
Judge squeeze and release. When the Bollinger Band upper rail is below the KC channel upper rail and the Bollinger Band lower rail is above the KC channel lower rail, it is a squeeze. When the Bollinger Band upper rail is above the KC channel upper rail and the Bollinger Band lower rail is below the KC The channel lower rail is released.
Calculate the establishment trend. Take the N-day closing price-average of the highest and lowest prices of N days as input, calculate the N-day linear regression, and its value greater than 0 indicates an upward establishment trend, and less than 0 indicates establishment downward trend.
Trading signals. When the establishment is rising, short yang lines and releases are long signals; when the establishment is falling, short yin lines and squeezes are short signals.
Strategy Advantages
Multi-indicator judgment improves signal accuracy. Combining Bollinger Bands, KC channels and candlesticks to judge market trends avoids false signals.
Establishment trend judgment, trade according to the trend. Use establishment to determine the main trend and avoid trading against the trend.
Automatic stop loss to control risks. When the price touches the stop loss line, automatically close the position to stop loss.
Strategy Risks
Improper parameter settings for Bollinger Bands and KC channels may result in erroneous judgments of squeezes and releases.
The establishment trend judgment lags, which may miss trend reversal points.
Sudden events cause huge moves that cannot be stopped, with considerable loss risks.
Optimization methods: Adjust Bollinger Band and KC channel parameters, use ADX and other indicators to assist in judging; Update the establishment moving average cycle in time to reduce lag; Add a buffer zone when setting the stop loss line.
Strategy Optimization Directions
Combine more technical indicators to improve the accuracy of opening positions signals. Such as KDJ, MACD, etc.
Optimize the cycle parameters of the establishment moving average to make it better capture new trends.
Add trading volume indicators to avoid false breakouts. Such as Energy tide indicator, Accumulation/Distribution, etc.
Multi-timeframe judgments distinguish between medium-and-long-term and short-term signals. Avoid being trapped.
AI optimization parameters, exhaustive search and optimal parameter combination searched. Reduce overfitting.
Summary
The main idea of this strategy is: using Bollinger Bands to determine the compression and release of the market; auxiliary use establishment trend to determine the main trend direction; operate in the opposite direction of the establishment at the turning point of compression and release. The advantages of the strategy are accurate signals, stop losses, and avoiding false signals. The directions for optimizing the strategy include: multi-indicator combinations, trend judgment parameter optimization, adding momentum indicators, multi-timeframe judgments, AI search optimization, etc. Overall, this strategy is based on the self-similarity and periodic operation rules of the market, depicting the rhythm changes of the market through indicators, and trading at the critical points when the market changes from energy storage to energy release, which belongs to a typical cycle trading strategy.
Parameters
| Name | Default | What it controls |
|---|---|---|
| v_input_1 | true | Long |
| v_input_2 | true | Short |
| v_input_3 | true | leverage |
| v_input_4 | 20 | BB Length |
| v_input_5 | 2 | BB MultFactor |
| v_input_6 | 20 | KC Length |
| v_input_7 | 1.5 | KC MultFactor |
| v_input_8 | true | Mode 2 |
| v_input_9 | true | Use color of candle |
| v_input_10 | true | Use EMA Body |
| v_input_11 | false | Show trend background |
| v_input_12 | 2018 | From Year |
| v_input_13 | 2100 | To Year |
| v_input_14 | true | From Month |
| v_input_15 | 12 | To Month |
| v_input_16 | true | From day |
| v_input_17 | 31 | To day |
Source Pine Script
/*backtest
start: 2024-01-17 00:00:00
end: 2024-01-24 00:00:00
period: 30m
basePeriod: 15m
exchanges: [{"eid":"Futures_Binance","currency":"BTC_USDT"}]
*/

//Noro
//2017

//@version=2
strategy(shorttitle = "Squeeze str 1.1", title="Noro's Squeeze Momentum Strategy v1.1", overlay = false, default_qty_type = strategy.percent_of_equity, default_qty_value = 100, pyramiding = 0)

//Settings
needlong = input(true, defval = true, title = "Long")
needshort = input(true, defval = true, title = "Short")
lev = input(1, defval = 1, minval = 1, maxval = 100, title = "leverage")
length = input(20, title="BB Length")
mult = input(2.0,title="BB MultFactor")
lengthKC=input(20, title="KC Length")
multKC = input(1.5, title="KC MultFactor")
useTrueRange = true
mode2 = input(true, defval = true, title = "Mode 2")
usecolor = input(true, defval = true, title = "Use color of candle")
usebody = input(true, defval = true, title = "Use EMA Body")
needbg = input(false, defval = false, title = "Show trend background")
fromyear = input(2018, defval = 2018, minval = 1900, maxval = 2100, title = "From Year")
toyear = input(2100, defval = 2100, minval = 1900, maxval = 2100, title = "To Year")
frommonth = input(01, defval = 01, minval = 01, maxval = 12, title = "From Month")
tomonth = input(12, defval = 12, minval = 01, maxval = 12, title = "To Month")
fromday = input(01, defval = 01, minval = 01, maxval = 31, title = "From day")
today = input(31, defval = 31, minval = 01, maxval = 31, title = "To day")

// Calculate BB
source = close
basis = sma(source, length)
dev = multKC * stdev(source, length)
upperBB = basis + dev
lowerBB = basis - dev

// Calculate KC
ma = sma(source, lengthKC)
range = useTrueRange ? tr : (high - low)
rangema = sma(range, lengthKC)
upperKC = ma + rangema * multKC
lowerKC = ma - rangema * multKC

sqzOn  = (lowerBB > lowerKC) and (upperBB < upperKC)
sqzOff = (lowerBB < lowerKC) and (upperBB > upperKC)
noSqz  = (sqzOn == false) and (sqzOff == false)

val = linreg(source  -  avg(avg(highest(high, lengthKC), lowest(low, lengthKC)),sma(close,lengthKC)), lengthKC,0)

bcolor = iff( val > 0, iff( val > nz(val[1]), lime, green), iff( val < nz(val[1]), red, maroon))
scolor = noSqz ? blue : sqzOn ? black : gray

trend = val > 0 ? 1 : val < 0 ? -1 : 0

//Background
col = needbg == false ? na : trend == 1 ? lime : red
bgcolor(col, transp = 80)

//Body
body = abs(close - open)
abody = sma(body, 10) / 3

//Indicator
bcol = iff( val > 0, iff( val > nz(val[1]), lime, green), iff( val < nz(val[1]), red, maroon))
scol = noSqz ? blue : sqzOn ? black : gray
plot(val, color=bcol, style=histogram, linewidth=4)
plot(0, color=scol, style=cross, linewidth=2)

//Signals
bar = close > open ? 1 : close < open ? -1 : 0
up1 = trend == 1 and (bar == -1 or usecolor == false) and (body > abody or usebody == false) and mode2 == false
dn1 = trend == -1 and (bar == 1 or usecolor == false) and (body > abody or usebody == false) and mode2 == false

up2 = trend == 1 and val < val[1] and mode2
dn2 = trend == -1 and val > val[1] and mode2

exit = (strategy.position_size > 0 and close > strategy.position_avg_price) or (strategy.position_size < 0 and close < strategy.position_avg_price) and mode2

//Trading
lot = strategy.position_size == 0 ? strategy.equity / close * lev : lot[1]

if up1 or up2
    strategy.entry("Long", strategy.long, needlong == false ? 0 : lot)

if dn1 or dn2
    strategy.entry("Short", strategy.short, needshort == false ? 0 : lot)

if exit
strategy.close_all()Published by ChaoZhang on the FMZ strategy square · last modified 2024-01-25. Collected in the Quant Trading Vault. Unvalidated research: re-test with your own data and costs before trusting it.
Build this with AgenKit
A spec is not a trading system. Paste this into your coding agent and AgenKit runs a specialist team — architecture, test-first build, risk gates, review — with paper trading on by default.
/agenkit build a production-grade trading bot with a backtest engine, risk controls and paper trading by default from strategies/Momentum-Finding-Strategy.md- npx agenkit install engineering-kit in your project
- Paste the command into your agent and approve each phase
- Get tests, backtest, risk controls and a paper-trading switch
Understand it first
Before you run this, read the lesson behind the idea and how to backtest it honestly. Specs like this one are the survivors of an unknown number of trials; deflate their results accordingly.
Related specs
- ADX Momentum Trend StrategyPine Script · Momentum · 10m
- Four factor Momentum Tracking Trading Strategy Based on ADX BB B AO and EMAPine Script · Momentum · 1d
- Momentum Trading Strategy Based on Multi factor ModelPine Script · Momentum · 1d
- Dynamic Momentum Weighted Moving Average Crossover StrategyPine Script · Momentum · 1h
- Momentum Trend Following Oscillation StrategyPine Script · Momentum · 1h
- Multi Indicator Comprehensive Analysis Quantitative Trading Strategy Trend Momentum and Volatility Collaborative Prediction ModelPine Script · Momentum · 3m