Momentum Indicator Crossover Strategy 440720
This strategy uses the crossover of the RSI indicator and its moving average as trading signals, belonging to the common momentum indicator strategies. Its core principle is to track the difference between the RSI…
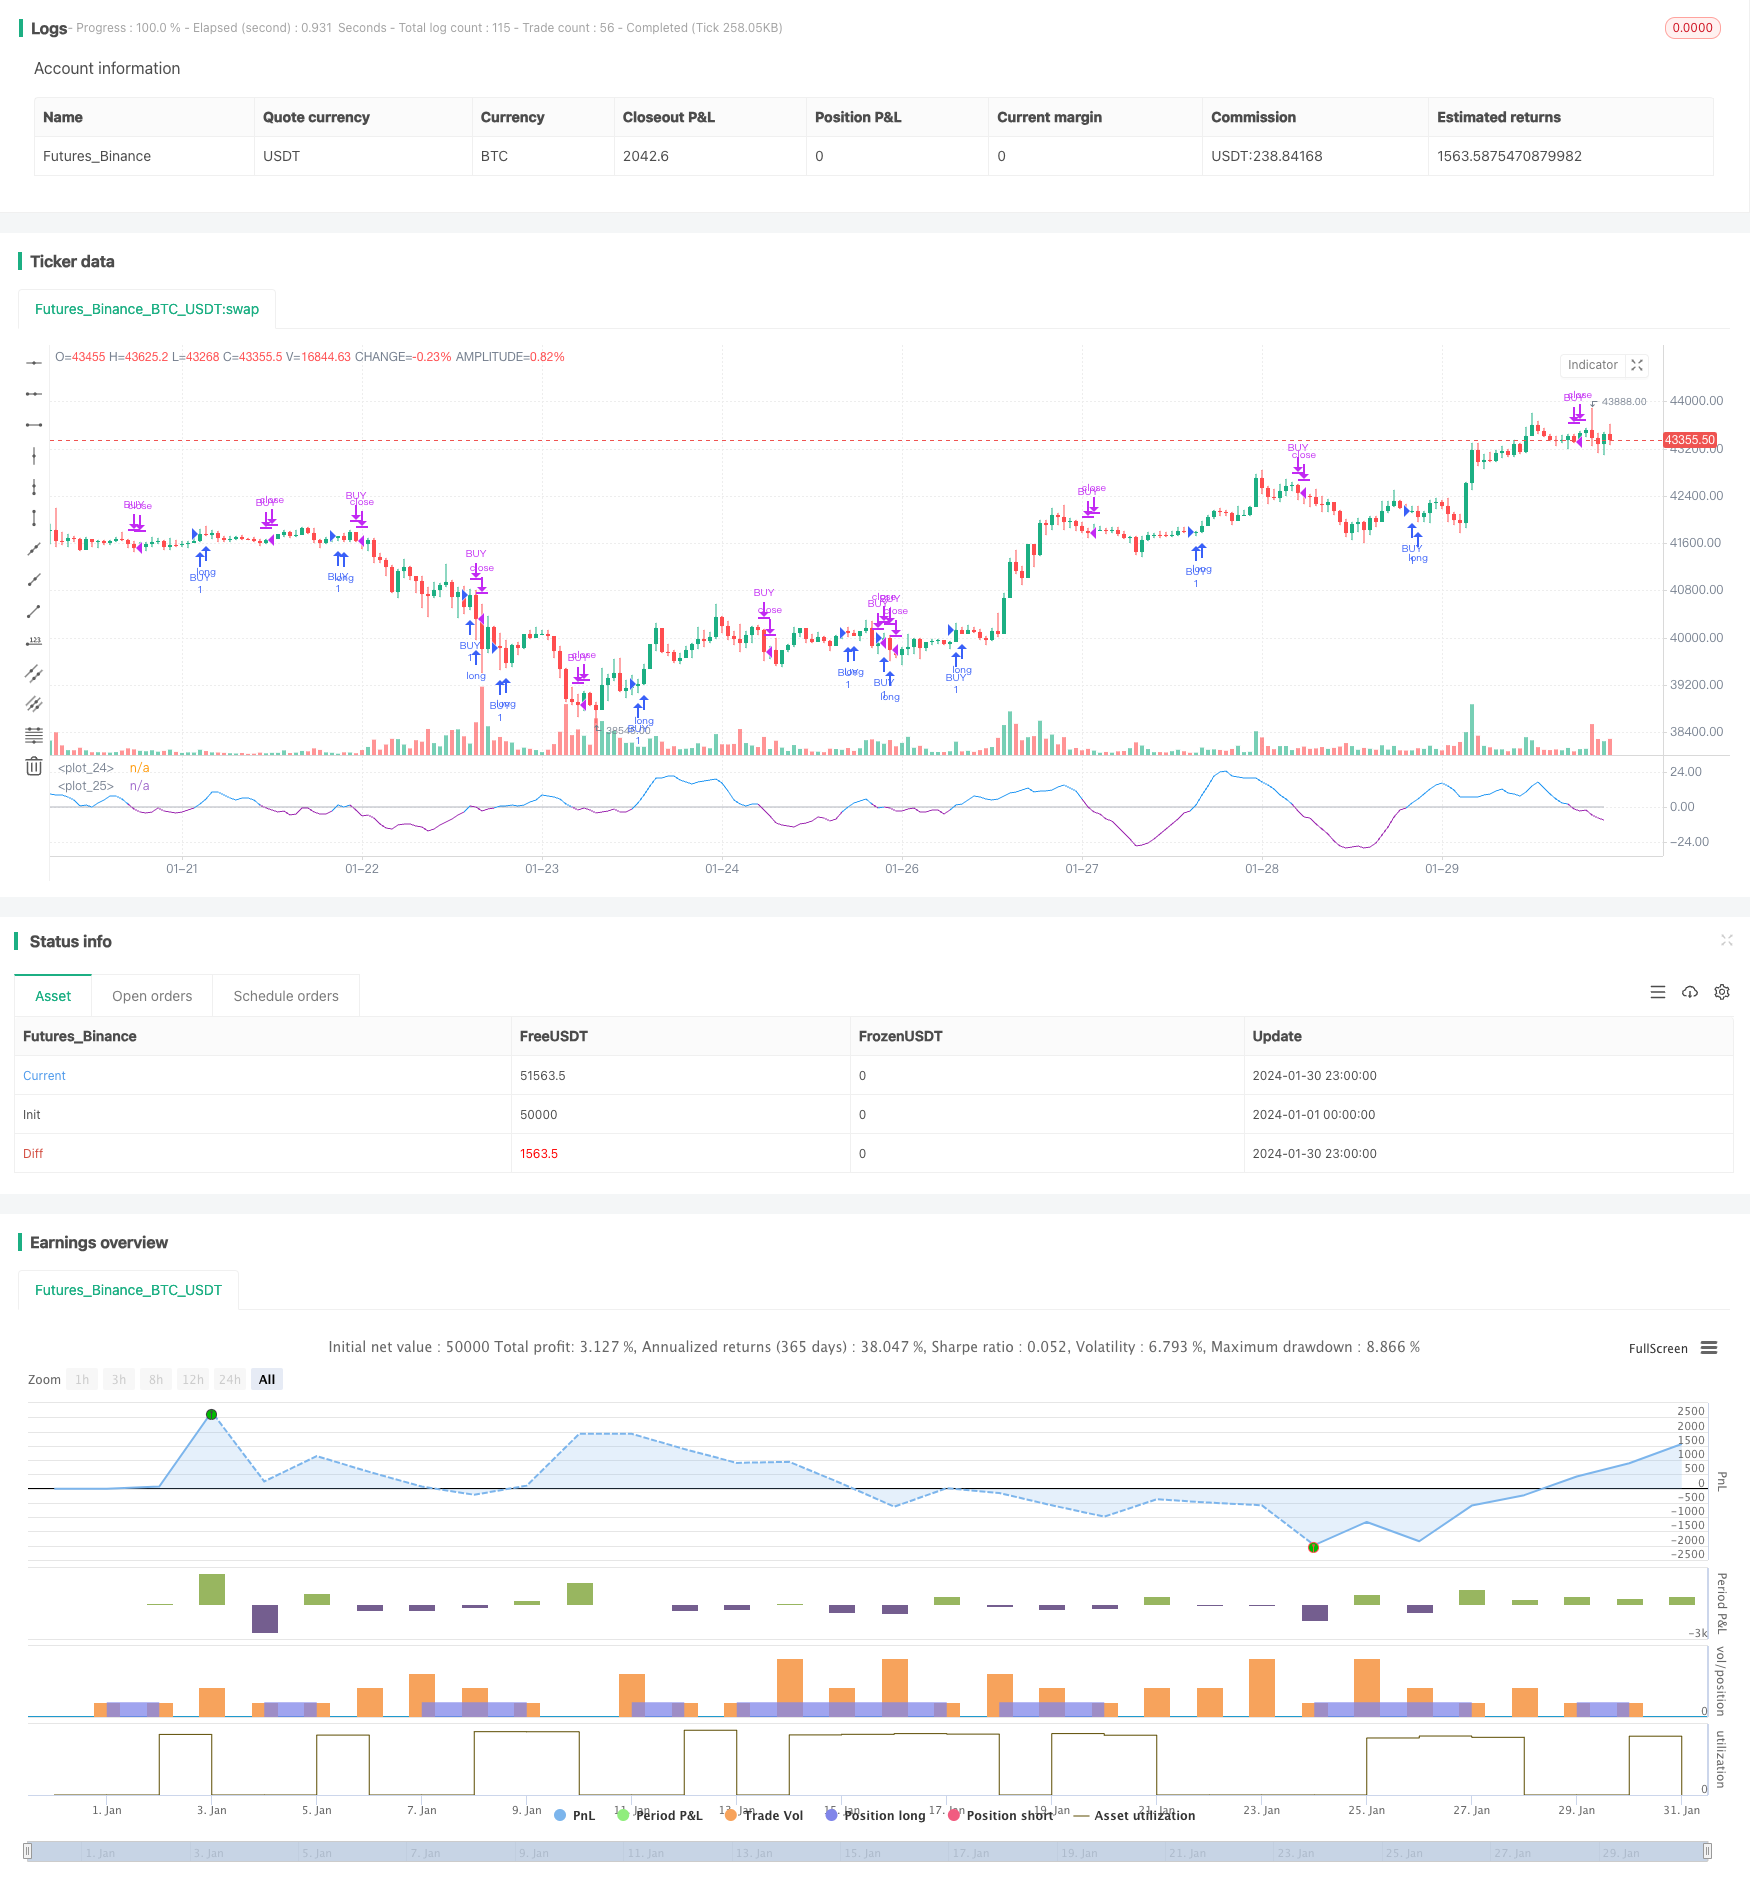
Overview
This strategy uses the crossover of the RSI indicator and its moving average as trading signals, belonging to the common momentum indicator strategies. Its core principle is to track the difference between the RSI indicator and the simple moving average SMA_RSI of RSI, and then calculate the simple moving average SMA_RSI2 of this difference. When SMA_RSI2 crosses above the threshold, go long. When crossing below the threshold, close the position.
Strategy Principle
The strategy uses 3 parameters to calculate the RSI indicator and its two simple moving averages with different periods. First, calculate the regular RSI indicator with period length. Then calculate the length2 period simple moving average SMA_RSI of RSI. Finally, calculate the difference delta between RSI and SMA_RSI, and then calculate the length3 period simple moving average SMA_RSI2 of delta. When SMA_RSI2 crosses above the user-defined threshold, make long trades. When SMA_RSI2 crosses below the threshold, close positions.
Thus, a trading signal strategy based on the crossover of RSI indicator moving averages is formed. Since SMA_RSI2 is the moving average of the difference delta, it can reflect the momentum and trend changes of the RSI indicator, grasping the essence of the RSI indicator itself.
Advantage Analysis
The strategy combines the advantages of RSI indicators and their moving averages to follow price trends and avoid misleading by noise. The idea of calculating the difference delta and then smoothing generates clearer trading signals. Overall, this strategy has smaller drawdowns and more stable profits.
The specific advantages are:
- Using delta to smooth price fluctuations and reduce false signals
- Simple and direct form of moving average crossover, easy to master
- More adjustable parameters to fit the market
- Stable profit, smaller drawdown
Risks and Improvements
There are also some risks in this strategy, mainly reflected in:
- Larger stop loss in significant market moves
- Unstable profit in ranging trends
Improvements can be made in the following aspects:
- Optimize parameters to increase stability
- Add stop loss mechanisms to control single loss
- Combine with other indicators to improve signal quality
Conclusion
This strategy is relatively simple and universal. By increasing the practicality of the RSI indicator itself through delta arithmetic operations and using crossover to judge, it has good drawdown control and is a very practical momentum indicator strategy.
Parameters
| Name | Default | What it controls |
|---|---|---|
| v_input_1 | 2017 | Start Year |
| v_input_2 | 12 | Month |
| v_input_3 | 17 | Day |
| v_input_4 | 3 | RSI period |
| v_input_5 | 21 | RSI SMA-1 |
| v_input_6 | 13 | RSI SMA-2 |
| v_input_7 | false | Threshold |
| v_input_8 | false | Use filter? |
Source Pine Script
/*backtest
start: 2024-01-01 00:00:00
end: 2024-01-31 00:00:00
period: 1h
basePeriod: 15m
exchanges: [{"eid":"Futures_Binance","currency":"BTC_USDT"}]
*/

//@version=4
strategy ("RSI&SMA", overlay=false )
startP = timestamp(input(2017, "Start Year"), input(12, "Month"), input(17, "Day"), 0, 0)
end   = timestamp((9999), (1), (1), 0, 0)
_testPeriod() => true

length = input(3, minval=1, title = "RSI period")
length2 = input(21, minval=1, title = "RSI SMA-1")
length3 = input(13, minval=1, title = "RSI SMA-2")
threshold  = input(0,step=0.5, title="Threshold")
filter = input(false, title="Use filter?")


up = rma (max (change (close), 0), length)
down = rma (-min (change (close), 0), length)
RSI = down == 0? 100: up == 0? 0: 100-100 / (1 + up / down)

SMA_RSI = sma(RSI, length2)
delta = RSI-SMA_RSI
SMA_RSI2 = sma(delta, length3)
Long = crossover(SMA_RSI2, threshold)
Short = crossunder(SMA_RSI2, threshold)

plot(threshold, color=color.silver)
plot(SMA_RSI2, color= SMA_RSI2 > 0 ? color.blue : color.purple)
//plot(SMA_RSI, color=color.green)
//plot(delta, color=color.red)

long_condition =  Long and (filter ? close > ema(close, 200) : true) and _testPeriod()
strategy.entry('BUY', strategy.long, when=long_condition)

short_condition =  Short
strategy.close('BUY', when=short_condition)
Published by ChaoZhang on the FMZ strategy square · last modified 2024-02-01. Collected in the Quant Trading Vault. Unvalidated research: re-test with your own data and costs before trusting it.
Build this with AgenKit
A spec is not a trading system. Paste this into your coding agent and AgenKit runs a specialist team — architecture, test-first build, risk gates, review — with paper trading on by default.
/agenkit build a production-grade trading bot with a backtest engine, risk controls and paper trading by default from strategies/Momentum-Indicator-Crossover-Strategy-440720.md- npx agenkit install engineering-kit in your project
- Paste the command into your agent and approve each phase
- Get tests, backtest, risk controls and a paper-trading switch
Understand it first
Before you run this, read the lesson behind the idea and how to backtest it honestly. Specs like this one are the survivors of an unknown number of trials; deflate their results accordingly.
Related specs
- ADX Momentum Trend StrategyPine Script · Momentum · 10m
- Bollinger Bands Momentum Trend Following Quantitative StrategyPine Script · Momentum · 1d
- KST EMA Momentum Trend Following StrategyPine Script · Momentum · 1d
- MACD Momentum Indicator Backtest StrategyPine Script · Momentum · 1h
- MoonFlag MACD Momentum StochRSI Trading StrategyPine Script · Momentum · 1d
- Multi EMA Trend Momentum Trading Strategy with Risk Management SystemPine Script · Momentum · 1h