Momentum Moving Average Crossover Trading Strategy 439104
This is a momentum trading strategy based on moving average crossover. It uses two exponential moving averages (EMAs) with different periods to identify trading signals. A buying signal is generated when the faster…
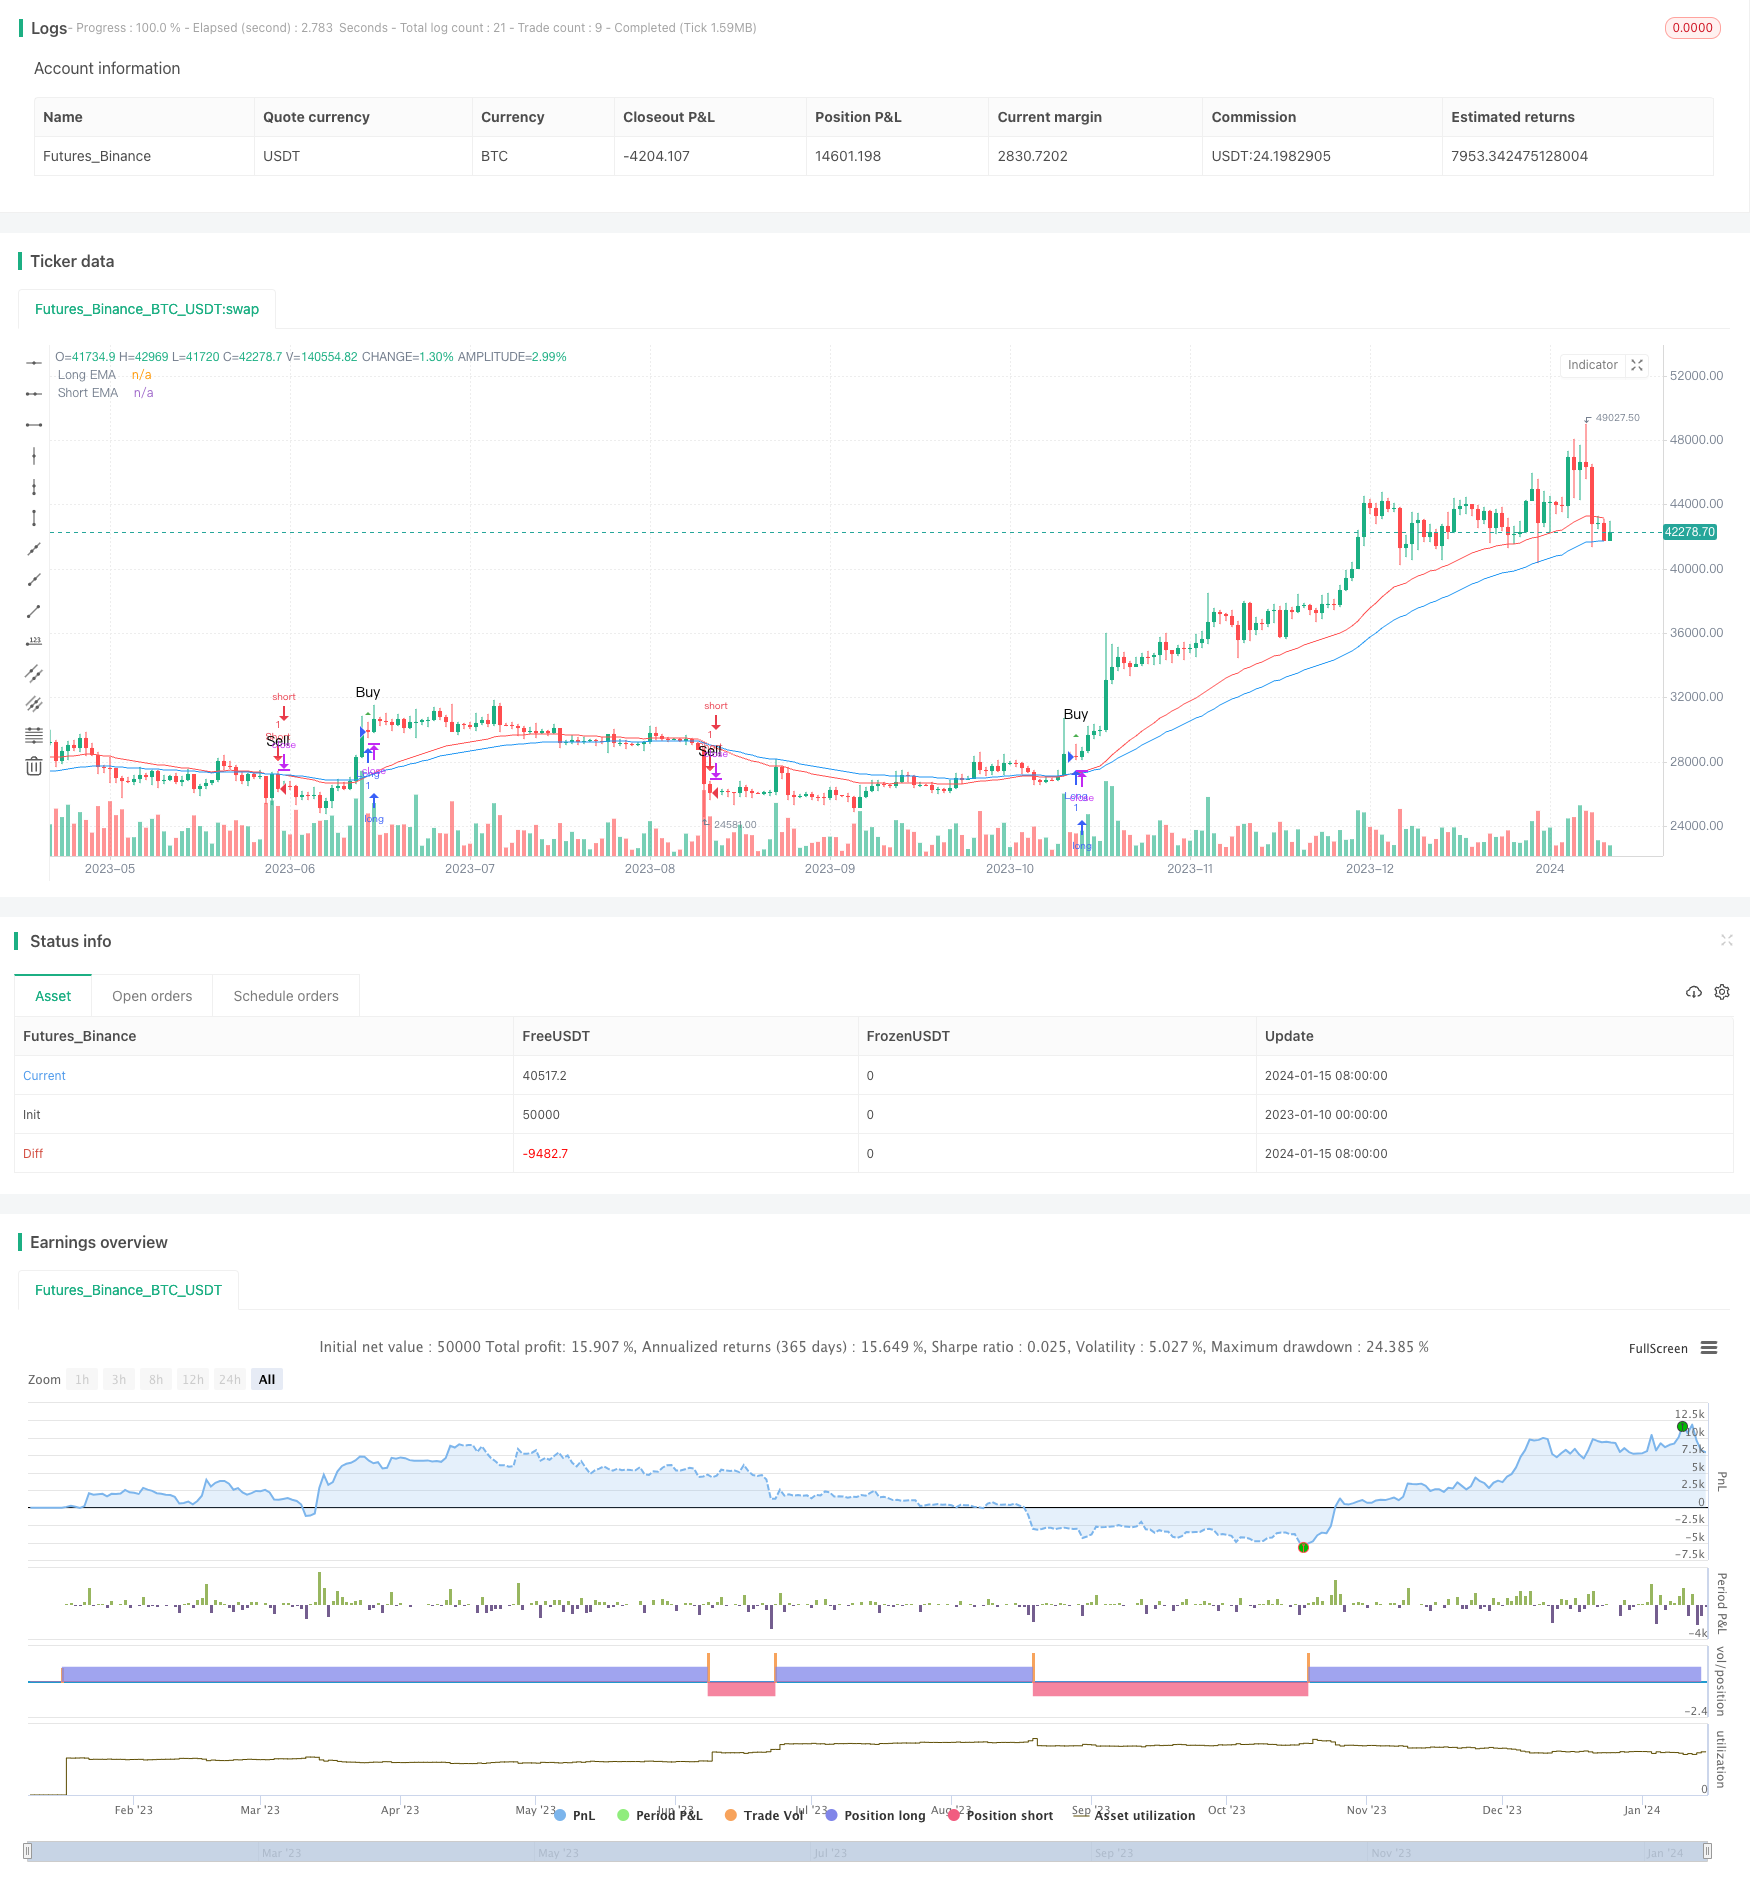
Overview
This is a momentum trading strategy based on moving average crossover. It uses two exponential moving averages (EMAs) with different periods to identify trading signals. A buying signal is generated when the faster EMA crosses above the slower EMA. A selling signal is generated when the faster EMA crosses below the slower EMA.
Principles
The core logic of this strategy is based on the moving average crossover system. EMA stands for Exponential Moving Average. The calculation formula for EMA is: $$EMA_t = \frac{P_t \times k}{1+k}+\frac{EMA_{t-1}\times(1-k)}{1+k}$$ Where $P_t$ is the closing price of the current day, $EMA_{t-1}$ is the EMA value of the previous day, $k = \frac{2}{n+1}$, and n is the EMA period.
The fast EMA period in this strategy is set to 55 and the slow EMA period is set to 34. When the short period EMA crosses above the long period EMA from the bottom up, it indicates the short term moving average starts leading the long term one upwards, generating a golden cross buying signal. On the contrary, when the short period EMA crosses below the long period EMA from the top down, it indicates the short term moving average starts lagging behind the long term one downwards, generating a death cross selling signal.
Advantages
The advantages of this strategy include:
- Simple principles, easy to understand and implement;
- Clear trading signals with good indicator combination effects;
- Flexibility to apply in different market environments for high/low-frequency trading;
- Optimizable parameters to avoid false signals.
Risks and Solutions
There are some risks when using this strategy:
- Potentially more false signals. Solution: Optimize EMA parameters with more stable settings.
- Prone to consolidation market whipsaws. Solution: Use trend filter indicators.
- Unable to tell real market trends or sentiments. Solution: Combine fundamental and volume-price analysis.
Enhancement Directions
The strategy can be enhanced from the following aspects:
- EMA period optimization with more combinations.
- Add stop loss mechanisms like fixed percentage.
- Incorporate volume indicators for filtering signals.
- Add multi-timeframe verification system.
Summary
In summary, this is a very classic and practical short-term trading strategy. It has simple clear signals and flexible application space. Through parameter tuning, filter mechanisms, risk control etc, the strategy's performance can be continuously improved, making it an important tool for high-frequency intraday trading. Overall speaking, this strategy is highly practical with strong application value as a base module for quantified trading.
Parameters
| Name | Default | What it controls |
|---|---|---|
| v_input_1 | 55 | Short EMA Length |
| v_input_2 | 34 | Long EMA Length |
Source Pine Script
/*backtest
start: 2023-01-10 00:00:00
end: 2024-01-16 00:00:00
period: 1d
basePeriod: 1h
exchanges: [{"eid":"Futures_Binance","currency":"BTC_USDT"}]
*/

//@version=5
strategy("mohammad tork strategy", overlay=true)

// Input parameters
lengthShortEMA = input(55, title="Short EMA Length")
lengthLongEMA = input(34, title="Long EMA Length")

// Calculate EMAs
emaShort = ta.ema(close, lengthShortEMA)
emaLong = ta.ema(close, lengthLongEMA)

// Conditions for Long Signal
longCondition = ta.crossover(emaLong, emaShort)

// Conditions for Short Signal
shortCondition = ta.crossunder(emaLong, emaShort)

// Execute Long Signal
strategy.entry("Long", strategy.long, when = longCondition)

// Execute Short Signal
strategy.entry("Short", strategy.short, when = shortCondition)

// Plot EMAs on the chart
plot(emaShort, color=color.blue, title="Short EMA")
plot(emaLong, color=color.red, title="Long EMA")

// Plot Long Signal Icon with Buy Label
plotshape(series=longCondition, title="Long Signal", color=color.green, style=shape.triangleup, location=location.abovebar, size=size.small, text="Buy")

// Plot Short Signal Icon with Sell Label
plotshape(series=shortCondition, title="Short Signal", color=color.red, style=shape.triangledown, location=location.abovebar, size=size.small, text="Sell")
Published by ChaoZhang on the FMZ strategy square · last modified 2024-01-17. Collected in the Quant Trading Vault. Unvalidated research: re-test with your own data and costs before trusting it.
Build this with AgenKit
A spec is not a trading system. Paste this into your coding agent and AgenKit runs a specialist team — architecture, test-first build, risk gates, review — with paper trading on by default.
/agenkit build a production-grade trading bot with a backtest engine, risk controls and paper trading by default from strategies/Momentum-Moving-Average-Crossover-Trading-Strategy-439104.md- npx agenkit install engineering-kit in your project
- Paste the command into your agent and approve each phase
- Get tests, backtest, risk controls and a paper-trading switch
Understand it first
Before you run this, read the lesson behind the idea and how to backtest it honestly. Specs like this one are the survivors of an unknown number of trials; deflate their results accordingly.
Related specs
- ADX Momentum Trend StrategyPine Script · Momentum · 10m
- Advanced Multi Indicator Trend Following and Momentum Quantitative Trading StrategyPine Script · Momentum · 1h
- Bollinger Bands Momentum Trend Following Quantitative StrategyPine Script · Momentum · 1d
- Cross Period Momentum EMA Strategy with RSI and Dynamic ATR Stop LossPine Script · Momentum · 1d
- Dual EMA Crossover with RSI Momentum Enhanced Trading StrategyPine Script · Momentum · 1d
- Dual EMA Momentum Trend Trading Strategy with Full Body Candle Signal SystemPine Script · Momentum · 2h