Momentum Moving Average Crossover Trading Strategy 439830
This strategy generates trading signals based on the crossover between fast and slow moving average lines to determine market trends and entry points. When the fast EMA crosses above the slow EMA, it is judged that…
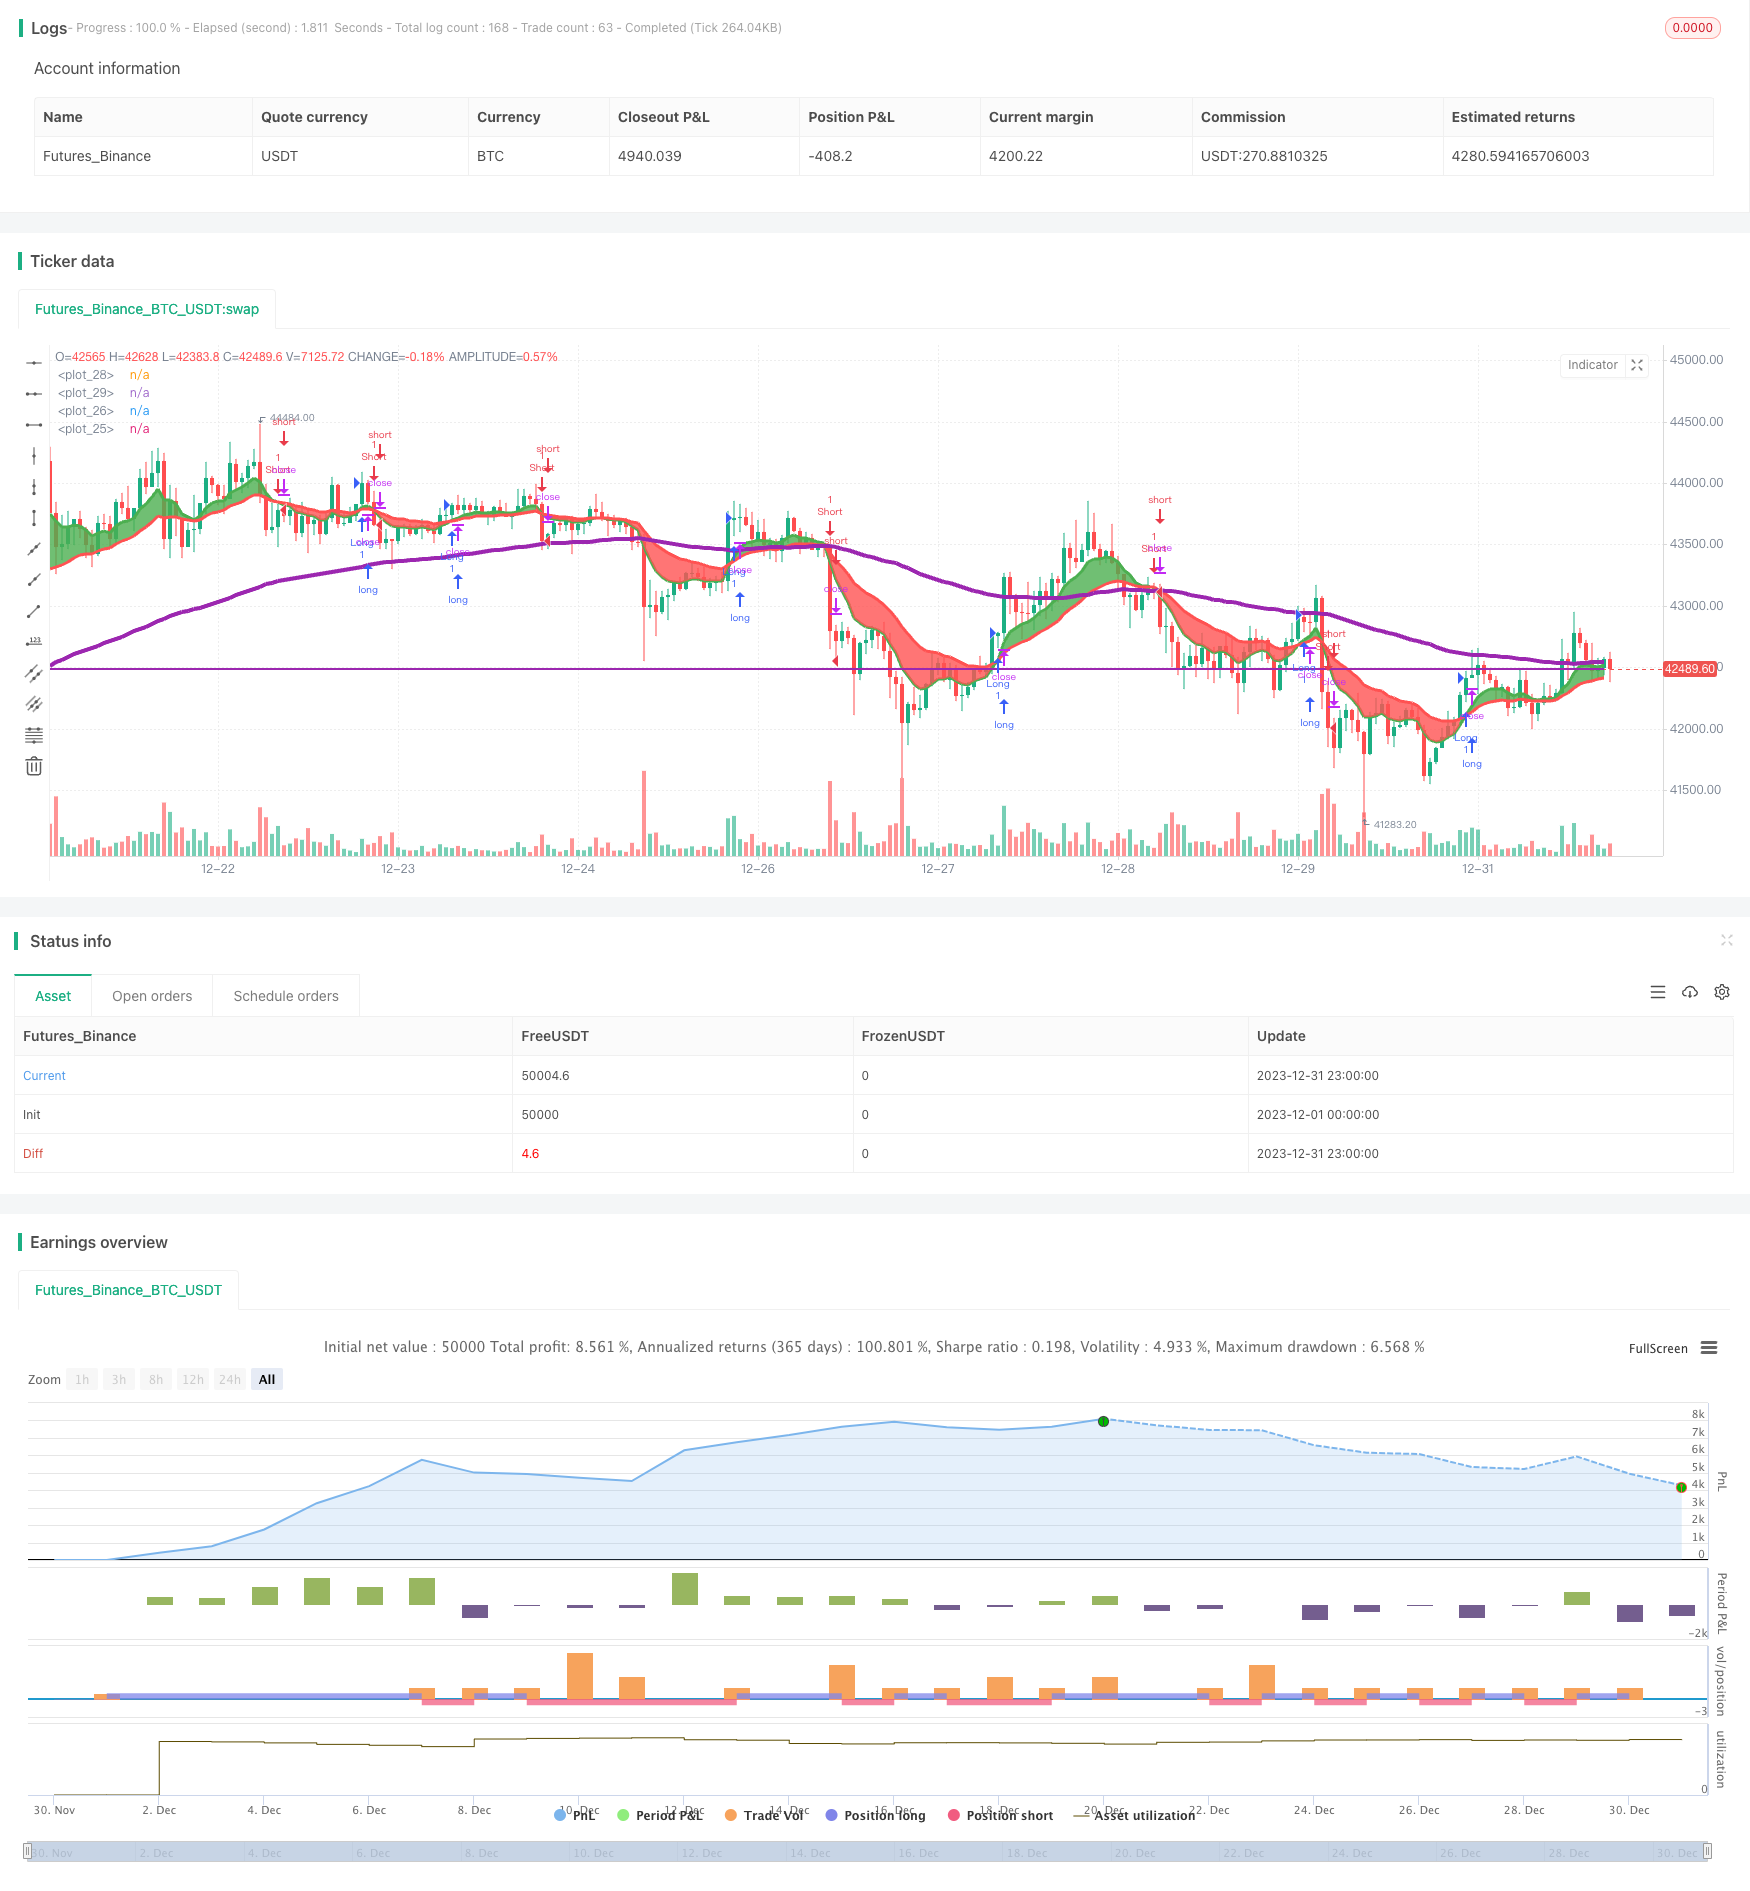
Overview
This strategy generates trading signals based on the crossover between fast and slow moving average lines to determine market trends and entry points. When the fast EMA crosses above the slow EMA, it is judged that the market is in an upward trend and a buy signal is generated. When the fast EMA crosses below the slow EMA, it is judged that the market is in a downward trend and a sell signal is generated. The strategy also sets stop loss and take profit prices to manage risks.
Strategy Logic
The strategy uses the crossover between a fast EMA (8-day) and slow EMA (21-day) to determine market trend. The specific logic is:
- Calculate the 8-day EMA and 21-day EMA
- When the 8-day EMA crosses above the 21-day EMA, it is determined that the market trend has reversed and an upward trend has started
- When the 8-day EMA crosses below the 21-day EMA, it is determined that the market trend has reversed and a downward trend has started
- During an uptrend, a buy signal is generated. During a downtrend, a sell signal is generated
- Set stop loss and take profit prices to manage risks for each position
The strategy combines momentum indicators and trend analysis to effectively capture market direction and reversal points. The fast and slow EMA crossover along with the moving average can filter out some noisy trading signals.
Advantage Analysis
The main advantages of this strategy are:
- Fast and slow EMA crosses can effectively determine market trends and trading signals
- Large optimization space for strategy parameters where EMA periods can be further tuned
- Noise signals can be filtered out effectively by incorporating momentum indicators
- Active risk control by configuring stop loss and take profit logic
In summary, the strategy combines trend and momentum indicators. Through parameter tuning, it can adapt to different market environments and is a relatively flexible short-term trading strategy.
Risk Analysis
There are also some risks with this strategy:
- In ranging markets, frequent EMA crossover signals may generate more false trades
- Gap risk is not handled effectively
- Long-term trend direction is not considered
To address these risks, some optimizations can be made:
- Add other filters like Bollinger Bands, KDJ to reduce false signals
- Incorporate higher timeframe indicators to determine long-term trend
- Optimize parameters like EMA lengths to adapt to different markets
- Manual intervention to avoid huge slippage losses from gaps
Optimization Directions
There is still large room for optimizing this strategy:
- Optimize EMA period parameters based on historical performance
- Add other technical indicators for signal filtering e.g. KDJ, MACD to improve accuracy
- Optimize stop loss and take profit settings to better fit market characteristics
- Use machine learning techniques for automated parameter optimization
These measures can greatly improve the stability, adaptability and profitability of the strategy.
Conclusion
In conclusion, this is a typical short-term trading strategy based on trend following and momentum indicator crosses. It combines EMA crossover logic and stop loss/take profit to quickly capture directional market opportunities. There is ample room for optimization by introducing other assist indicators and automated parameter tuning methods, which can make the strategy performance more stable and outstanding. It suits investors who have some market understanding and are willing to trade frequently.
Parameters
| Name | Default | What it controls |
|---|---|---|
| v_input_int_1 | 8 | Fast EMA Length |
| v_input_int_2 | 21 | Slow EMA Length |
| v_input_string_1 | 0 | Sides: Both | Short | Long | None |
| v_input_string_2 | 0 | Percent or Pips: Percent | Pips |
| v_input_float_1 | false | Stop Loss Long |
| v_input_float_2 | false | Stop Loss Short |
| v_input_float_3 | false | Target Profit Long |
| v_input_float_4 | false | Target Profit Short |
| v_input_1 | timestamp(01 Jan 2021 00:00 +0000) | (?Date Range)Start Time |
| v_input_2 | timestamp(31 Dec 2023 23:59 +0000) | End Time |
Source Pine Script
/*backtest
start: 2023-12-01 00:00:00
end: 2023-12-31 23:59:59
period: 1h
basePeriod: 15m
exchanges: [{"eid":"Futures_Binance","currency":"BTC_USDT"}]
*/

// This source code is subject to the terms of the Mozilla Public License 2.0 at https://mozilla.org/MPL/2.0/
// © TradersPostInc

//@version=5
strategy('TradersPost Example MOMO Strategy', overlay=true)

startTime = input(defval = timestamp('01 Jan 2021 00:00 +0000'), title = 'Start Time', group = 'Date Range')
endTime = input(defval = timestamp('31 Dec 2023 23:59 +0000'), title = 'End Time', group = 'Date Range')
timeCondition = true
timeConditionEnd = timeCondition[1] and not timeCondition

fastEmaLength = input.int(defval = 8, title = 'Fast EMA Length')
slowEmaLength = input.int(defval = 21, title = 'Slow EMA Length')
sides = input.string(defval = 'Both', title = 'Sides', options = ['Long', 'Short', 'Both', 'None'])

fastEma = ta.ema(close, fastEmaLength)
slowEma = ta.ema(close, slowEmaLength)

isUptrend = fastEma >= slowEma
isDowntrend = fastEma <= slowEma
trendChanging = ta.cross(fastEma, slowEma)

ema105 = request.security(syminfo.tickerid, '30', ta.ema(close, 105)[1], barmerge.gaps_off, barmerge.lookahead_on)
ema205 = request.security(syminfo.tickerid, '30', ta.ema(close, 20)[1], barmerge.gaps_off, barmerge.lookahead_on)
plot(ema105, linewidth=4, color=color.new(color.purple, 0), editable=true)
plot(ema205, linewidth=2, color=color.new(color.purple, 0), editable=true)

aa = plot(fastEma, linewidth=3, color=color.new(color.green, 0), editable=true)
bb = plot(slowEma, linewidth=3, color=color.new(color.red, 0), editable=true)
fill(aa, bb, color=isUptrend ? color.green : color.red, transp=90)

tradersPostBuy = trendChanging and isUptrend and timeCondition
tradersPostSell = trendChanging and isDowntrend and timeCondition

pips = syminfo.pointvalue / syminfo.mintick

percentOrPipsInput = input.string('Percent', title='Percent or Pips', options=['Percent', 'Pips'])

stopLossLongInput = input.float(defval=0, step=0.01, title='Stop Loss Long', minval=0)
stopLossShortInput = input.float(defval=0, step=0.01, title='Stop Loss Short', minval=0)

takeProfitLongInput = input.float(defval=0, step=0.01, title='Target Profit Long', minval=0)
takeProfitShortInput = input.float(defval=0, step=0.01, title='Target Profit Short', minval=0)

stopLossPriceLong = ta.valuewhen(tradersPostBuy, close, 0) * (stopLossLongInput / 100) * pips
stopLossPriceShort = ta.valuewhen(tradersPostSell, close, 0) * (stopLossShortInput / 100) * pips

takeProfitPriceLong = ta.valuewhen(tradersPostBuy, close, 0) * (takeProfitLongInput / 100) * pips
takeProfitPriceShort = ta.valuewhen(tradersPostSell, close, 0) * (takeProfitShortInput / 100) * pips

takeProfitALong = takeProfitLongInput > 0 ? takeProfitLongInput : na
takeProfitBLong = takeProfitPriceLong > 0 ? takeProfitPriceLong : na

takeProfitAShort = takeProfitShortInput > 0 ? takeProfitShortInput : na
takeProfitBShort = takeProfitPriceShort > 0 ? takeProfitPriceShort : na

stopLossALong = stopLossLongInput > 0 ? stopLossLongInput : na
stopLossBLong = stopLossPriceLong > 0 ? stopLossPriceLong : na

stopLossAShort = stopLossShortInput > 0 ? stopLossShortInput : na
stopLossBShort = stopLossPriceShort > 0 ? stopLossPriceShort : na

takeProfitLong = percentOrPipsInput == 'Pips' ? takeProfitALong : takeProfitBLong
stopLossLong = percentOrPipsInput == 'Pips' ? stopLossALong : stopLossBLong
takeProfitShort = percentOrPipsInput == 'Pips' ? takeProfitAShort : takeProfitBShort
stopLossShort = percentOrPipsInput == 'Pips' ? stopLossAShort : stopLossBShort

buyAlertMessage = '{"ticker": "' + syminfo.ticker + '", "action": "buy", "price": ' + str.tostring(close) + '}'
sellAlertMessage = '{"ticker": "' + syminfo.ticker + '", "action": "sell", "price": ' + str.tostring(close) + '}'

exitLongAlertMessage = '{"ticker": "' + syminfo.ticker + '", "action": "exit", "price": ' + str.tostring(close) + '}'
exitShortAlertMessage = '{"ticker": "' + syminfo.ticker + '", "action": "exit", "price": ' + str.tostring(close) + '}'

if (sides != "None")
    if tradersPostBuy
        strategy.entry('Long', strategy.long, when = sides != 'Short', alert_message = buyAlertMessage)
        strategy.close('Short', when = sides == "Short" and timeCondition, alert_message = exitShortAlertMessage)

    if tradersPostSell
        strategy.entry('Short', strategy.short, when = sides != 'Long', alert_message = sellAlertMessage)
        strategy.close('Long', when = sides == 'Long', alert_message = exitLongAlertMessage)

exitAlertMessage = '{"ticker": "' + syminfo.ticker + '", "action": "exit"}'

strategy.exit('Exit Long', from_entry = "Long", profit = takeProfitLong, loss = stopLossLong, alert_message = exitAlertMessage)
strategy.exit('Exit Short', from_entry = "Short", profit = takeProfitShort, loss = stopLossShort, alert_message = exitAlertMessage)

strategy.close_all(when = timeConditionEnd)Published by ChaoZhang on the FMZ strategy square · last modified 2024-01-24. Collected in the Quant Trading Vault. Unvalidated research: re-test with your own data and costs before trusting it.
Build this with AgenKit
A spec is not a trading system. Paste this into your coding agent and AgenKit runs a specialist team — architecture, test-first build, risk gates, review — with paper trading on by default.
/agenkit build a production-grade trading bot with a backtest engine, risk controls and paper trading by default from strategies/Momentum-Moving-Average-Crossover-Trading-Strategy-439830.md- npx agenkit install engineering-kit in your project
- Paste the command into your agent and approve each phase
- Get tests, backtest, risk controls and a paper-trading switch
Understand it first
Before you run this, read the lesson behind the idea and how to backtest it honestly. Specs like this one are the survivors of an unknown number of trials; deflate their results accordingly.
Related specs
- ADX Momentum Trend StrategyPine Script · Momentum · 10m
- Advanced Multi Indicator Trend Following and Momentum Quantitative Trading StrategyPine Script · Momentum · 1h
- Bollinger Bands Momentum Trend Following Quantitative StrategyPine Script · Momentum · 1d
- Moving Average Candle Regression StrategyPine Script · Momentum · 15m
- Multi Timeframe Unified Strategy Based on Quantitative Momentum and Convergence DivergencePine Script · Momentum · 1d
- Dual Moving Average Crossover with RSI Momentum Enhancement StrategyPine Script · Momentum · 1d