Momentum Tracking Strategy Based on Indicator Integration
This strategy is based on a custom indicator integrator to determine price trend direction by accumulating the sum of distances between price and moving average, and thus track the trend.
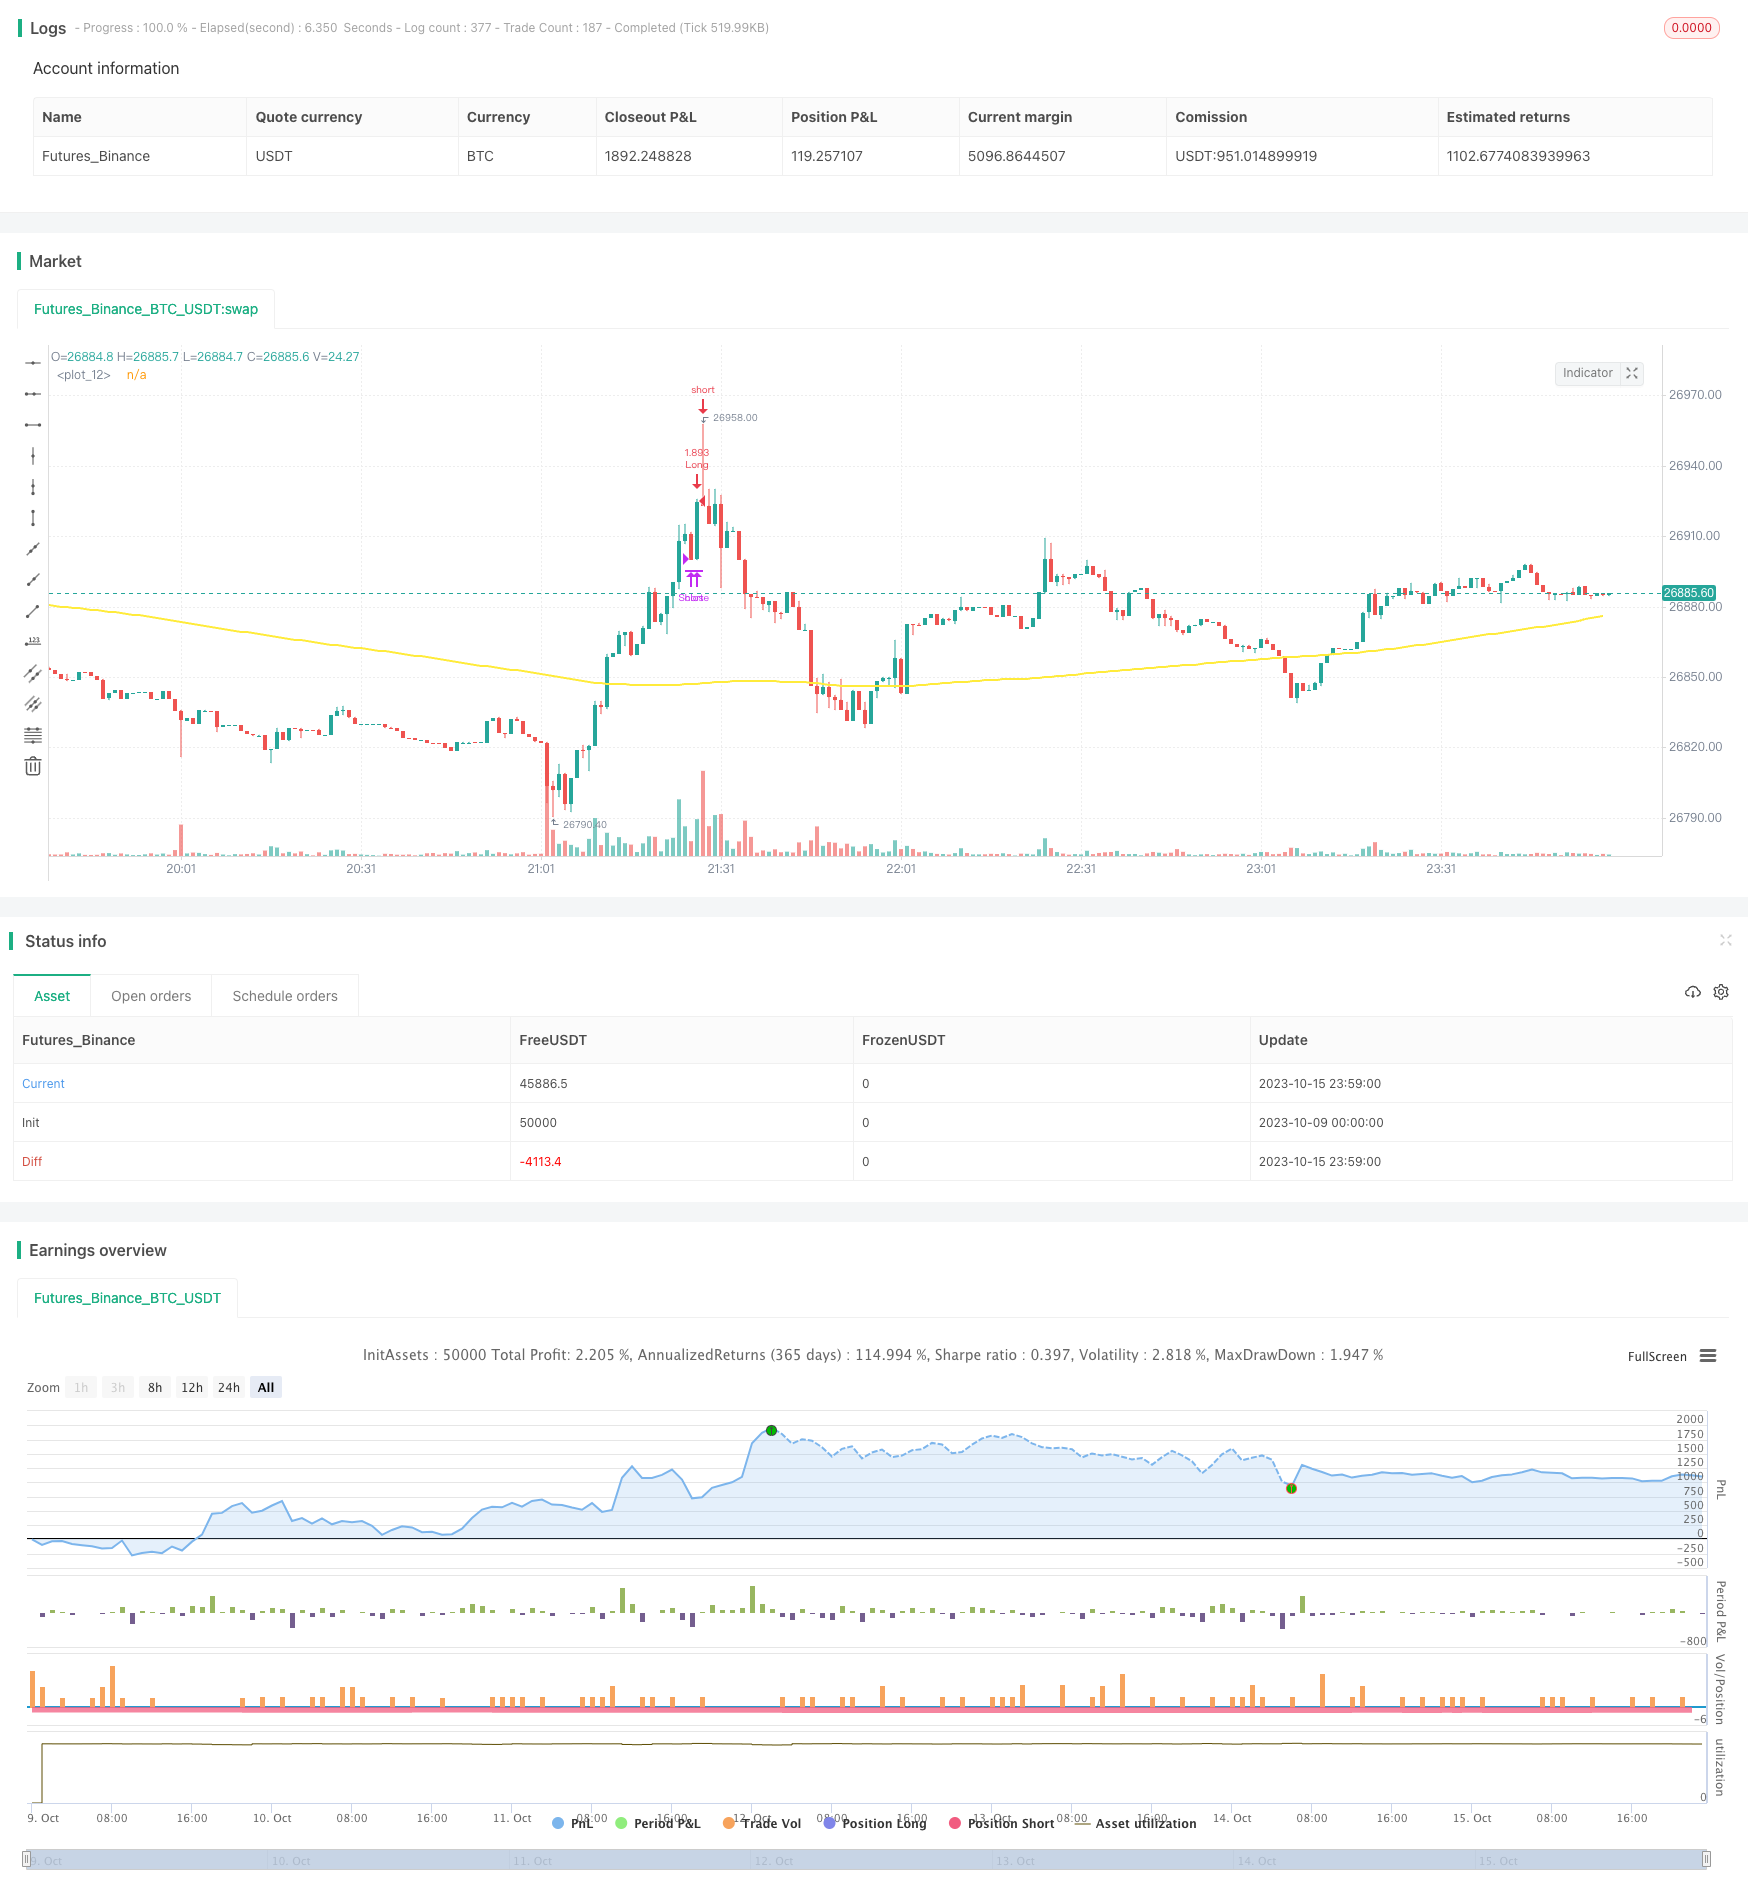
Overview
This strategy is based on a custom indicator integrator to determine price trend direction by accumulating the sum of distances between price and moving average, and thus track the trend.
Strategy Logic
The strategy uses a custom indicator to integrate the distance between price and moving average, implemented as follows:
Calculate the distance between price and 200-period simple moving average k=close-sma(close,200)
Define integration period s=29, accumulate the sum of k over last s periods: sum = 0, for i = 0 to s, sum := sum + k[i]
When sum>0, long signal is generated. When sum<0, short signal is generated.
When long position is opened, if sum<0, close long position. When short position is opened, if sum>0, close short position.
The strategy judges overall trend direction by tracking whether the accumulated sum of distance between price and moving average is positive or negative. When the integral is positive, it indicates an upward trend and long position should be held. When the integral is negative, it indicates a downward trend and short position should be held.
Advantages
The custom indicator integrator can effectively determine price trend direction.
The integration concept accumulates distance between price and MA, improving trend determination accuracy.
Relatively simple logic, easy to understand and optimize.
Flexible adjustment of integration period to optimize sensitivity.
Good backtest results, stable profits, applicable in live trading.
Risks
Improper integration period setting may cause insensitive reaction and miss trend turning points.
Improper MA length setting may cause misjudgment of trend.
Sudden big events may cause wrong signals.
Improper symbol selection, highly volatile symbols may deteriorate effectiveness.
Corresponding solutions:
Optimize integration period for better sensitivity.
Test different MA lengths to find optimal one for trend determination.
Close strategy before major events to avoid errors from big price changes.
Select low volatility symbols for better performance.
Improvement Directions
Consider adding other indicators like RSI for comprehensive determination.
Research integration results using different types of MA.
Try auto optimizing integration period for different symbols.
Add volume indicators to avoid errors during huge price swings.
Use machine learning to auto optimize parameters for robustness.
Conclusion
This strategy judges trend direction using a custom indicator integrator by accumulating the distance between price and MA. The logic is simple and clear, and backtest results are good. It can be improved by adjusting integration parameters, adding auxiliary indicators, auto optimization etc. for more reliable practical application. Overall it is an applicable quantitative trend tracking strategy.
Parameters
| Name | Default | What it controls |
|---|---|---|
| v_input_1 | 170 | Length for indicator |
| v_input_2 | 29 | Length of summation |
| v_input_3 | false | Take Profit |
| v_input_4 | false | Stop Loss |
| v_input_5 | false | Trailing Stop Loss |
| v_input_6 | false | Trailing Stop Loss Offset |
Source Pine Script
/*backtest
start: 2023-10-09 00:00:00
end: 2023-10-16 00:00:00
period: 1m
basePeriod: 1m
exchanges: [{"eid":"Futures_Binance","currency":"BTC_USDT"}]
*/

//@version=2
strategy("Indicator Integrator Strat",default_qty_type = strategy.percent_of_equity, default_qty_value = 100,currency="USD",initial_capital=100, overlay=true)

l = input(defval=170,title="Length for indicator")
s = input(title="Length of summation",defval=29)
a= sma(close,l)
r=roc(close,l)
k=close-a
sum = 0
for i = 0 to s
    sum := sum + k[i]
plot(a,color=yellow,linewidth=2,transp=0)
//bc =  iff( sum > 0, white, teal)
//plot(sum,color=bc, transp=20, linewidth=3,style=columns)
//plot(sma(sum,3),color=white)
//hline(0)

inpTakeProfit = input(defval = 0, title = "Take Profit", minval = 0)
inpStopLoss = input(defval = 0, title = "Stop Loss", minval = 0)
inpTrailStop = input(defval = 0, title = "Trailing Stop Loss", minval = 0)
inpTrailOffset = input(defval = 0, title = "Trailing Stop Loss Offset", minval = 0)
useTakeProfit = inpTakeProfit >= 1 ? inpTakeProfit : na
useStopLoss = inpStopLoss >= 1 ? inpStopLoss : na
useTrailStop = inpTrailStop >= 1 ? inpTrailStop : na
useTrailOffset = inpTrailOffset >= 1 ? inpTrailOffset : na


longCondition = sum>0
exitlong = sum<0

shortCondition = sum<0
exitshort = sum>0

strategy.entry(id = "Long", long=true, when = longCondition)
strategy.close(id = "Long", when = exitlong)
strategy.exit("Exit Long", from_entry = "Long", profit = useTakeProfit, loss = useStopLoss, trail_points = useTrailStop, trail_offset = useTrailOffset, when=exitlong)

strategy.entry(id = "Short", long=false, when = shortCondition)
strategy.close(id = "Short", when = exitshort)
strategy.exit("Exit Short", from_entry = "Short", profit = useTakeProfit, loss = useStopLoss, trail_points = useTrailStop, trail_offset = useTrailOffset, when=exitshort)
Published by ChaoZhang on the FMZ strategy square · last modified 2023-10-17. Collected in the Quant Trading Vault. Unvalidated research: re-test with your own data and costs before trusting it.
Build this with AgenKit
A spec is not a trading system. Paste this into your coding agent and AgenKit runs a specialist team — architecture, test-first build, risk gates, review — with paper trading on by default.
/agenkit build a production-grade trading bot with a backtest engine, risk controls and paper trading by default from strategies/Momentum-Tracking-Strategy-Based-on-Indicator-Integration.md- npx agenkit install engineering-kit in your project
- Paste the command into your agent and approve each phase
- Get tests, backtest, risk controls and a paper-trading switch
Understand it first
Before you run this, read the lesson behind the idea and how to backtest it honestly. Specs like this one are the survivors of an unknown number of trials; deflate their results accordingly.
Related specs
- ADX Momentum Trend StrategyPine Script · Momentum · 10m
- Bollinger Bands Momentum Trend Following Quantitative StrategyPine Script · Momentum · 1d
- Cross Momentum Trend Following Strategy SMA RSI Cross Momentum SystemPine Script · Momentum · 1h
- KST EMA Momentum Trend Following StrategyPine Script · Momentum · 1d
- MACD Momentum Indicator Backtest StrategyPine Script · Momentum · 1h
- Momentum Enhanced Simple Moving Average and RSI Strategy for Trend FollowingPine Script · Momentum · 6m