Moonshot Dual Triangle Breakout Strategy
This strategy constructs dual triangle channels combined with Super Trend indicators to identify breakout directions for high-winrate chasing operations. It also uses EMA to determine overall market trend to avoid…
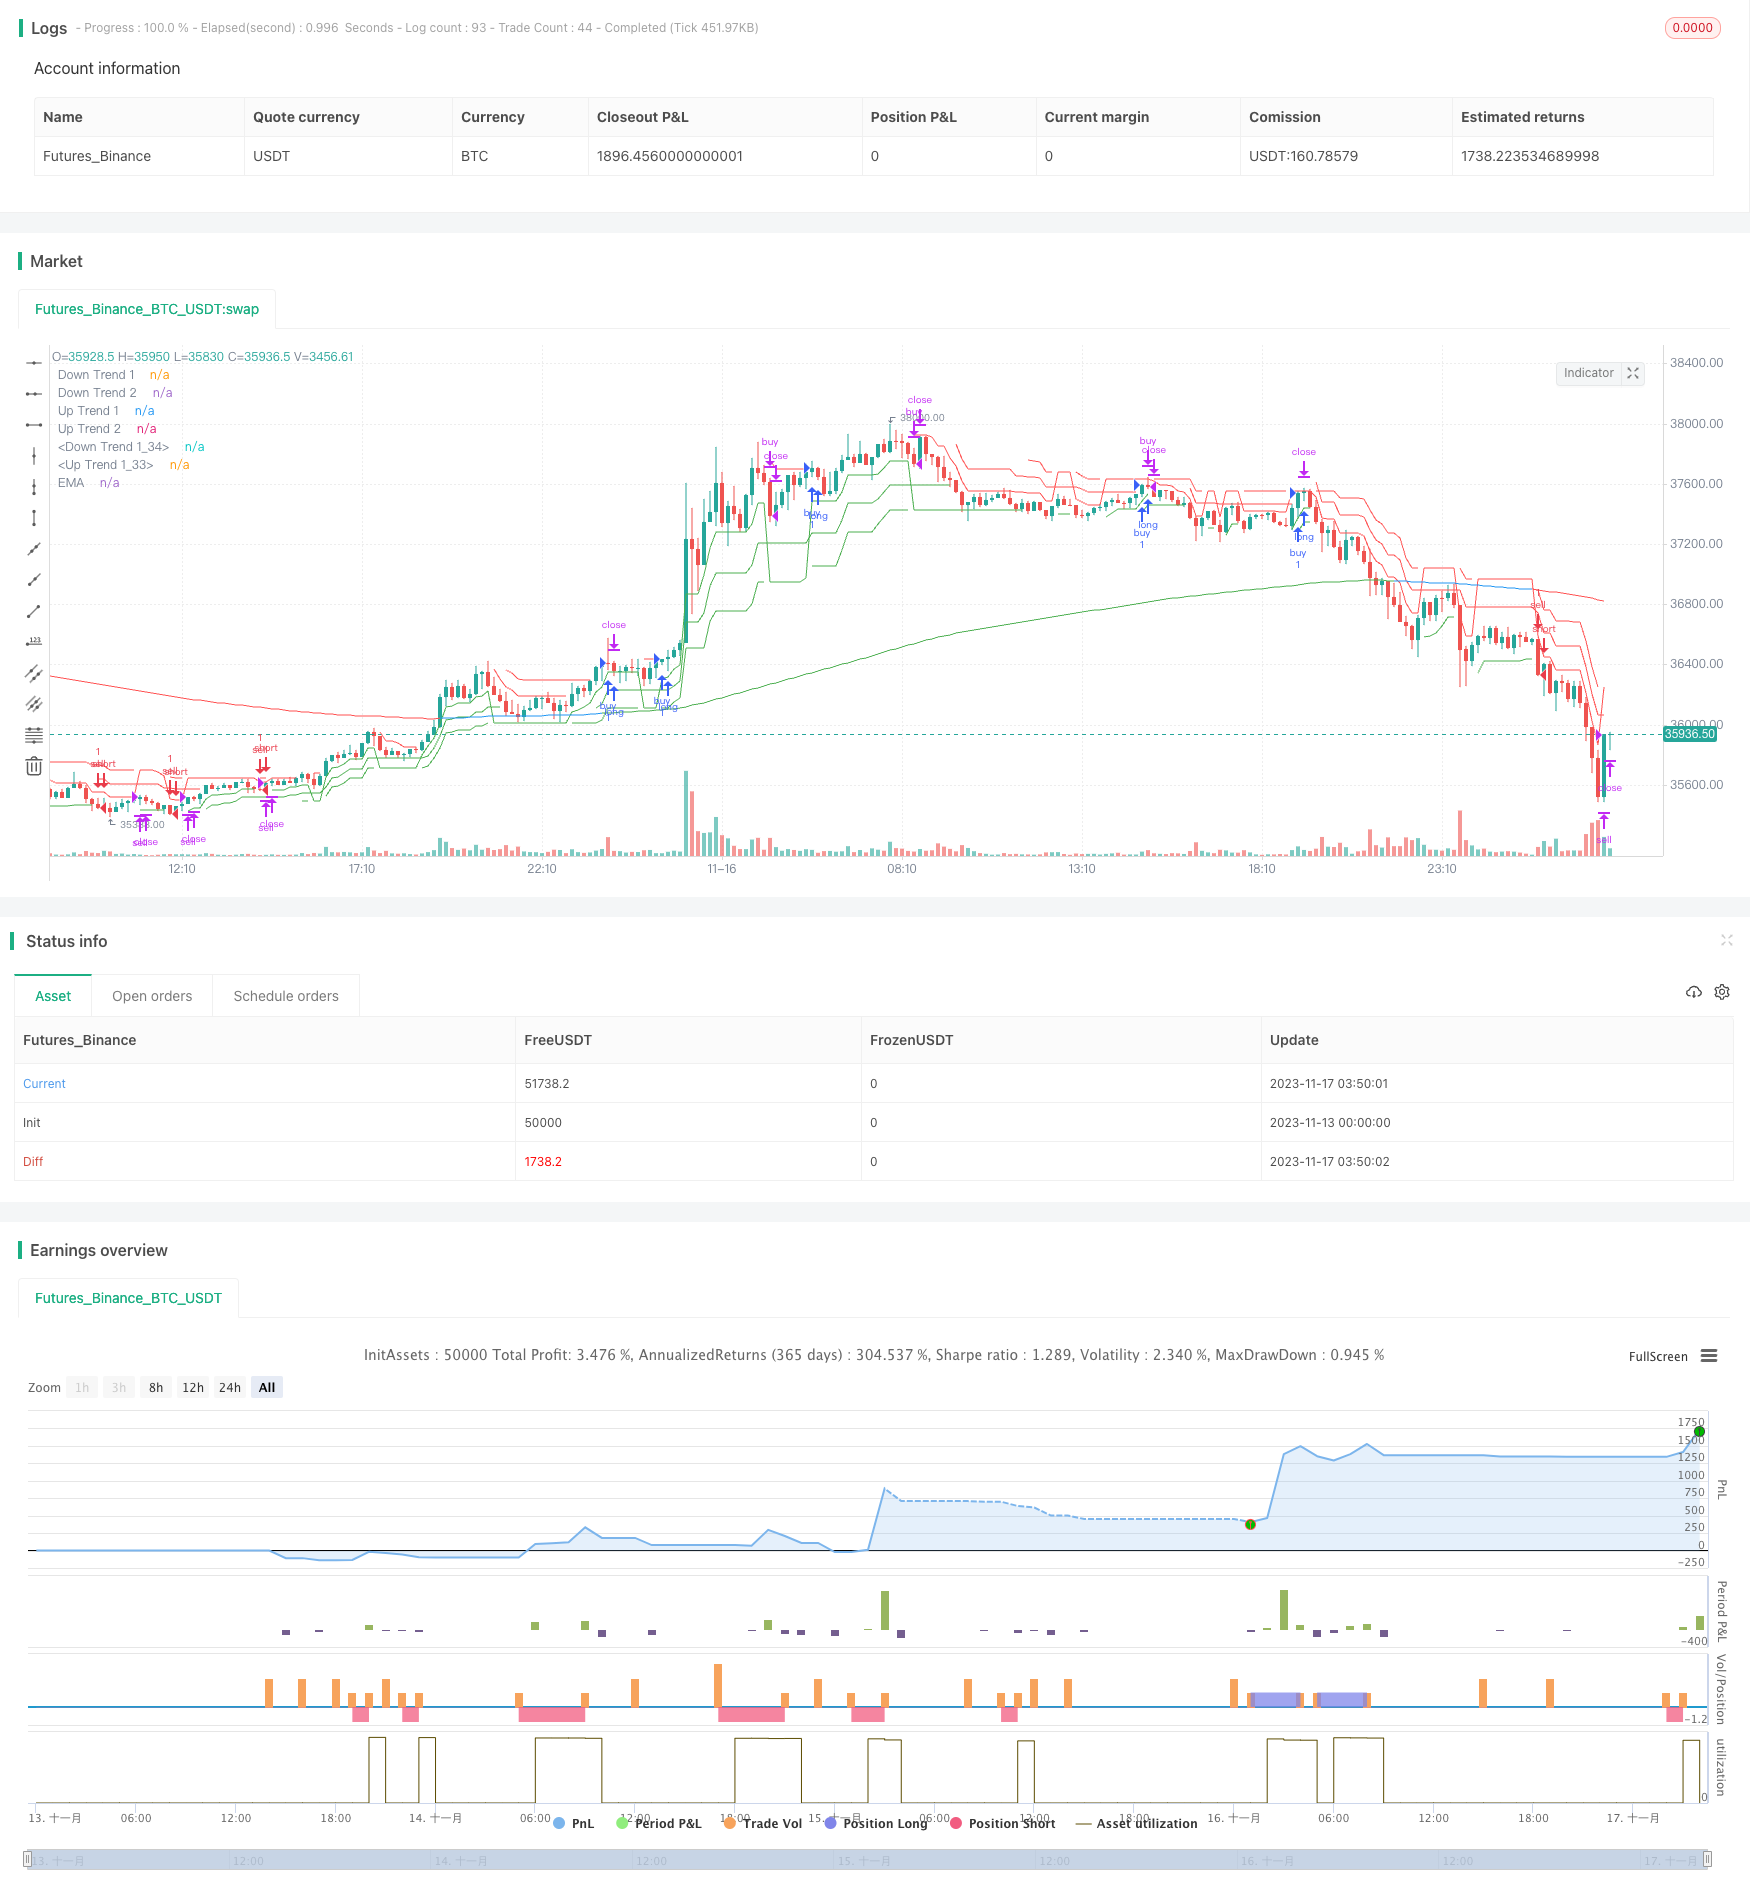
Overview
This strategy constructs dual triangle channels combined with Super Trend indicators to identify breakout directions for high-winrate chasing operations. It also uses EMA to determine overall market trend to avoid ineffective trades in ranging markets.
Strategy Logic
Build 3 Super Trends with different parameters to judge short-term, medium-term and long-term trend directions of the price.
Use the dual triangle channel to determine if the price breaks out the upper or lower channel as entry and exit signals.
Combine the 233-period EMA to determine overall trend direction. Go long when price breaks out the upper channel in an uptrend market and go short when breaking out the lower channel in a downtrend market judged by EMA.
Use the crossover signals of the 3 Super Trends to determine take profit and stop loss. Close positions when 2 or more indicators change color.
Advantages
The dual triangle channel combined with multiple timeframes can accurately capture trending breakouts.
Multi-layer screening avoids ineffective trades and improves win rate.
Dynamic trailing stop loss reduces drawdown risk.
Simple parameter setup makes it easy to use.
Risks & Optimization
Frequent position opening and stop loss in ranging markets. Adjust ATR periods to reduce trade frequency.
EMA period too short fails to catch the trend, too long lags the trend change. Optimize EMA parameter through backtest.
Static stop loss fails to adapt dynamic market volatility. Consider using ATR to trail stop levels.
Conclusion
The Moonshot Dual Triangle Breakout Strategy precisely captures strong breakouts through the combination of Super Trend and dual triangle channel. Multi-layer filters avoid bad signals and achieve high win rate. Simple parameter setup makes it easy to use. Further enhancements on ATR periods and stop loss design can improve its chasing and risk control capabilities.
Parameters
| Name | Default | What it controls |
|---|---|---|
| v_input_1 | 10 | ATR Length 1 |
| v_input_float_1 | true | ATR Factor 1 |
| v_input_2 | 11 | ATR Length 2 |
| v_input_float_2 | 2 | ATR Factor 2 |
| v_input_3 | 12 | ATR Length 3 |
| v_input_float_3 | 3 | ATR Factor 3 |
| v_input_int_1 | 233 | Trend-EMA Length |
| v_input_4_close | 0 | Source: close | high | low | open | hl2 | hlc3 | hlcc4 | ohlc4 |
| v_input_int_2 | false | Offset |
| v_input_float_4 | true | Long Stop Loss (%) |
| v_input_float_5 | true | Short Stop Loss (%) |
Source Pine Script
/*backtest
start: 2023-11-13 00:00:00
end: 2023-11-17 04:00:00
period: 10m
basePeriod: 1m
exchanges: [{"eid":"Futures_Binance","currency":"BTC_USDT"}]
*/

// @version=5
// author=theasgard and moonshot-indicator (ms)
// year 2021
//
// This is a well knowen strategy by using 3 different Supertrends and a trend-defining EMA,
// feel free to play around with the settings, a backtest on 8h ETHUSDT pair brought some good results using
// the 233EMA and investing 75% of a 10k start capital
//
// the idea is to have at least 2 supertrnds going green above the trend-EMA to go long and exit by turning
// 2 supertrends red (idea: 1 supertrend in red could initialize a take profit)
// shorts work vice versa
// The EMA shows in green for uptrends and in red for downtrends, if it is blue no Signal will be taken because
// the 3 supertrends are not all above or below the trendline(EMA)

strategy("ms hypertrender", overlay=true)

// set up 3 supertrendlines and colour the direction up/down
atrPeriod1 = input(10, "ATR Length 1")
factor1 = input.float(1.0, "ATR Factor 1", step = 0.01)
[supertrend1, direction1] = ta.supertrend(factor1, atrPeriod1)
upTrend1 = plot(direction1 < 0 ? supertrend1 : na, "Up Trend 1", color = color.green, style=plot.style_linebr)
downTrend1 = plot(direction1 < 0? na : supertrend1, "Down Trend 1", color = color.red, style=plot.style_linebr)

atrPeriod2 = input(11, "ATR Length 2")
factor2 = input.float(2.0, "ATR Factor 2", step = 0.01)
[supertrend2, direction2] = ta.supertrend(factor2, atrPeriod2)
upTrend2 = plot(direction2 < 0 ? supertrend2 : na, "Up Trend 2", color = color.green, style=plot.style_linebr)
downTrend2 = plot(direction2 < 0? na : supertrend2, "Down Trend 2", color = color.red, style=plot.style_linebr)

atrPeriod3 = input(12, "ATR Length 3")
factor3 = input.float(3.0, "ATR Factor 3", step = 0.01)
[supertrend3, direction3] = ta.supertrend(factor3, atrPeriod3)
upTrend3 = plot(direction3 < 0 ? supertrend3 : na, "Up Trend 1", color = color.green, style=plot.style_linebr)
downTrend3 = plot(direction3 < 0? na : supertrend3, "Down Trend 1", color = color.red, style=plot.style_linebr)

//set up the trend dividing EMA and color uptrend nutreal downtrend
len = input.int(233, minval=1, title="Trend-EMA Length")
src = input(close, title="Source")
offset = input.int(title="Offset", defval=0, minval=-500, maxval=500)

//general Bull or Bear Trend? Visualized by ema
ematrend = ta.ema(src, len)
generaluptrend = supertrend1 > ematrend and supertrend2 > ematrend and supertrend3 > ematrend
generaldowntrend = supertrend1 < ematrend and supertrend2 < ematrend and supertrend3 < ematrend
emacolor = if generaluptrend
    color.green
else if generaldowntrend
    color.red
else
    color.blue
plot(ematrend, title="EMA", color=emacolor, offset=offset)

// Bullish? min 2 supertrends green
bullish = (direction1 < 0 and direction2 < 0) or (direction1 < 0 and direction3 < 0) or (direction2 < 0 and direction3 < 0) and generaluptrend
extremebullish = direction1 < 0 and direction2 < 0 and direction3 < 0 and generaluptrend //all 3 green

// Bearish? min 2 supertrends red
bearish = (direction1 > 0 and direction2 > 0) or (direction1 > 0 and direction3 > 0) or (direction2 > 0 and direction3 > 0) and generaldowntrend
extremebearish = direction1 > 0 and direction2 > 0 and direction3 > 0 and generaldowntrend //all 3 red

// Open Long
//plotchar(((bullish and not bullish[1]) or (extremebullish and not extremebullish[1])) and (emacolor==color.green)? close : na, title = 'Start Long', char='▲', color = #80eb34, location = location.belowbar, size = size.small)

// TP 10% Long
TP10long = ((generaluptrend and bullish[1]) or (generaluptrend and extremebullish[1])) and (direction1 > 0 or direction2 > 0 or direction3 > 0)
//plotchar(TP10long and not TP10long[1]? close : na, title = 'TP on Long', char='┼', color = #ffd000, location = location.abovebar, size = size.tiny)

// Exit Long
//plotchar(extremebearish and not extremebearish[1] or bearish and not bearish[1]? close : na, title = 'Close all Longs', char='Ꭓ', color = #ff0037, location = location.abovebar, size = size.tiny)

// Open Short
//plotchar(((bearish and not bearish[1]) or (extremebearish and not extremebearish[1])) and (emacolor==color.red)? close : na, title = 'Start Short', char='▼', color = #0547e3, location = location.abovebar, size = size.small)

// TP 10% Short
TP10short = ((generaldowntrend and bearish[1]) or (generaldowntrend and extremebearish[1])) and (direction1 < 0 or direction2 < 0 or direction3 < 0)
//plotchar(TP10short and not TP10short[1]? close : na, title = 'TP on Short', char='┼', color = #ffd000, location = location.belowbar, size = size.tiny)

// Exit Short
//plotchar(extremebullish and not extremebullish[1] or bullish and not bullish[1]? close : na, title = 'Close all Shorts', char='Ꭓ', color = #ff0037, location = location.belowbar, size = size.tiny)

// Set stop loss level with input options (optional)
longLossPerc = input.float(title="Long Stop Loss (%)",
     minval=0.0, step=0.1, defval=1) * 0.01

shortLossPerc = input.float(title="Short Stop Loss (%)",
     minval=0.0, step=0.1, defval=1) * 0.01

// Determine stop loss price
longStopPrice  = strategy.position_avg_price * (1 - longLossPerc)
shortStopPrice = strategy.position_avg_price * (1 + shortLossPerc)

openlong = (((bullish and not bullish[1]) or (extremebullish and not extremebullish[1])) and (emacolor==color.green))
openshort = (((bearish and not bearish[1]) or (extremebearish and not extremebearish[1])) and (emacolor==color.red))
exitlong = (extremebearish and not extremebearish[1] or bearish and not bearish[1]) or TP10long
exitshort = (extremebullish and not extremebullish[1] or bullish and not bullish[1]) or TP10short
strategy.entry("buy", strategy.long, when=openlong)
strategy.entry("sell", strategy.short, when=openshort)

strategy.close("buy", when=exitlong)
strategy.close("sell", when=exitshort)

// Submit exit orders based on calculated stop loss price
if (strategy.position_size > 0)
    strategy.exit(id="Long Stop", stop=longStopPrice)

if (strategy.position_size < 0)
strategy.exit(id="Short Stop", stop=shortStopPrice)Published by ChaoZhang on the FMZ strategy square · last modified 2023-11-21. Collected in the Quant Trading Vault. Unvalidated research: re-test with your own data and costs before trusting it.
Build this with AgenKit
A spec is not a trading system. Paste this into your coding agent and AgenKit runs a specialist team — architecture, test-first build, risk gates, review — with paper trading on by default.
/agenkit build a production-grade trading bot with a backtest engine, risk controls and paper trading by default from strategies/Moonshot-Dual-Triangle-Breakout-Strategy.md- npx agenkit install engineering-kit in your project
- Paste the command into your agent and approve each phase
- Get tests, backtest, risk controls and a paper-trading switch
Understand it first
Before you run this, read the lesson behind the idea and how to backtest it honestly. Specs like this one are the survivors of an unknown number of trials; deflate their results accordingly.
Related specs
- Momentum Breakout Trading Strategy 440964Pine Script · Breakout · 5m
- Quantitative Trading Strategy Based on Ichimoku with Multiple SignalsPine Script · Breakout · 1h
- Dual MA Indicator Oscillating Price Tracking StrategyPine Script · Breakout · 2h
- Cross Timeframe SuperTrend Breakout StrategyPine Script · Breakout · 1h
- Momentum Breakout and Trend Following Combination StrategyPine Script · Breakout · 1m
- Multi Moving Average Supertrend with Bollinger Breakout Trading StrategyPine Script · Breakout · 1d