Strategy vault / Trend following
Moving Average and Super Trend Tracking Stop Loss Strategy
This strategy uses moving averages and the supertrend indicator to determine market trends, combined with a tracking stop loss mechanism, to design a tracking stop loss trading strategy. When the supertrend indicator…
Overview
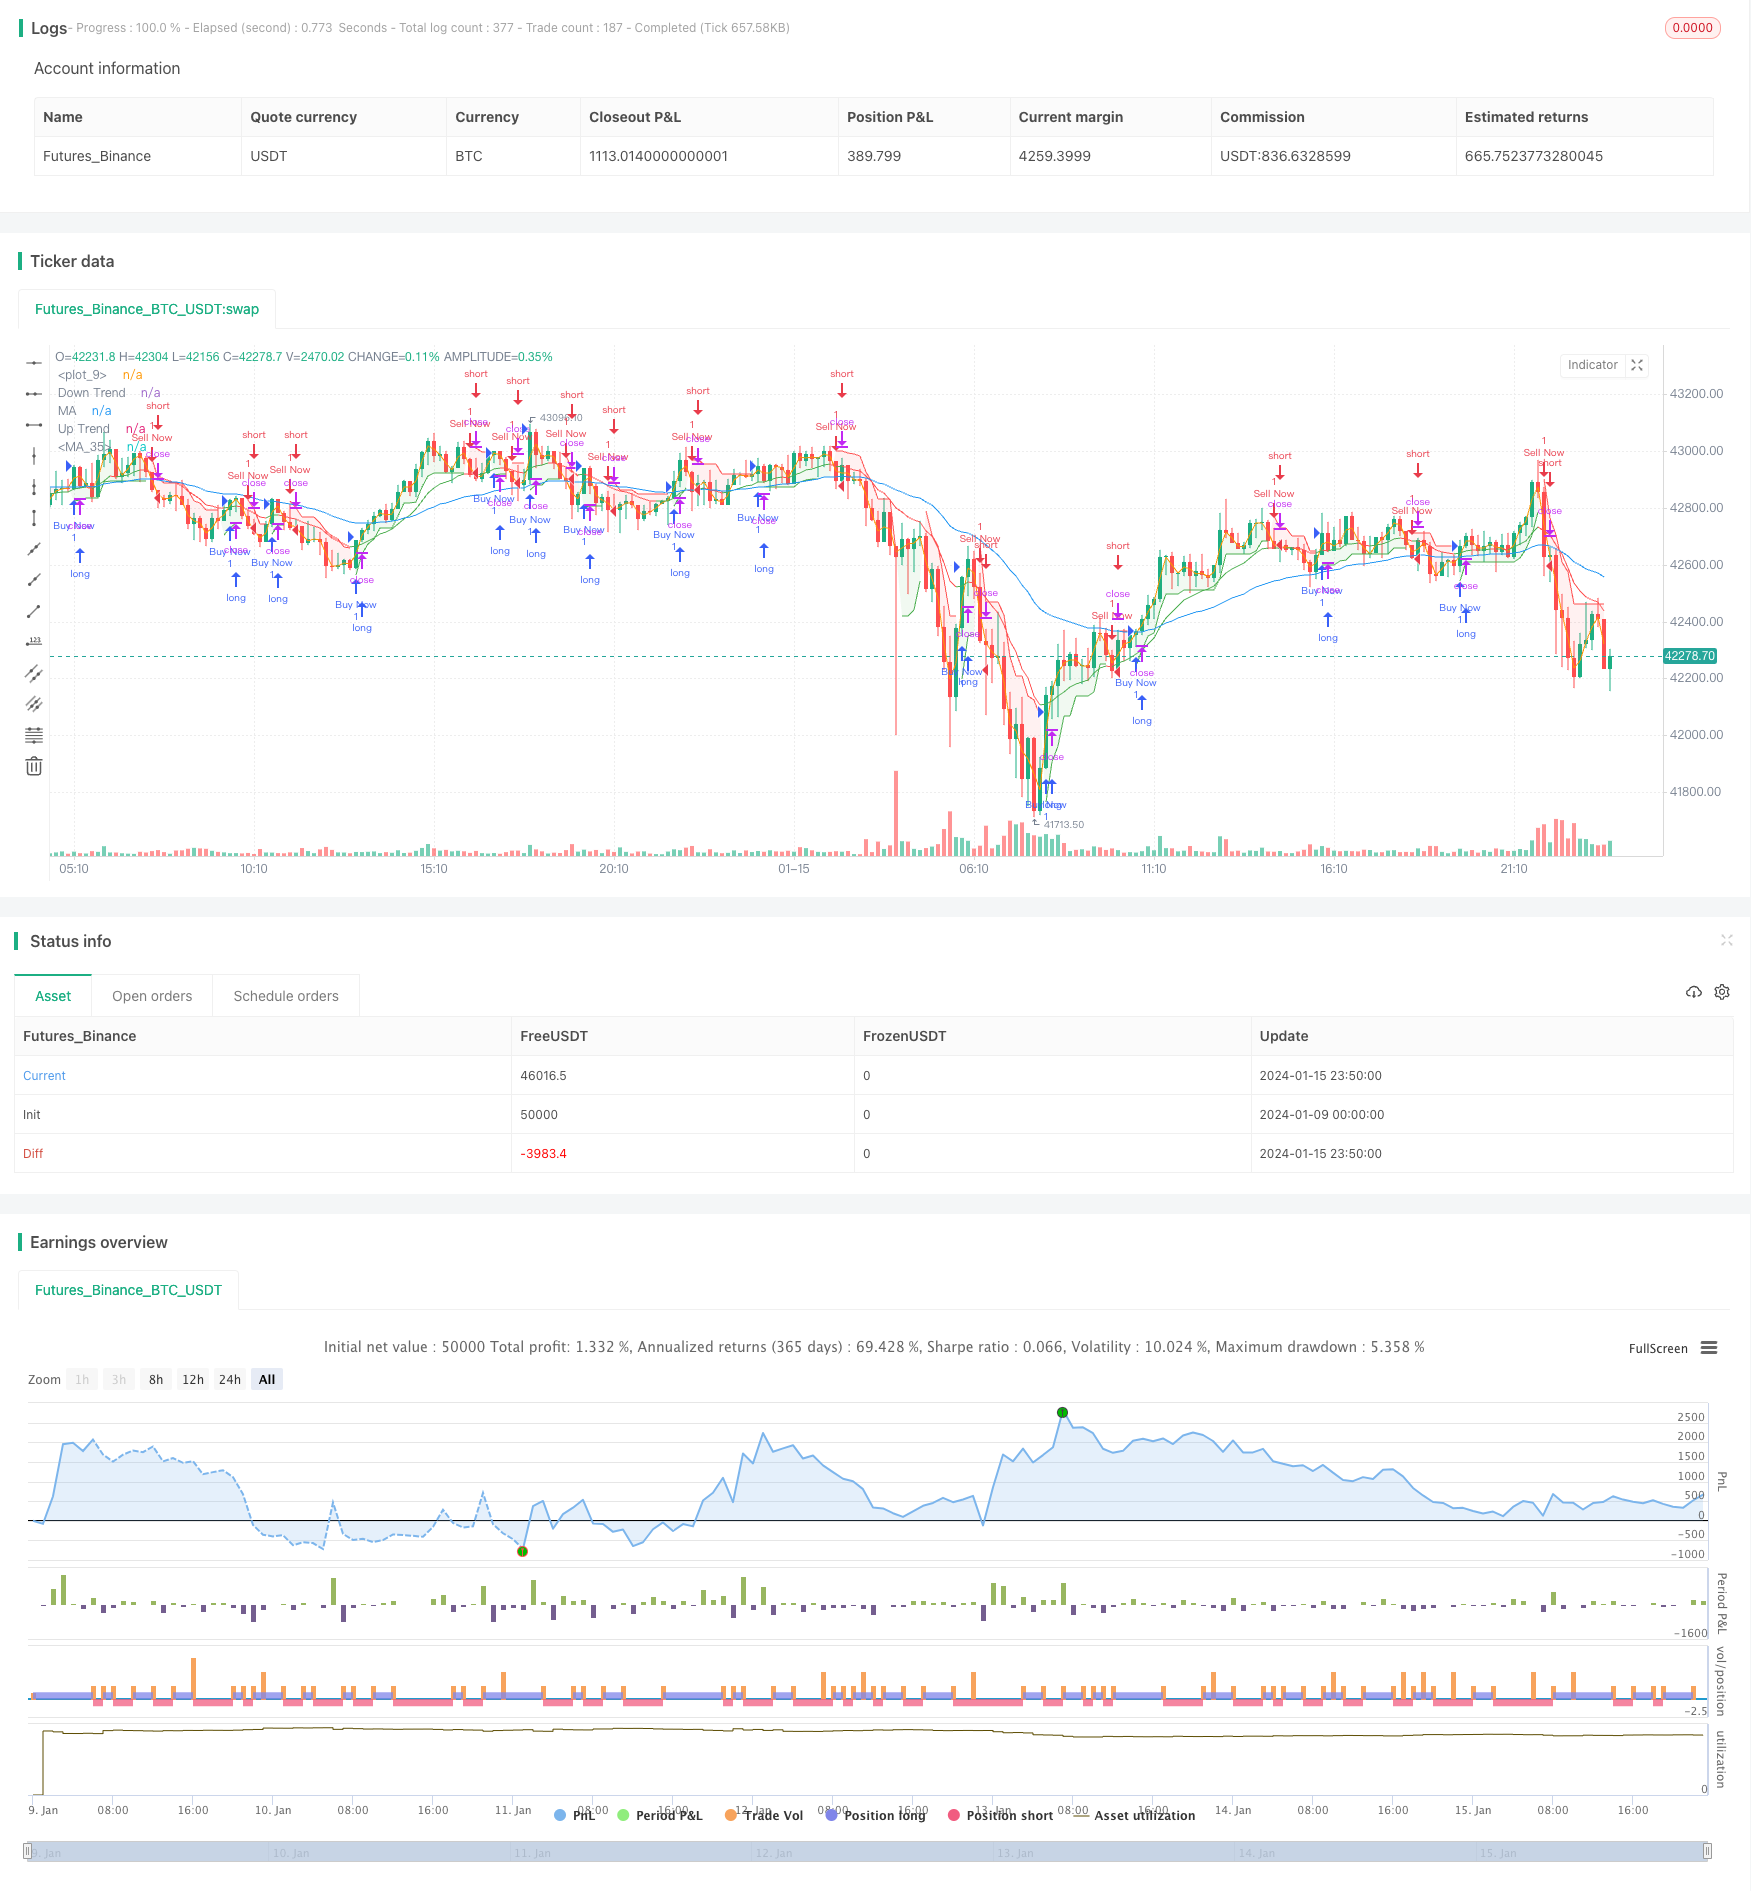
This strategy uses moving averages and the supertrend indicator to determine market trends, combined with a tracking stop loss mechanism, to design a tracking stop loss trading strategy. When the supertrend indicator judges an uptrend, if the closing price breaks through the 14-period moving average, go long; when the supertrend indicator judges a downtrend, if the closing price breaks through the 14-period moving average, go short. After going long or short, stop loss will be triggered based on the position of the stop loss point.
Strategy Principle
This strategy uses three technical indicators: moving average, supertrend and tracking stop loss.
First, calculate the 14-period and 44-period exponential moving averages. The 14-period moving average is used to determine short-term trends, while the 44-period moving average is used to determine long-term trends. When the short-term moving average crosses above the long-term moving average, it is a bullish signal, and vice versa.
Secondly, calculate the supertrend indicator to judge the current market trend. The supertrend indicator consists of the positive indicator DI+ and the negative indicator DI-. When DI+ is higher than DI-, it is a bullish trend; when DI- is higher than DI+, it is a bearish trend.
Finally, combine the moving average signal and the trend judgment of the supertrend indicator to generate trading signals. When the supertrend indicator shows bullish and the price breaks through the 14-period moving average, go long; when the supertrend indicator shows bearish and the price breaks through the 14-period moving average, go short. After entering the market, set the stop loss point near the 44-period moving average to realize tracking stop loss.
Advantage Analysis
This strategy combines the advantages of three technical indicators to make accurate judgments and timely stop losses, and has the following advantages:
- Moving averages determine short-term and long-term trends, accurately identifying signals.
- The supertrend indicator determines the main trend direction and reduces false signals.
- The tracking stop loss mechanism reduces single stop loss and has an overall good stop loss effect.
Risk Analysis
This strategy also has some risks:
- Failed breakout risk. Prices may pull back again after breaking through moving averages, missing the best entry point.
- Stop loss triggered risk. Tracking stop loss cannot completely avoid losses, and can only control single losses within a certain range.
- Parameter optimization risk. Improper settings of moving average periods, supertrend parameters, etc. will affect signal quality.
The corresponding solutions are:
- Use other indicators to filter signals and improve breakout success rate.
- Optimize tracking stop loss parameters to set stop loss point to reasonable position.
- Test and optimize parameters to select the best parameter combination.
Optimization Directions
This strategy can also be optimized in the following directions:
Increase other indicators to filter out wrong signals and improve strategy win rate. For example, combine trading volume indicators to strengthen trends.
Optimize tracking stop loss methods to make stop loss more intelligent and flexible. For example, ATR stop loss, Chandelier Exit, etc.
Use machine learning methods to find more optimal parameters. For example, genetic algorithms, deep learning and other methods to find the optimal parameter combination.
Run strategies over higher time frames to avoid high frequency noise interference.
Conclusion
This strategy combines moving averages, supertrend indicators and tracking stop loss techniques to make accurate judgments and timely stop losses. It is a pragmatic and reliable tracking stop loss trading strategy. The effect of the strategy can be further enhanced by improving signal quality, optimizing stop loss methods, etc.
Parameters
| Name | Default | What it controls |
|---|---|---|
| v_input_1 | 3 | ATR Length |
| v_input_float_1 | true | Factor |
| v_input_int_1 | 14 | Length |
| v_input_2_close | 0 | Source: close | high | low | open | hl2 | hlc3 | hlcc4 | ohlc4 |
| v_input_int_2 | false | Offset |
| v_input_int_3 | 44 | Length |
Source Pine Script
/*backtest
start: 2024-01-09 00:00:00
end: 2024-01-16 00:00:00
period: 10m
basePeriod: 1m
exchanges: [{"eid":"Futures_Binance","currency":"BTC_USDT"}]
*/

//@version=5
strategy("Santanu Strategy", overlay=true)

atrPeriod = input(3, "ATR Length")
factor = input.float(1, "Factor", step = 0.01)

[supertrend, direction] = ta.supertrend(factor, atrPeriod)

bodyMiddle = plot((open + close) / 2, display=display.none)
upTrend = plot(direction < 0 ? supertrend : na, "Up Trend", color = color.green, style=plot.style_linebr)
downTrend = plot(direction < 0? na : supertrend, "Down Trend", color = color.red, style=plot.style_linebr)

fill(bodyMiddle, upTrend, color.new(color.green, 90), fillgaps=false)
fill(bodyMiddle, downTrend, color.new(color.red, 90), fillgaps=false)

len = input.int(14, minval=1, title="Length")
src = input(close, title="Source")
offset = input.int(title="Offset", defval=0, minval=-500, maxval=500)
out = ta.ema(src, len)

len44 = input.int(44, minval=1, title="Length")
out44 = ta.ema(src, len44)

isRising = ta.rising(out, 1)
isFalling = ta.falling(out, 1)

plotColor = color.black
if isRising
    plotColor := color.green
else if isFalling
    plotColor := color.red


plot(out, color=plotColor, title="MA", offset=offset)
plot(out44, color=color.blue, title="MA", offset=offset)

if direction < 0
    if close >= out
        //if low >= out44
        if isRising
            strategy.entry("Buy Now", strategy.long)

if direction > 0
    if close <= out
        //if high <= out44
        if isFalling
            strategy.entry("Sell Now", strategy.short)


//plot(strategy.equity, title="equity", color=color.red, linewidth=2, style=plot.style_areabr)
Published by ChaoZhang on the FMZ strategy square · last modified 2024-01-17. Collected in the Quant Trading Vault. Unvalidated research: re-test with your own data and costs before trusting it.
Build this with AgenKit
A spec is not a trading system. Paste this into your coding agent and AgenKit runs a specialist team — architecture, test-first build, risk gates, review — with paper trading on by default.
/agenkit build a production-grade trading bot with a backtest engine, risk controls and paper trading by default from strategies/Moving-Average-and-Super-Trend-Tracking-Stop-Loss-Strategy.md- npx agenkit install engineering-kit in your project
- Paste the command into your agent and approve each phase
- Get tests, backtest, risk controls and a paper-trading switch
Understand it first
Before you run this, read the lesson behind the idea and how to backtest it honestly. Specs like this one are the survivors of an unknown number of trials; deflate their results accordingly.
Related specs
- Dynamic Trend Following SuperTrend Triple Enhancement StrategyPine Script · Trend following · 1d
- Multi Indicator Dynamic Trend Following Strategy Based on EMA and SMAPine Script · Trend following · 1d
- Supertrend Advance StrategyPine Script · Trend following · 5m
- Supertrend and Moving Average Crossover StrategyPine Script · Trend following · 2h
- Trend Following Strategy Based on PMax IndicatorPine Script · Trend following · 5m
- Trend Tracking and Short term Trading Strategy Based on ADX IndicatorPine Script · Trend following · 1d