Moving Average Bollinger Bands Breakout Strategy
This strategy combines moving average, Bollinger bands and UT Bot Alerts indicators to implement a simple breakout trading strategy. It goes long when price breaks above Bollinger upper band and goes short when price…
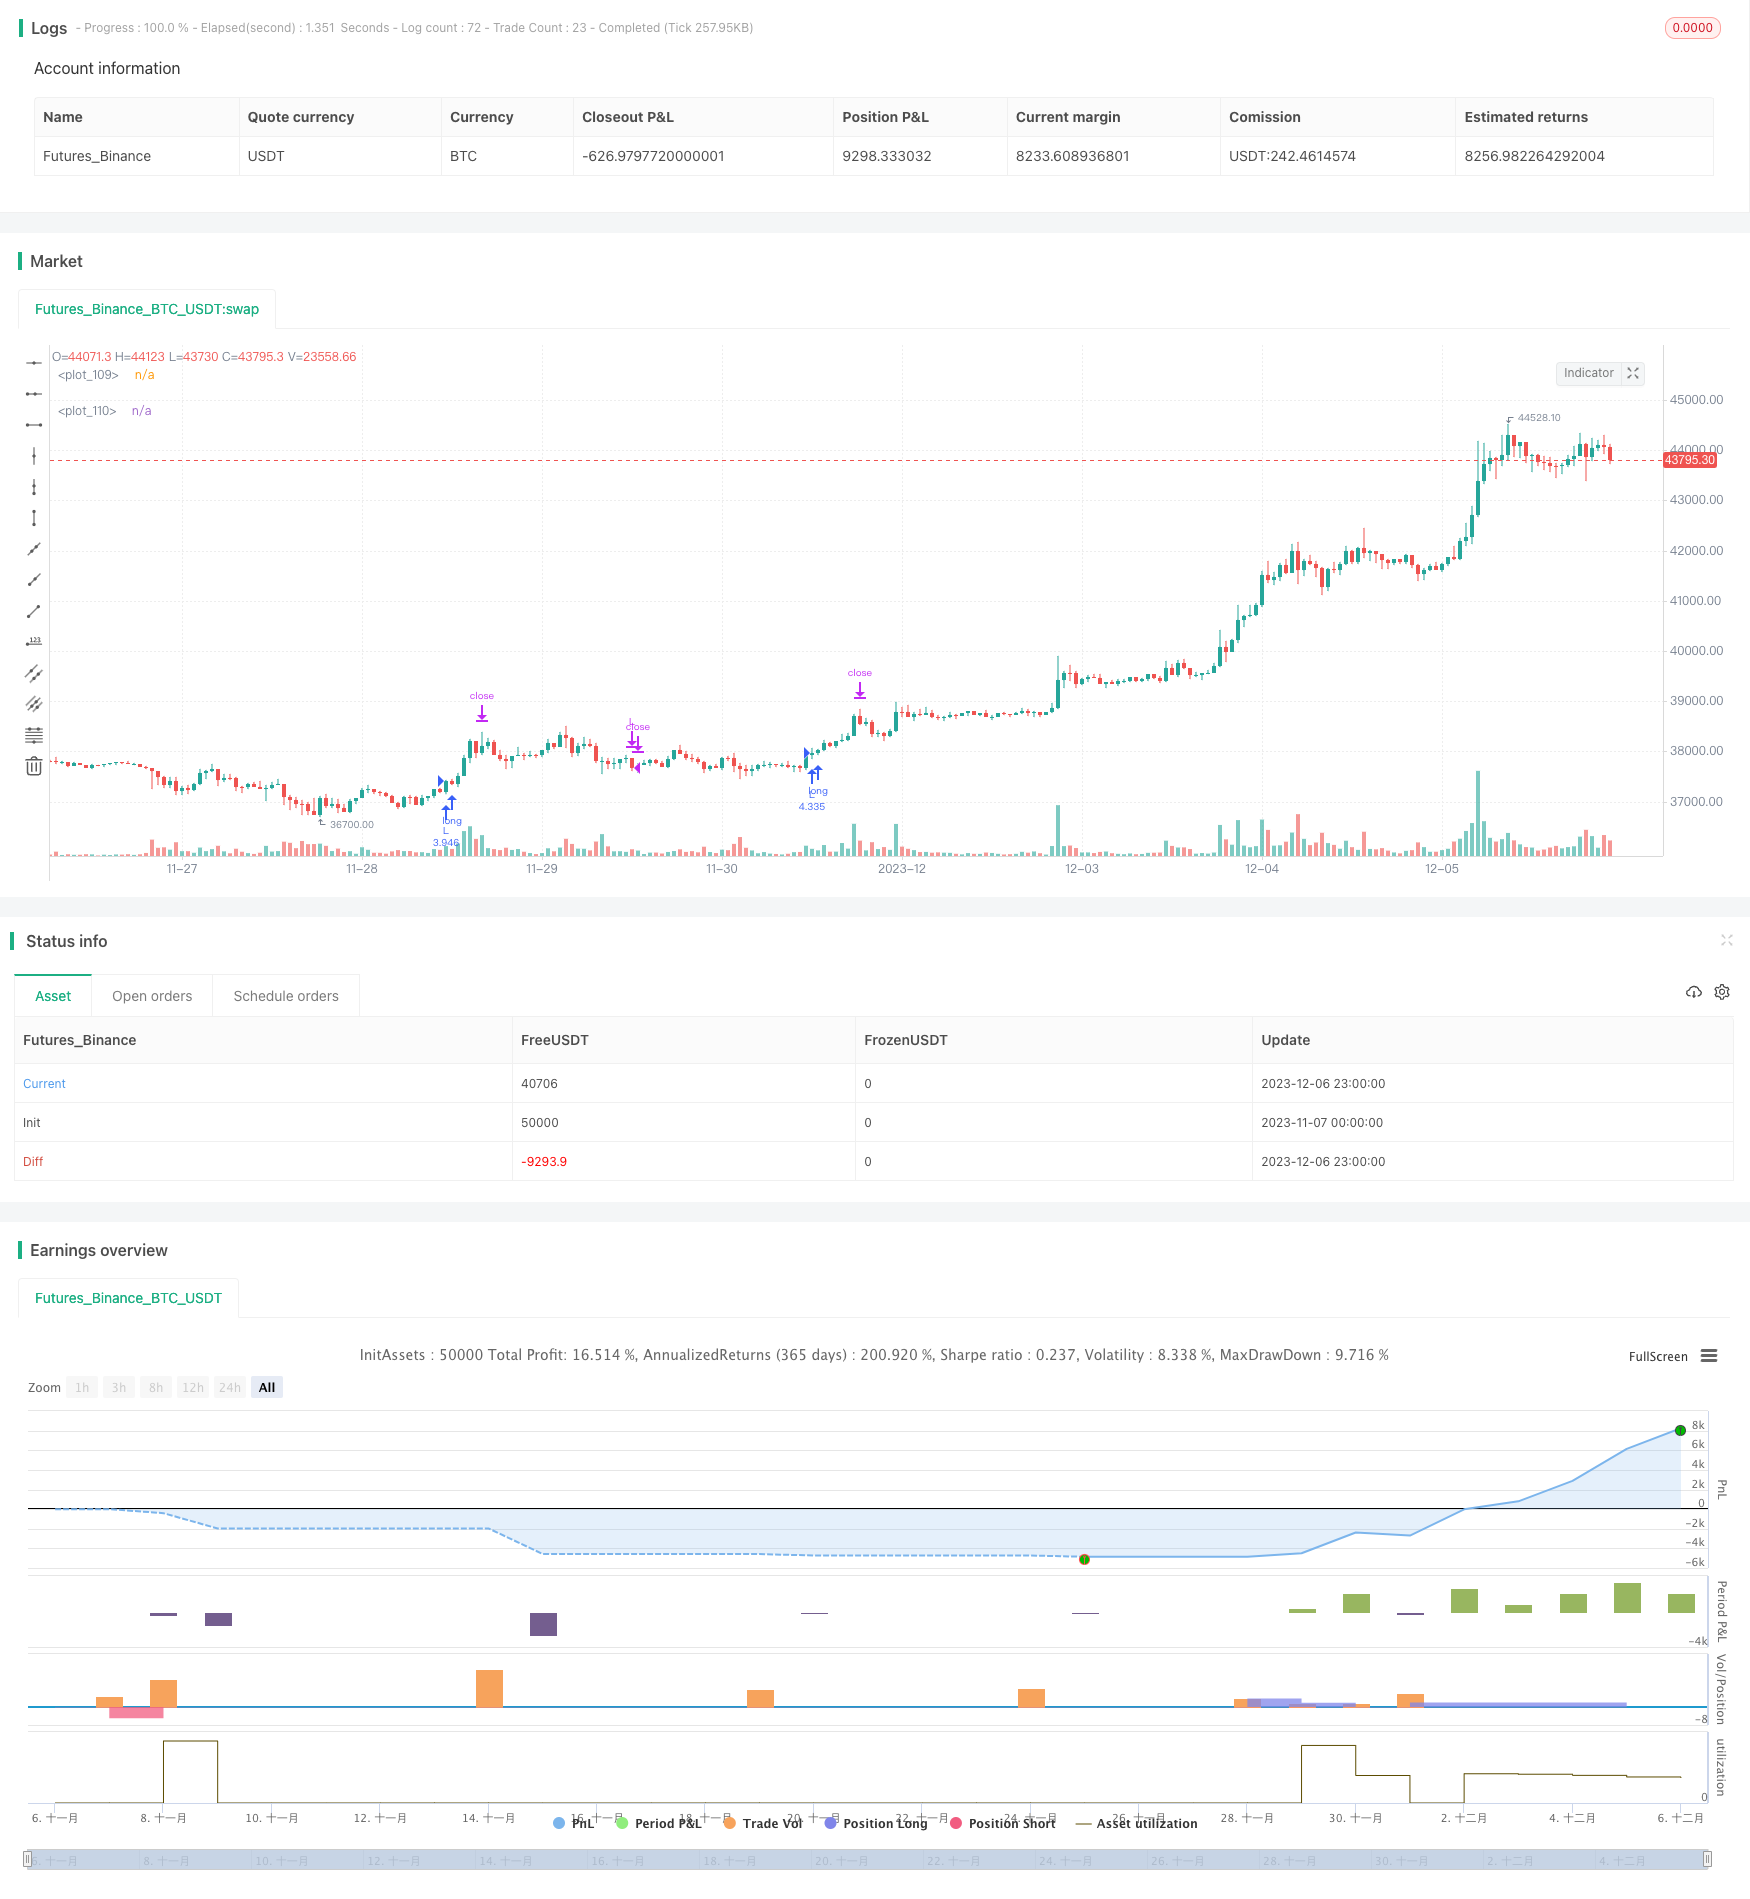
Overview
This strategy combines moving average, Bollinger bands and UT Bot Alerts indicators to implement a simple breakout trading strategy. It goes long when price breaks above Bollinger upper band and goes short when price breaks below Bollinger lower band.
Strategy Logic
- The 200-period EMA serves as the baseline for the trend. Price above EMA signifies uptrend and price below EMA signifies downtrend.
- The UT Bot Alerts indicator generates buy and sell signals in combination with ATR. It triggers long signal when price and fast EMA cross above Bollinger upper band. And it triggers short signal when price and fast EMA cross below Bollinger lower band.
- The ATR stop loss indicator sets the stop loss points. The stop loss distance is 1.5 times the ATR value.
- After entry, stop loss, take profit and break even levels are determined by risk reward ratio.
Advantage Analysis
- Using Bollinger bands to identify appropriate long and short opportunities can improve profitability.
- The UT Bot Alerts indicator can generate comparatively accurate signals.
- By adopting risk reward ratio for stop loss and take profit, risk can be effectively controlled.
Risk Analysis
- Bollinger bands tend to produce false signals during ranging periods.
- ATR has lagging effect. At the beginning of a trend, the stop loss distance may be too wide.
- Improper risk reward ratio settings can also lead to over-aggressiveness or over-conservativeness.
Optimization Guidelines
- Try using other indicators to replace the UT Bot Alerts indicator.
- Optimize the period and multiplier parameters of ATR to find more suitable stop loss distance.
- Test different risk reward ratios to find the optimal parameters.
Conclusion
This strategy integrates the strengths of multiple indicators and has considerable practicality. Through parameter optimization, it can become a steady and reliable breakout system. But the risks arising from indicator failure and improper parameters should also be watched out for.
Parameters
| Name | Default | What it controls |
|---|---|---|
| v_input_bool_1 | false | Date background |
| v_input_bool_2 | false | Session background |
| v_input_float_1 | 10000 | (?Calculate position)Enter initial/current capital |
| v_input_bool_14 | true | Use leverage ? |
| v_input_float_2 | 2.5 | (?Position amount calculator)% account risk per trade |
| v_input_1 | timestamp(10 Feb 2014 13:30 +0000) | (?Time filter)Initial date |
| v_input_2 | timestamp(01 Jan 2030 19:30 +0000) | Final date |
| v_input_3 | 0000-2400 | Time session |
| v_input_int_1 | 200 | (?Trend)Ema length |
| v_input_bool_3 | false | (?Appearance)Show ema ? |
| v_input_bool_4 | false | Show atr from ut bot alerts ? |
| v_input_bool_5 | false | Show ema from ut bot alerts ? |
| v_input_bool_6 | true | Show signals ? |
| v_input_bool_7 | false | Paint candles ? |
| v_input_bool_8 | true | Show Atr stop loss ? |
| v_input_bool_12 | true | Draw position on chart ? |
| v_input_bool_13 | true | Draw first take profit/breakeven price on chart ? |
| v_input_4 | 3 | (?UT BOT ALERTS)Key Vaule |
| v_input_5 | true | ATR Period |
| v_input_6 | false | Signals from Heikin Ashi Candles |
| v_input_7_close | 0 | (?Atr stop loss)Source: close | high | low | open | hl2 | hlc3 | hlcc4 | ohlc4 |
| v_input_int_2 | 14 | Period |
| v_input_float_3 | 1.5 | Atr multiplier |
| v_input_string_1 | 0 | (?Risk management for trades)Source of stoploss: Current candle | Past candle |
| v_input_float_4 | 2.5 | % Account risk per trade for backtesting |
| v_input_bool_9 | true | Use leverage for backtesting ? |
| v_input_float_5 | 0.75 | Risk/reward for breakeven long |
| v_input_float_6 | 3 | Risk/reward for take profit long |
| v_input_float_7 | 0.75 | Risk/reward for break even short |
| v_input_float_8 | 3 | Risk/reward for take profit short |
| v_input_float_9 | 50 | % of trade for first take profit |
| v_input_bool_10 | true | (?Positions management)Long positions ? |
| v_input_bool_11 | true | Short positions ? |
Source Pine Script
/*backtest
start: 2023-11-07 00:00:00
end: 2023-12-07 00:00:00
period: 1h
basePeriod: 15m
exchanges: [{"eid":"Futures_Binance","currency":"BTC_USDT"}]
*/

// This source code is subject to the terms of the Mozilla Public License 2.0 at https://mozilla.org/MPL/2.0/
//@version=5
//Developed by StrategiesForEveryone

strategy("UT Bot alerts strategy", overlay=true, process_orders_on_close = true, initial_capital = 1000000, default_qty_type=strategy.cash, precision = 2, calc_on_every_tick = true, commission_value = 0.03)

// ------ Inputs for calculating position --------

initial_actual_capital = input.float(defval=10000, title = "Enter initial/current capital", group = "Calculate position")
risk_c = input.float(2.5, '% account risk per trade', step=1, group = "Position amount calculator", tooltip = "Percentage of total account to risk per trade. The USD value that should be used to risk the inserted percentage of the account. Appears green in the upper left corner")

// ------ Date filter (obtained from ZenAndTheArtOfTrading) ---------

initial_date = input(title="Initial date", defval=timestamp("10 Feb 2014 13:30 +0000"), group="Time filter", tooltip="Enter the start date and time of the strategy")
final_date   = input(title="Final date", defval=timestamp("01 Jan 2030 19:30 +0000"), group="Time filter", tooltip="Enter the end date and time of the strategy")
dateFilter(int st, int et) => time >= st and time <= et
colorDate = input.bool(defval=false, title="Date background", tooltip = "Add color to the period of time of the strategy tester")
bgcolor(colorDate and dateFilter(initial_date, final_date) ? color.new(color.blue, transp=90) : na)

// ------ Session limits (obtained from ZenAndTheArtOfTrading) -------

timeSession = input(title="Time session", defval="0000-2400", group="Time filter", tooltip="Session time to operate. It may be different depending on your time zone, you have to find the correct hours manually.")
colorBG     = input.bool(title="Session background", defval=false, tooltip = "Add color to session time background")
inSession(sess) => na(time(timeframe.period, sess + ':1234567')) == false
bgcolor(inSession(timeSession) and colorBG ? color.rgb(0, 38, 255, 84) : na)

// ----------- Ema ----------------------

ema = input.int(200, title='Ema length', minval=1, maxval=500, group = "Trend")
ema200 = ta.ema(close, ema)
bullish = close > ema200
bearish = close < ema200
show_ema = input.bool(defval=false, title="Show ema ?", group = "Appearance")
// plot(show_ema ? ema200 : na, title = "Ema", color=color.white, linewidth=2, display = display.all - display.status_line - display.price_scale)

// -------------- UT BOT ALERTS INDICATOR by @QuantNomad -------------------------

// Inputs
a = input(3, title='Key Vaule', group = "UT BOT ALERTS", tooltip = "Higher amount, less trades. Changing this could be useful in some assets or time frames")
c = input(1, title='ATR Period', group = "UT BOT ALERTS", tooltip = "Higher amount, less trades. Changing this could be useful in some assets or time frames")
h = input(false, title='Signals from Heikin Ashi Candles', group = "UT BOT ALERTS")

xATR = ta.atr(c)
nLoss = a * xATR

src = h ? request.security(ticker.heikinashi(syminfo.tickerid), timeframe.period, close, lookahead=barmerge.lookahead_off) : close

xATRTrailingStop = 0.0
iff_1 = src > nz(xATRTrailingStop[1], 0) ? src - nLoss : src + nLoss
iff_2 = src < nz(xATRTrailingStop[1], 0) and src[1] < nz(xATRTrailingStop[1], 0) ? math.min(nz(xATRTrailingStop[1]), src + nLoss) : iff_1
xATRTrailingStop := src > nz(xATRTrailingStop[1], 0) and src[1] > nz(xATRTrailingStop[1], 0) ? math.max(nz(xATRTrailingStop[1]), src - nLoss) : iff_2
show_atr_ut = input.bool(defval=false, title="Show atr from ut bot alerts ?", group = "Appearance")
// plot(show_atr_ut ? xATRTrailingStop : na, color = color.orange, linewidth = 2, display = display.all - display.price_scale - display.status_line)

pos = 0
iff_3 = src[1] > nz(xATRTrailingStop[1], 0) and src < nz(xATRTrailingStop[1], 0) ? -1 : nz(pos[1], 0)
pos := src[1] < nz(xATRTrailingStop[1], 0) and src > nz(xATRTrailingStop[1], 0) ? 1 : iff_3

xcolor = pos == -1 ? color.red : pos == 1 ? color.green : color.blue

ema_ut = ta.ema(src, 1)
show_ema_ut = input.bool(defval=false, title="Show ema from ut bot alerts ?", group = "Appearance")
// plot(show_ema_ut ? ema_ut : na, color = color.white, linewidth = 2, display = display.all - display.price_scale - display.status_line)
above = ta.crossover(ema_ut, xATRTrailingStop)
below = ta.crossover(xATRTrailingStop, ema_ut)

buy = src > xATRTrailingStop and above
sell = src < xATRTrailingStop and below
close_buy = src < xATRTrailingStop and below
close_sell = src > xATRTrailingStop and above

barbuy = src > xATRTrailingStop
barsell = src < xATRTrailingStop

show_signals = input.bool(true, title = "Show signals ?", group = "Appearance")
paint_candles = input.bool(false, title = "Paint candles ?", group = "Appearance")

// plotshape(bullish and show_signals ? buy : na, title='Buy', text='Buy', style=shape.labelup, location=location.belowbar, color=color.new(color.green, 0), textcolor=color.new(color.white, 0), size=size.tiny , display = display.all - display.price_scale - display.status_line)
// plotshape(bearish and show_signals ? sell : na, title='Sell', text='Sell', style=shape.labeldown, location=location.abovebar, color=color.new(color.red, 0), textcolor=color.new(color.white, 0), size=size.tiny, display = display.all - display.price_scale - display.status_line)
// plotshape(bullish and show_signals ? close_buy : na, title='Close Buy', text='Cl Buy', style=shape.labelup, location=location.belowbar, color=color.new(color.green, 80), textcolor=color.new(color.white, 0), size=size.tiny, display = display.all - display.price_scale - display.status_line)
// plotshape(bearish and show_signals ? close_sell : na, title='Close Sell', text='Cl Sell', style=shape.labeldown, location=location.abovebar, color=color.new(color.red, 80), textcolor=color.new(color.white, 0), size=size.tiny, display = display.all - display.price_scale - display.status_line)

barcolor(barbuy and paint_candles ? color.green : na)
barcolor(barsell and paint_candles ? color.red : na)

// -------------- Atr stop loss by garethyeo (modified) -----------------

long_condition_atr = src > xATRTrailingStop and above
short_condition_atr = src < xATRTrailingStop and below
source_atr = input(close, title='Source', group = "Atr stop loss", inline = "A")
length_atr = input.int(14, minval=1, title='Period', group = "Atr stop loss" , inline = "A")
multiplier = input.float(1.5, minval=0.1, step=0.1, title='Atr multiplier', group = "Atr stop loss", inline = "A", tooltip = "Defines the stop loss distance based on the Atr stop loss indicator")
show_atr = input.bool(defval = true, title = "Show Atr stop loss ?", group = "Appearance")
var float shortStopLoss = na
var float longStopLoss = na
var float atr_past_candle_long = na
var float atr_past_candle_short = na
//shortStopLoss = source_atr + ta.atr(length_atr) * multiplier
//longStopLoss = source_atr - ta.atr(length_atr) * multiplier
//atr_past_candle_short = close[1] + ta.atr(length_atr)[1] * multiplier[1]
//atr_past_candle_long = close[1] - ta.atr(length_atr)[1] * multiplier[1]
candle_of_stoploss = input.string(defval = "Current candle", title = "Source of stoploss", group = "Risk management for trades", options = ["Current candle","Past candle"])
if candle_of_stoploss == "Current candle"
    shortStopLoss := source_atr + ta.atr(length_atr) * multiplier
    longStopLoss := source_atr - ta.atr(length_atr) * multiplier
if candle_of_stoploss == "Past candle"
    shortStopLoss := close[1] + ta.atr(length_atr)[1] * multiplier[1]
    longStopLoss := close[1] - ta.atr(length_atr)[1] * multiplier[1]
plot(show_atr and long_condition_atr and bullish ? longStopLoss : na, color = color.white, style = plot.style_circles, linewidth = 2)
plot(show_atr and short_condition_atr and bearish ? shortStopLoss : na, color = color.white, style = plot.style_circles, linewidth = 2)

// ------------- Money management --------------

strategy_contracts = strategy.equity / close
distance_sl_atr_long = -1 * (longStopLoss - close) / close
distance_sl_atr_short = (shortStopLoss - close) / close
risk = input.float(2.5, '% Account risk per trade for backtesting', step=1, group = "Risk management for trades", tooltip = "Percentage of total account to risk per trade")
long_amount = strategy_contracts * (risk / 100) / distance_sl_atr_long
short_amount = strategy_contracts * (risk / 100) / distance_sl_atr_short

// ---- Fixed amounts ----

//fixed_amounts = input.bool(defval = false, title = "Fixed amounts ?", group = "Risk management for trades")
//fixed_amount_input = input.float(defval = 1000, title = "Fixed amount in usd", group = "Risk management for trades")
//if fixed_amounts
//    long_amount := fixed_amount_input / close
//if fixed_amounts
//    short_amount := fixed_amount_input / close
//
leverage=input.bool(defval=true, title="Use leverage for backtesting ?", group = "Risk management for trades", tooltip = "If it is activated, there will be no monetary units or amount of assets limit for each operation (That is, each operation will not be affected by the initial / current capital since it would be using leverage). If it is deactivated, the monetary units or the amount of assets to use for each operation will be limited by the initial/current capital.")
if not leverage and long_amount>strategy_contracts
    long_amount:=strategy.equity/close

if not leverage and short_amount>strategy_contracts
    short_amount:=strategy.equity/close

// ---------- Risk management ---------------

risk_reward_breakeven_long= input.float(title="Risk/reward for breakeven long", defval=0.75, step=0.1, group = "Risk management for trades")
risk_reward_take_profit_long= input.float(title="Risk/reward for take profit long", defval=3.0, step=0.1, group = "Risk management for trades")
risk_reward_breakeven_short= input.float(title="Risk/reward for break even short", defval=0.75, step=0.1, group = "Risk management for trades")
risk_reward_take_profit_short= input.float(title="Risk/reward for take profit short", defval=3.0, step=0.1, group = "Risk management for trades")
tp_percent=input.float(title="% of trade for first take profit", defval=50, step=5, group = "Risk management for trades", tooltip = "Closing percentage of the current position when the first take profit is reached.")

// ------------ Trade conditions ---------------

bullish := close > ema200
bearish := close < ema200
bought = strategy.position_size > 0
sold = strategy.position_size < 0
buy  := src > xATRTrailingStop and above
sell := src < xATRTrailingStop and below
var float sl_long = na
var float sl_short = na
var float be_long = na
var float be_short = na
var float tp_long = na
var float tp_short = na
if not bought
    be_long:=na
    sl_long:=na
    tp_long:=na
if not sold
    be_short:=na
    sl_short:=na
    tp_short:=na
long_positions = input.bool(defval = true, title = "Long positions ?", group = "Positions management")
short_positions = input.bool(defval = true, title = "Short positions ?", group = "Positions management")

// ---------- Strategy -----------

// Long position

if not bought and buy  and long_positions and bullish and inSession(timeSession)
    sl_long:=longStopLoss
    long_stoploss_distance = close - longStopLoss
    be_long := close + long_stoploss_distance * risk_reward_breakeven_long
    tp_long:=close+(long_stoploss_distance*risk_reward_take_profit_long)
    strategy.entry('L', strategy.long, long_amount, alert_message = "Long")
    strategy.exit("Tp", "L", stop=sl_long, limit=tp_long, qty_percent=tp_percent)
    strategy.exit('Exit', 'L', stop=sl_long)
if bought and high > be_long
    sl_long := strategy.position_avg_price
    strategy.exit("Tp", "L", stop=sl_long, limit=tp_long, qty_percent=tp_percent)
    strategy.exit('Exit', 'L', stop=sl_long)
if bought and sell and strategy.openprofit>0
    strategy.close("L", comment="CL")

// Short position

if not sold and sell and short_positions and bearish and inSession(timeSession)
    sl_short:=shortStopLoss
    short_stoploss_distance=shortStopLoss - close
    be_short:=((short_stoploss_distance*risk_reward_breakeven_short)-close)*-1
    tp_short:=((short_stoploss_distance*risk_reward_take_profit_short)-close)*-1
    strategy.entry("S", strategy.short, short_amount, alert_message = "Short")
    strategy.exit("Tp", "S", stop=sl_short, limit=tp_short, qty_percent=tp_percent)
    strategy.exit("Exit", "S", stop=sl_short)
if sold and low < be_short
    sl_short:=strategy.position_avg_price
    strategy.exit("Tp", "S", stop=sl_short, limit=tp_short, qty_percent=tp_percent)
    strategy.exit("Exit", "S", stop=sl_short)
if sold and buy and strategy.openprofit>0
    strategy.close("S", comment="CS")

// ---------- Draw positions and signals on chart (strategy as an indicator) -------------

if high>tp_long
    tp_long:=na
if low<tp_short
    tp_short:=na
if high>be_long
    be_long:=na
if low<be_short
    be_short:=na

show_position_on_chart = input.bool(defval=true, title="Draw position on chart ?", group = "Appearance", tooltip = "Activate to graphically display profit, stop loss and break even")
// position_price = plot(show_position_on_chart? strategy.position_avg_price : na, style=plot.style_linebr, color = color.new(#ffffff, 10), linewidth = 1, display = display.all - display.status_line - display.price_scale)

// sl_long_price = plot(show_position_on_chart and bought ? sl_long : na, style = plot.style_linebr, color = color.new(color.red, 10), linewidth = 1, display = display.all - display.status_line - display.price_scale)
// sl_short_price = plot(show_position_on_chart and sold ? sl_short : na, style = plot.style_linebr, color = color.new(color.red, 10), linewidth = 1, display = display.all - display.status_line - display.price_scale)

// tp_long_price = plot(strategy.position_size>0 and show_position_on_chart? tp_long : na, style = plot.style_linebr, color = color.new(#4cd350, 10), linewidth = 1, display = display.all - display.status_line - display.price_scale)
// tp_short_price = plot(strategy.position_size<0 and show_position_on_chart? tp_short : na, style = plot.style_linebr, color = color.new(#4cd350, 10), linewidth = 1, display = display.all - display.status_line - display.price_scale)

// breakeven_long = plot(strategy.position_size>0 and high<be_long and show_position_on_chart ? be_long : na , style = plot.style_linebr, color = color.new(#1fc9fd, 60), linewidth = 1, display = display.all - display.status_line - display.price_scale)
// breakeven_short = plot(strategy.position_size<0 and low>be_short and show_position_on_chart ? be_short : na , style = plot.style_linebr, color = color.new(#1fc9fd, 60), linewidth = 1, display = display.all - display.status_line - display.price_scale)

show_break_even_on_chart = input.bool(defval=true, title="Draw first take profit/breakeven price on chart ?", group = "Appearance", tooltip = "Activate to display take profit and breakeven price. It appears as a green point in the chart")
long_stoploss_distance = close - longStopLoss
short_stoploss_distance=shortStopLoss - close
be_long_plot = close + long_stoploss_distance * risk_reward_breakeven_long
be_short_plot =((short_stoploss_distance*risk_reward_breakeven_short)-close)*-1
// plot(show_break_even_on_chart and buy and bullish? be_long_plot : na, color=color.new(#1fc9fd, 10), style = plot.style_circles, linewidth = 2, display = display.all - display.price_scale)
// plot(show_break_even_on_chart and sell and bearish? be_short_plot : na, color=color.new(#1fc9fd, 10), style = plot.style_circles, linewidth = 2, display = display.all - display.price_scale)

// position_profit_long = plot(bought and show_position_on_chart and strategy.openprofit>0 ? close : na, style = plot.style_linebr, color = color.new(#4cd350, 10), linewidth = 1, display = display.all - display.status_line - display.price_scale)
// position_profit_short = plot(sold and show_position_on_chart and strategy.openprofit>0 ? close : na, style = plot.style_linebr, color = color.new(#4cd350, 10), linewidth = 1, display = display.all - display.status_line - display.price_scale)

// fill(plot1 = position_price, plot2 = position_profit_long, color = color.new(#4cd350, 90))
// fill(plot1 = position_price, plot2 = position_profit_short, color = color.new(#4cd350, 90))

// fill(plot1 = position_price, plot2 = sl_long_price, color = color.new(color.red,90))
// fill(plot1 = position_price, plot2 = sl_short_price, color = color.new(color.red,90))

// fill(plot1 = position_price, plot2 = tp_long_price, color = color.new(color.green,90))
// fill(plot1 = position_price, plot2 = tp_short_price, color = color.new(color.green,90))

// --------------- Positions amount calculator  -------------

contracts_amount_c = initial_actual_capital / close
distance_sl_long_c = -1 * (longStopLoss - close) / close
distance_sl_short_c = (shortStopLoss - close) / close
long_amount_c = close * (contracts_amount_c * (risk_c / 100) / distance_sl_long_c)
short_amount_c = close * (contracts_amount_c * (risk_c / 100) / distance_sl_short_c)
long_amount_lev = close * (contracts_amount_c * (risk_c / 100) / distance_sl_long_c)
short_amount_lev = close * (contracts_amount_c * (risk_c / 100) / distance_sl_short_c)

leverage_for_calculator=input.bool(defval=true, title="Use leverage ?", group = "Calculate position", tooltip = "If it is activated, there will be no monetary units or amount of assets limit for each operation (That is, each operation will not be affected by the initial / current capital since it would be using leverage). If it is deactivated, the monetary units or the amount of assets to use for each operation will be limited by the initial/current capital.")

if not leverage_for_calculator and long_amount_lev>initial_actual_capital
    long_amount_lev:=initial_actual_capital

if not leverage_for_calculator and short_amount_lev>initial_actual_capital
    short_amount_lev:=initial_actual_capital

// plot(buy and leverage_for_calculator ? long_amount_c : na, color = color.rgb(136, 255, 0), display = display.all - display.pane - display.price_scale)
// plot(sell and leverage_for_calculator ? short_amount_c : na, color = color.rgb(136, 255, 0), display = display.all - display.pane - display.price_scale)
// plot(buy and not leverage_for_calculator ? long_amount_lev : na, color = color.rgb(136, 255, 0), display = display.all - display.pane - display.price_scale)
// plot(sell and not leverage_for_calculator ? short_amount_lev : na, color = color.rgb(136, 255, 0), display = display.all - display.pane - display.price_scale)
Published by ChaoZhang on the FMZ strategy square · last modified 2023-12-08. Collected in the Quant Trading Vault. Unvalidated research: re-test with your own data and costs before trusting it.
Build this with AgenKit
A spec is not a trading system. Paste this into your coding agent and AgenKit runs a specialist team — architecture, test-first build, risk gates, review — with paper trading on by default.
/agenkit build a production-grade trading bot with a backtest engine, risk controls and paper trading by default from strategies/Moving-Average-Bollinger-Bands-Breakout-Strategy.md- npx agenkit install engineering-kit in your project
- Paste the command into your agent and approve each phase
- Get tests, backtest, risk controls and a paper-trading switch
Understand it first
Before you run this, read the lesson behind the idea and how to backtest it honestly. Specs like this one are the survivors of an unknown number of trials; deflate their results accordingly.
Related specs
- Momentum Breakout Trading Strategy 440964Pine Script · Breakout · 5m
- Momentum Breakout Strategy 432076Pine Script · Breakout · 1d
- BB Breakout StrategyPine Script · Breakout · 1d
- Dynamic ATR based Trailing Stop Trading StrategyPine Script · Breakout · 1d
- EMA and Bollinger Bands Breakout StrategyPine Script · Breakout · 1h
- Kana Candle Breakout Strategy Based on Moving Average and Support ResistancePine Script · Breakout · 1h