Strategy vault / Trend following
Moving Average Crossover Trading Strategy 439844
The moving average crossover trading strategy generates buy and sell signals by calculating the crossover of the fast EMA (fastLength) and slow EMA (slowLength) lines. When the fast line crosses above the slow line…
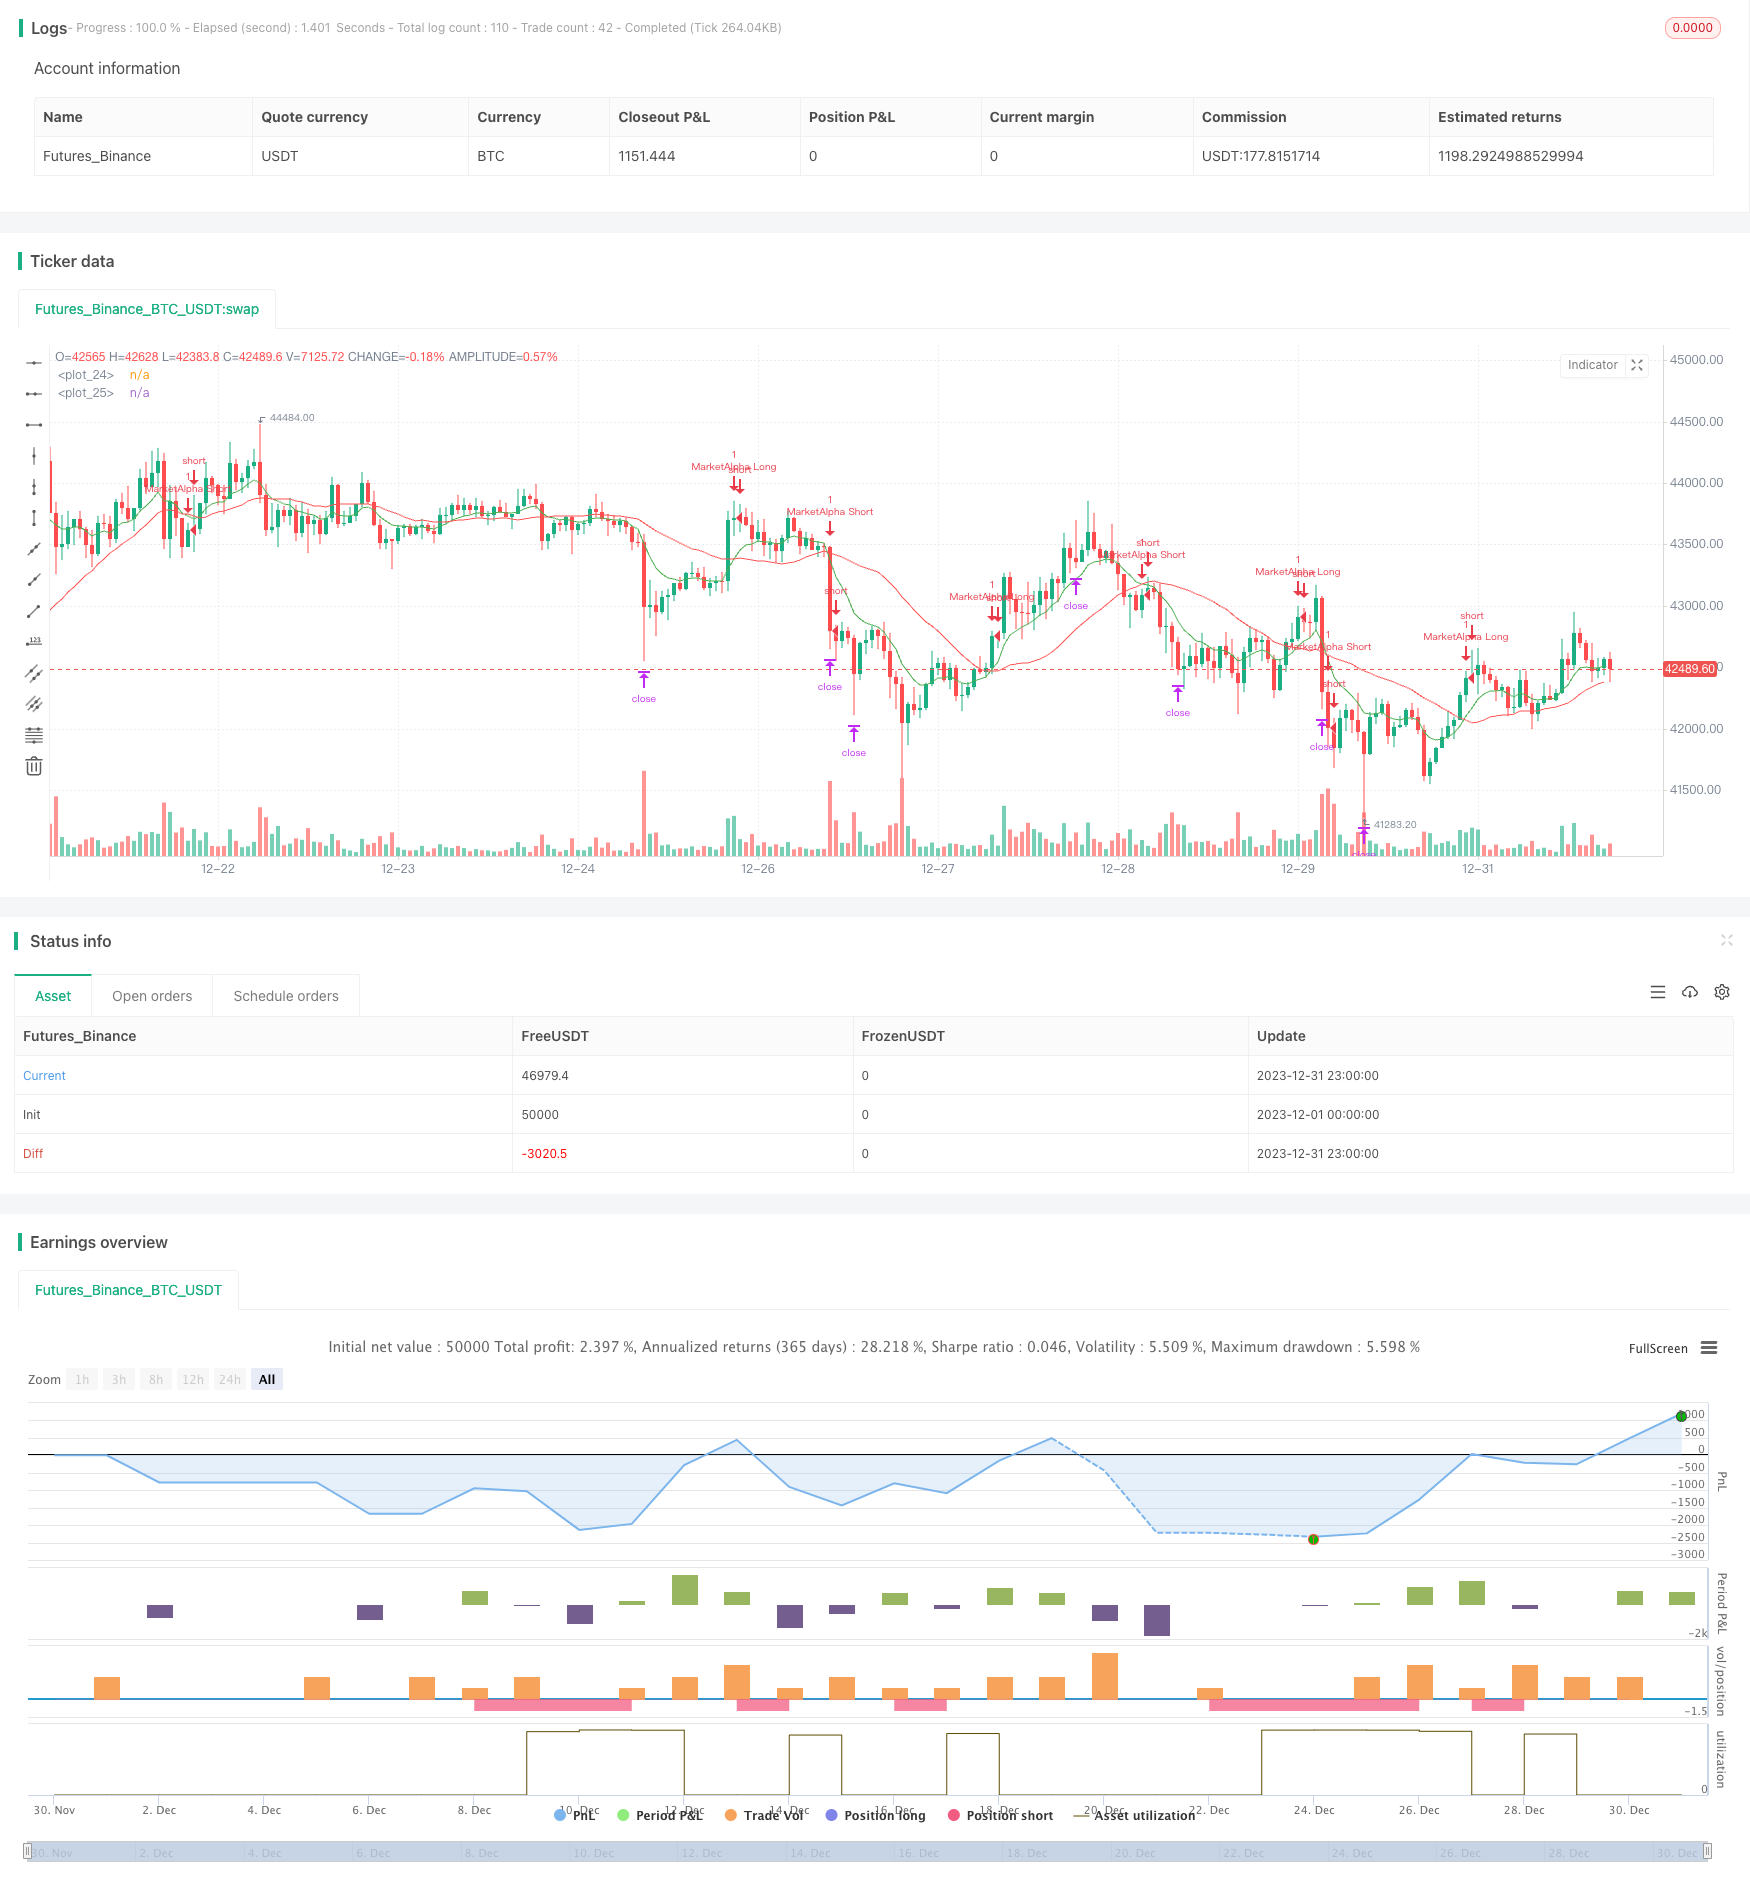
Overview
The moving average crossover trading strategy generates buy and sell signals by calculating the crossover of the fast EMA (fastLength) and slow EMA (slowLength) lines. When the fast line crosses above the slow line, a buy signal is generated. When the fast line crosses below the slow line, a sell signal is generated. This strategy is simple and practical, suitable for medium and short term trading.
Strategy Principle
The strategy uses two moving average lines, fast line and slow line. The fast line parameter EMAfastLength defaults to 9-day line, and the slow line parameter EMAslowLength defaults to 26-day line. Calculate the crossover of the two EMA lines to determine market buy and sell signals:
- When the fast line breaks upward through the slow line, a buy signal enterLong() is generated.
- When the fast line breaks downward through the slow line, a sell signal enterShort() is generated.
The specific trading signals and strategy rules are as follows:
- When the fast line crosses above the slow line, go long; when the fast line crosses below the slow line, close position.
- The take profit for long is Targetpercentage (default 0.15%) of the price, which is to close position when the profit reaches 15%.
- The stop loss for long is StopLosspercentage (default 0.20%) of the price, which is to close position when the loss reaches 20%.
- Short position works the same way.
So this strategy trades based on the golden cross and dead cross of the two moving average lines.
Advantage Analysis
- The strategy is simple and easy to understand.
- The application of moving average filters out some market noise and makes trading signals more precise.
- Trading rules are clear with definite profit taking and stop loss.
- Test parameters can be adjusted flexibly to adapt to different market conditions.
Risk Analysis
- Moving averages themselves have lagging, which may miss short-term price changes, leading to inaccurate buy and sell points.
- Different cycle moving average parameters may generate false signals and bring losses.
- Relying solely on a few parameters, this strategy has high hyperparameter optimization requirements to find the best parameter combination.
- In some particular major trends, this strategy is prone to fail.
To address the risks, parameters that can be optimized include moving average cycle, trading variety, profit taking and stop loss ratio, etc. Extensive testing is required to reduce risks.
Optimization Directions
The moving average crossover idea of this strategy is simple and practical. It can be optimized in the following ways:
- Change moving average type: In addition to EMA, also test SMA, LWMA, HMA and other types.
- Add other indicators: Combine with RSI, MACD and other indicators.
- Parameter optimization: Auto optimize the two cycle parameters of EMA to find the best parameter combination.
- Trend filtering: Trade selectively based on major trend situations.
- Profit taking and stop loss optimization: Improve the fixed percentage profit taking and stop loss to make it more practical.
Through these optimization tests, the strategy's practical effect and stability can be greatly improved.
Summary
The moving average crossover strategy idea is simple, but practical application requires continuous optimization. This strategy gives the logic of generating trading signals and basic trading rules. On this basis, it can be greatly optimized to become a usable quantitative strategy. The application of moving average also provides us with ideas for strategies, based on which we can innovate and improve.
Parameters
| Name | Default | What it controls |
|---|---|---|
| v_input_1 | 9 | EMAfastLength |
| v_input_2 | 26 | EMAslowLength |
| v_input_3 | 0.15 | Profit Target in percentage |
| v_input_4 | 0.2 | Stop Loss in percentage |
| v_input_5 | true | From Month |
| v_input_6 | true | From Day |
| v_input_7 | 2018 | From Year |
| v_input_8 | true | To Month |
| v_input_9 | true | To Day |
| v_input_10 | 9999 | To Year |
Source Pine Script
/*backtest
start: 2023-12-01 00:00:00
end: 2023-12-31 23:59:59
period: 1h
basePeriod: 15m
exchanges: [{"eid":"Futures_Binance","currency":"BTC_USDT"}]
*/

//@version=4
strategy("EMA Cross by MarketAlpha", overlay=true)
EMAfastLength = input(defval = 9, minval = 2)
EMAslowLength = input(defval = 26, minval = 2)
Targetpercentage = input(defval = 0.15, title = "Profit Target in percentage", minval = 0.05)
StopLosspercentage = input(defval = 0.20, title = "Stop Loss in percentage", minval = 0.05)
profitpoints = close*Targetpercentage
stoplosspoints = close*StopLosspercentage
price = close

FromMonth = input(defval = 1, title = "From Month", minval = 1, maxval = 12)
FromDay   = input(defval = 1, title = "From Day", minval = 1, maxval = 31)
FromYear  = input(defval = 2018, title = "From Year", minval = 2000)
ToMonth   = input(defval = 1, title = "To Month", minval = 1, maxval = 12)
ToDay     = input(defval = 1, title = "To Day", minval = 1, maxval = 31)
ToYear    = input(defval = 9999, title = "To Year", minval = 2017)

start     = timestamp(FromYear, FromMonth, FromDay, 00, 00)  // backtest start window
finish    = timestamp(ToYear, ToMonth, ToDay, 23, 59)        // backtest finish window
window()  => true // create function "within window of time"

emafast = ema(price, EMAfastLength)
emaslow = sma(price, EMAslowLength)
plot(emafast,color=green)
plot(emaslow,color=red)

enterLong() => crossover(emafast, emaslow)
strategy.entry(id = "MarketAlpha Long", long = true, when = window() and enterLong())
strategy.exit("Exit Long", from_entry = "MarketAlpha Long", profit = profitpoints,loss = stoplosspoints)

enterShort() => crossunder(emafast, emaslow)
strategy.entry(id = "MarketAlpha Short", long = false, when = window() and enterShort())
strategy.exit("Exit Short", from_entry = "MarketAlpha Short", profit = profitpoints,loss = stoplosspoints)
Published by ChaoZhang on the FMZ strategy square · last modified 2024-01-24. Collected in the Quant Trading Vault. Unvalidated research: re-test with your own data and costs before trusting it.
Build this with AgenKit
A spec is not a trading system. Paste this into your coding agent and AgenKit runs a specialist team — architecture, test-first build, risk gates, review — with paper trading on by default.
/agenkit build a production-grade trading bot with a backtest engine, risk controls and paper trading by default from strategies/Moving-Average-Crossover-Trading-Strategy-439844.md- npx agenkit install engineering-kit in your project
- Paste the command into your agent and approve each phase
- Get tests, backtest, risk controls and a paper-trading switch
Understand it first
Before you run this, read the lesson behind the idea and how to backtest it honestly. Specs like this one are the survivors of an unknown number of trials; deflate their results accordingly.
Related specs
- ADX MA and EMA Long Only Trend Tracking StrategyPine Script · Trend following · 1d
- ATR and Moving Average Crossover Hybrid StrategyPine Script · Trend following · 1h
- Bollinger Band Moving Average Crossover StrategyPine Script · Trend following · 1h
- Bollinger Bands and EMA Trend Following StrategyPine Script · Trend following · 1h
- Bollinger Bands and RSI Trend Following StrategyPine Script · Trend following · 1h
- Candlestick Pattern Trend Filter StrategyPine Script · Trend following · 1d