Strategy vault / Machine learning
MT Coordination Trading Strategy
The MT-Coordination Trading Strategy is an advanced quantitative trading strategy integrating multiple technical indicators to identify short-term trading opportunities in financial markets. Designed by renowned…
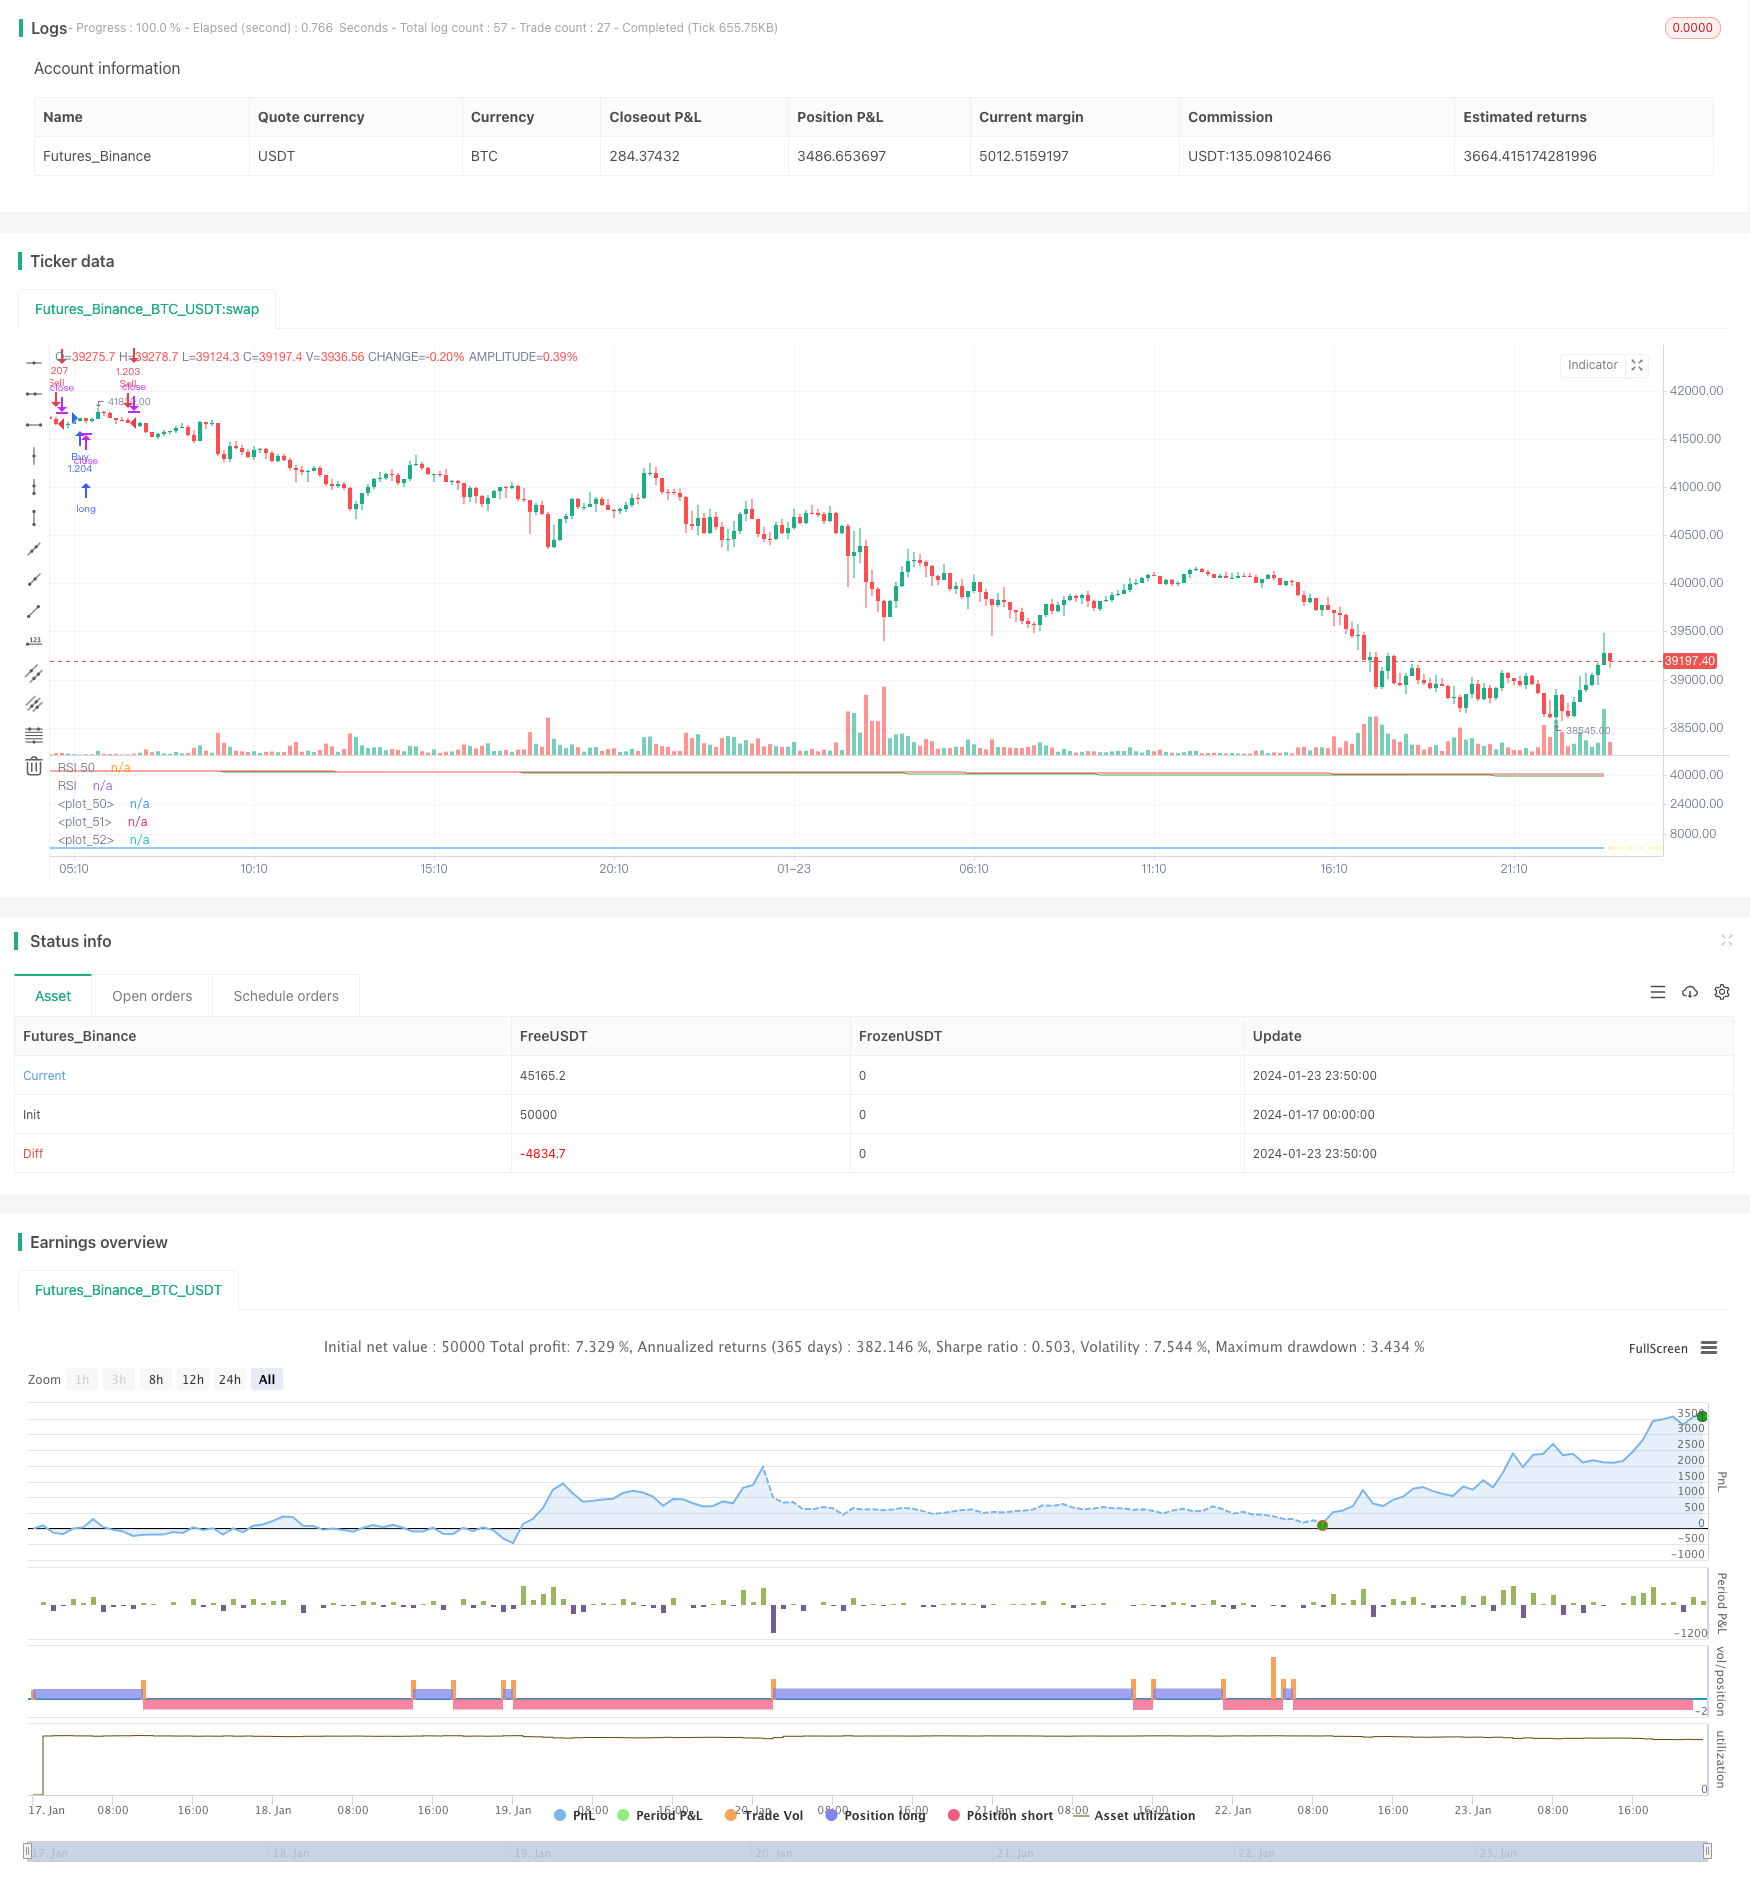
Overview
The MT-Coordination Trading Strategy is an advanced quantitative trading strategy integrating multiple technical indicators to identify short-term trading opportunities in financial markets. Designed by renowned trader I3ig_Trades, it is specialized for high-frequency trading.
Strategy Logic
The strategy incorporates three Smoothed Moving Averages (SMA) of different timeframes (21, 50, 200), the 14-day Relative Strength Index (RSI) and the Williams Fractals (2 days). The specific entry logic is defined as follows:
Long signal: Triggered when close is above all three SMAs, RSI is above 50 and current high is greater than the previous fractal up.
Short signal: Activated when close is below all three SMAs, RSI is below 50 and current low is less than the previous fractal down.
Position sizing is dynamically calculated based on selected percentage of equity and leverage level.
Advantage Analysis
This strategy combines multiple indicators to filter out false signals and identify high probability breakout levels, greatly reducing trading risk. Meanwhile, the position sizing is set according to a percentage of account equity, controlling single loss.
Specific strengths are:
Using multi timeframe indicators for confirmation to avoid traps. SMAs recognize trends across short, medium and long terms.
RSI avoids overbought and oversold zones. Values above 50 signal bullishness and below 50 signal bearishness.
Williams Fractals further verify the breakout, only entering on penetration of extremes.
Dynamic position sizing based on percentage of account balance strictly manages downside.
Customizable parameters suit different trading styles.
Risk Analysis
The main risks of this strategy include:
Failure to fully avoid whipsaws when SMAs diverge.
Inability to exit timely before trend reversal due to lagging indicators.
Risk of losing the full position in extreme moves when loss exceeds preset.
Solutions:
Optimize SMAs combinations to find best parameters.
Add candlestick filters to further avoid false breakouts.
Reduce percentage and leverage levels appropriately.
Optimization Directions
The strategy can be further enhanced by:
Testing different combinations of SMAs and RSI for optimal parameters.
Incorporating additional filters like Bollinger Bands width, traderjack signals etc.
Adding stop loss mechanisms to cut losses at a predefined level.
Integrating deep learning models for support and resistance detection.
Implementing adaptive position sizing scheme for sensible scaling of positions.
Conclusion
The MT-Coordination Trading Strategy is a mature breakout system leveraging multiple timeframes. By combining indicators to filter signals and dynamically managing position sizing, it is capable of consistent profits for capitalized funds and professional traders through continuous parameter tuning and model optimization.
Parameters
| Name | Default | What it controls |
|---|---|---|
| v_input_float_1 | true | Leverage |
| v_input_float_2 | 100 | Percent of Portfolio |
| v_input_int_1 | 14 | RSI Length |
| v_input_int_2 | 2 | Williams Fractals Length |
| v_input_int_3 | 21 | SMA 21 Length |
| v_input_int_4 | 50 | SMA 50 Length |
| v_input_int_5 | 200 | SMA 200 Length |
| v_input_1 | Buy Entry Parameters | |
| v_input_2 | Buy Exit Parameters | |
| v_input_3 | Sell Entry Parameters | |
| v_input_4 | Sell Exit Parameters |
Source Pine Script
/*backtest
start: 2024-01-17 00:00:00
end: 2024-01-24 00:00:00
period: 10m
basePeriod: 1m
exchanges: [{"eid":"Futures_Binance","currency":"BTC_USDT"}]
*/

//@version=5
// Written by I3ig_Trades. Follow And Let Me Know Any Strategies You'd Like To See!
strategy("Best Scalping Strategy Period (TMA)", shorttitle="Best Scalping Strategy Period (TMA)", overlay=false,
         initial_capital=100000,
         default_qty_type=strategy.percent_of_equity,
         default_qty_value=100)

// Leverage Input
leverage = input.float(1, title="Leverage", minval=1, step=0.1)

// Calculate position size based on the percentage of the portfolio and leverage
percentOfPortfolio = input.float(100, title="Percent of Portfolio")

// Define input options
rsiLength = input.int(14, title="RSI Length", minval=1)
williamsLength = input.int(2, title="Williams Fractals Length", minval=1)
sma21Length = input.int(21, title="SMA 21 Length", minval=1)
sma50Length = input.int(50, title="SMA 50 Length", minval=1)
sma200Length = input.int(200, title="SMA 200 Length", minval=1)

// Smoothed Moving Averages
sma21 = ta.sma(close, sma21Length)
sma50 = ta.sma(close, sma50Length)
sma200 = ta.sma(close, sma200Length)

// RSI
rsiValue = ta.rsi(close, rsiLength)

// Williams Fractals
fractalUp = ta.highest(close, williamsLength)
fractalDown = ta.lowest(close, williamsLength)

// Conditions for Buy Entry
buyCondition = close > sma21 and close > sma50 and close > sma200 and rsiValue > 50 and high > fractalUp[1]

// Conditions for Sell Entry
sellCondition = close < sma21 and close < sma50 and close < sma200 and rsiValue < 50 and low < fractalDown[1]

positionSizePercent = percentOfPortfolio / 100 * leverage
positionSize = strategy.equity * positionSizePercent / close

// Executing strategy with dynamic position size
if buyCondition
    strategy.entry("Buy", strategy.long, qty=positionSize)

if sellCondition
    strategy.entry("Sell", strategy.short, qty=positionSize)

// Plotting the Smoothed Moving Averages
plot(sma21, color=color.white)
plot(sma50, color=color.green)
plot(sma200, color=color.red)

// Plotting RSI and Fractals for visual confirmation
hline(50, "RSI 50", color=color.yellow)
plot(rsiValue, color=color.blue, title="RSI")

// Input text boxes for trading actions
var buy_entry_params = input("", title="Buy Entry Parameters")
var buy_exit_params = input("", title="Buy Exit Parameters")
var sell_entry_params = input("", title="Sell Entry Parameters")
var sell_exit_params = input("", title="Sell Exit Parameters")
Published by ChaoZhang on the FMZ strategy square · last modified 2024-01-25. Collected in the Quant Trading Vault. Unvalidated research: re-test with your own data and costs before trusting it.
Build this with AgenKit
A spec is not a trading system. Paste this into your coding agent and AgenKit runs a specialist team — architecture, test-first build, risk gates, review — with paper trading on by default.
/agenkit build a production-grade trading bot with a backtest engine, risk controls and paper trading by default from strategies/MT-Coordination-Trading-Strategy.md- npx agenkit install engineering-kit in your project
- Paste the command into your agent and approve each phase
- Get tests, backtest, risk controls and a paper-trading switch
Understand it first
Before you run this, read the lesson behind the idea and how to backtest it honestly. Specs like this one are the survivors of an unknown number of trials; deflate their results accordingly.
Related specs
- High Frequency Hybrid Technical Analysis Quantitative StrategyPine Script · Machine learning · 15m
- Multi indicator Assisted StrategyPine Script · Machine learning · 1d
- AI Powered Volatility Price System Divergence Trading StrategyPine Script · Machine learning · 1h
- Configurable BBRSIAroon Strategy BacktestPine Script · Machine learning · 5m
- EMA and RSI Quantitative Trading StrategyPine Script · Machine learning · 1h
- Triple Moving Average Combined with MACD Quantitative StrategyPine Script · Machine learning · 1d