Strategy vault / Trend following
Multi EMA Crossover Trend Following Strategy 437665
The Multi-EMA Crossover Trend Following Strategy combines multiple EMA lines with different parameters to identify trend directions based on crossover signals, aiming to follow trends in the market. It utilizes 7 EMA…
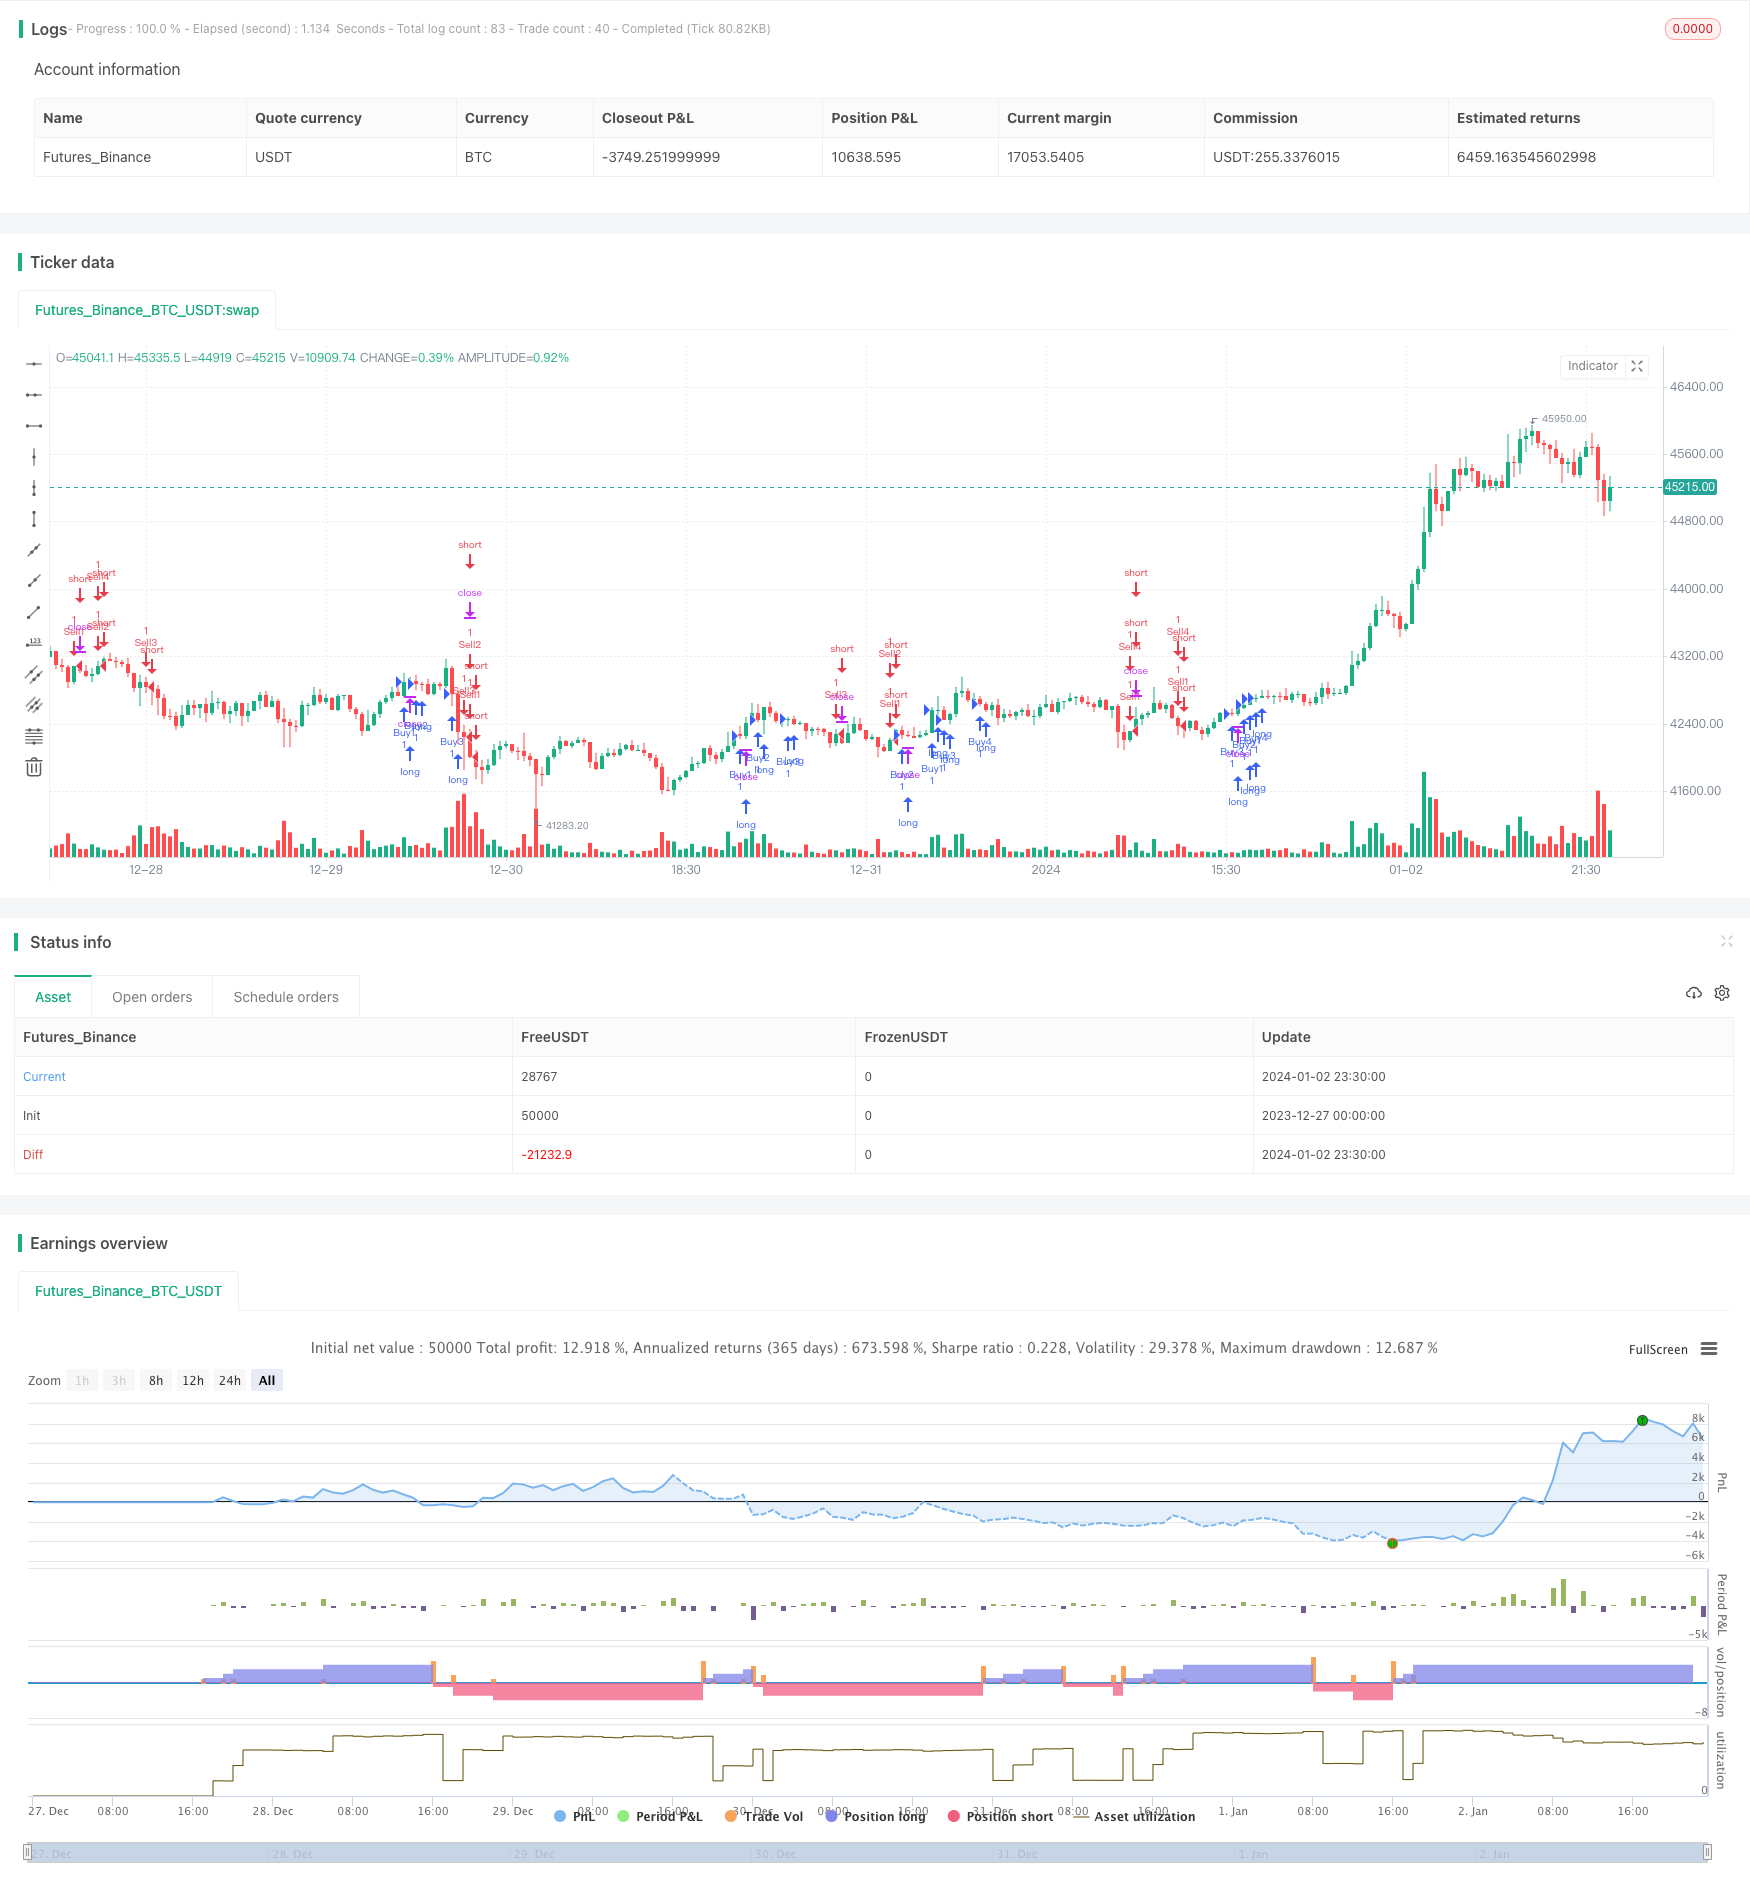
Overview
The Multi-EMA Crossover Trend Following Strategy combines multiple EMA lines with different parameters to identify trend directions based on crossover signals, aiming to follow trends in the market. It utilizes 7 EMA lines, including periods of 12, 26, 50, 100, 200, 89 and 144, by comparing their crossover situations.
Strategy Logic
The core logic of this strategy is based on the crossover principles of EMA lines. Among EMAs, shorter period EMAs are more sensitive to recent price changes and can reflect near-term trends, while longer period EMAs are less sensitive and represent long-term trends. When a shorter EMA crosses above a longer EMA from below, a "golden cross" is formed, indicating the short-term trend is turning bullish. A "death cross" appears when a shorter EMA crosses below a longer EMA from above, signaling a bearish trend reversal.
This strategy monitors 7 groups of EMA crossovers simultaneously, including 12&26, 12&50, 12&100, 12&200, 12&89 and 12&144 periods. For example, when the 12-day EMA crosses above the 26-day EMA, the strategy will open a long position. It will close the long position when a death cross happens. The same logic applies to other EMA pairs.
Advantage Analysis
The biggest advantage of this strategy is the ability to capture trends across multiple timeframes. By combining multiple EMAs, it can identify both short-term and long-term trends, realizing multi-timeframe trend following. In addition, the strategy performance can be optimized by adjusting EMA parameters.
Risk Analysis
The main risk of this strategy is overfrequent crossover signals when using multiple EMAs together. For example, crossovers between 12-day and 26-day EMAs happen more often than those between 12-day and 200-day lines. Frequent entries and exits may increase trading costs and slippage. Also, EMAs have lagging nature, which may cause untimely trade signals.
To mitigate the risks, EMA periods can be optimized to control crossover frequency at proper levels. Limiting max daily entry numbers or setting stop loss may also restrict risks.
Improvement Directions
The main optimization space lies in adjusting EMA parameters, such as experimenting with more period combinations or trying other moving averages like SMA. Additional filters can also be added to improve signal quality, for example, volume or volatility indicators. Furthermore, stop loss strategies may be used to reduce the impact of market turbulence.
Conclusion
The Multi-EMA Crossover Trend Following Strategy identifies trend directions by comparing crossover situations among multiple EMAs, capturing trends across timeframes. Its advantage is the flexibility to tweak parameters and catch trends on different levels. The drawback is potentially overfrequent signals and increased trading costs. Further improvements can be achieved through parameter optimization and adding supplementary conditions.
Parameters
| Name | Default | What it controls |
|---|---|---|
| v_input_1_close | 0 | Source: close | high | low | open | hl2 | hlc3 | hlcc4 | ohlc4 |
| v_input_2 | 12 | Shortest Line |
| v_input_3 | 26 | Shorter Line |
| v_input_4 | 50 | Short Line |
| v_input_5 | 100 | Middle Line |
| v_input_6 | 200 | Long Line |
| v_input_7 | 89 | Longer Line |
| v_input_8 | 144 | Longest Line |
Source Pine Script
/*backtest
start: 2023-12-27 00:00:00
end: 2024-01-03 00:00:00
period: 30m
basePeriod: 15m
exchanges: [{"eid":"Futures_Binance","currency":"BTC_USDT"}]
*/

//@version=2
strategy("EMA Trades", overlay=true, pyramiding=4)

src = input(close, title="Source")

shortestLine = input(12, minval=1, title="Shortest Line")
shorterLine = input(26, minval=1, title="Shorter Line")
shortLine = input(50, minval=1, title="Short Line")
middleLine = input(100, minval=1, title="Middle Line")
longLine = input(200, minval=1, title="Long Line")
longerLine = input(89, minval=1, title="Longer Line")
longestLine = input(144, minval=1, title="Longest Line")

shortestLineOutput = ema(src, shortestLine)
shorterLineOutput = ema(src, shorterLine)
shortLineOutput = ema(src, shortLine)
middleLineOutput = ema(src, middleLine)
longLineOutput = ema(src, longLine)
longerLineOutput = ema(src, longerLine)
longestLineOutput = ema(src, longestLine)

//plot(shortestLineOutput, title="Shortest EMA", color=#ffffff)
//plot(shorterLineOutput, title="Shorter EMA", color=#e54fe6)
//plot(shortLineOutput, title="Short EMA", color=#4e6bc3)
//plot(middleLineOutput, title="Middle EMA", color=#1dd6d8)
//plot(longLineOutput, title="Long EMA", color=#d0de10)
//plot(longerLineOutput, title="Longer EMA", color=#ef6a1a)
//plot(longestLineOutput, title="Longest EMA", color=#ff0e0e)

longEnrtyCondition_1 = crossover(shortestLineOutput[1], shorterLineOutput[1]) and shortestLineOutput > shorterLineOutput
longEntryCondition_2 = crossover(shortestLineOutput[1], shortLineOutput[1]) and shortestLineOutput > shortLineOutput
longEnrtyCondition_3 = crossover(shortestLineOutput[1], middleLineOutput[1]) and shortestLineOutput > middleLineOutput
longEntryCondition_4 = crossover(shortestLineOutput[1], longLineOutput[1]) and shortestLineOutput > longLineOutput

shortEnrtyCondition_1 = crossunder(shortestLineOutput[1], shorterLineOutput[1]) and shortestLineOutput < shorterLineOutput
shortEntryCondition_2 = crossunder(shortestLineOutput[1], shortLineOutput[1]) and shortestLineOutput < shortLineOutput
shortEnrtyCondition_3 = crossunder(shortestLineOutput[1], middleLineOutput[1]) and shortestLineOutput < middleLineOutput
shortEntryCondition_4 = crossunder(shortestLineOutput[1], longLineOutput[1]) and shortestLineOutput < longLineOutput

if (longEnrtyCondition_1)
    strategy.entry("Buy1", strategy.long)
    strategy.exit("Sell1")

if (longEntryCondition_2)
    strategy.entry("Buy2", strategy.long)
    strategy.exit("Sell2")

if (longEnrtyCondition_3)
    strategy.entry("Buy3", strategy.long)
    strategy.exit("Sell3")

if (longEntryCondition_4)
    strategy.entry("Buy4", strategy.long)
    strategy.exit("Sell4")

if (shortEnrtyCondition_1)
    strategy.entry("Sell1", strategy.short)
    strategy.exit("Buy1")

if (shortEntryCondition_2)
    strategy.entry("Sell2", strategy.short)
    strategy.exit("Buy2")

if (shortEnrtyCondition_3)
    strategy.entry("Sell3", strategy.short)
    strategy.exit("Buy3")

if (shortEntryCondition_4)
    strategy.entry("Sell4", strategy.short)
strategy.exit("Buy4")Published by ChaoZhang on the FMZ strategy square · last modified 2024-01-04. Collected in the Quant Trading Vault. Unvalidated research: re-test with your own data and costs before trusting it.
Build this with AgenKit
A spec is not a trading system. Paste this into your coding agent and AgenKit runs a specialist team — architecture, test-first build, risk gates, review — with paper trading on by default.
/agenkit build a production-grade trading bot with a backtest engine, risk controls and paper trading by default from strategies/Multi-EMA-Crossover-Trend-Following-Strategy-437665.md- npx agenkit install engineering-kit in your project
- Paste the command into your agent and approve each phase
- Get tests, backtest, risk controls and a paper-trading switch
Understand it first
Before you run this, read the lesson behind the idea and how to backtest it honestly. Specs like this one are the survivors of an unknown number of trials; deflate their results accordingly.
Related specs
- ADX MA and EMA Long Only Trend Tracking StrategyPine Script · Trend following · 1d
- ATR and Moving Average Crossover Hybrid StrategyPine Script · Trend following · 1h
- Bollinger Band Moving Average Crossover StrategyPine Script · Trend following · 1h
- Bollinger Bands and EMA Trend Following StrategyPine Script · Trend following · 1h
- Bollinger Bands and RSI Trend Following StrategyPine Script · Trend following · 1h
- Candlestick Pattern Trend Filter StrategyPine Script · Trend following · 1d