Strategy vault / Trend following
Multi EMA Crossover with Camarilla Support Resistance Trend Trading System
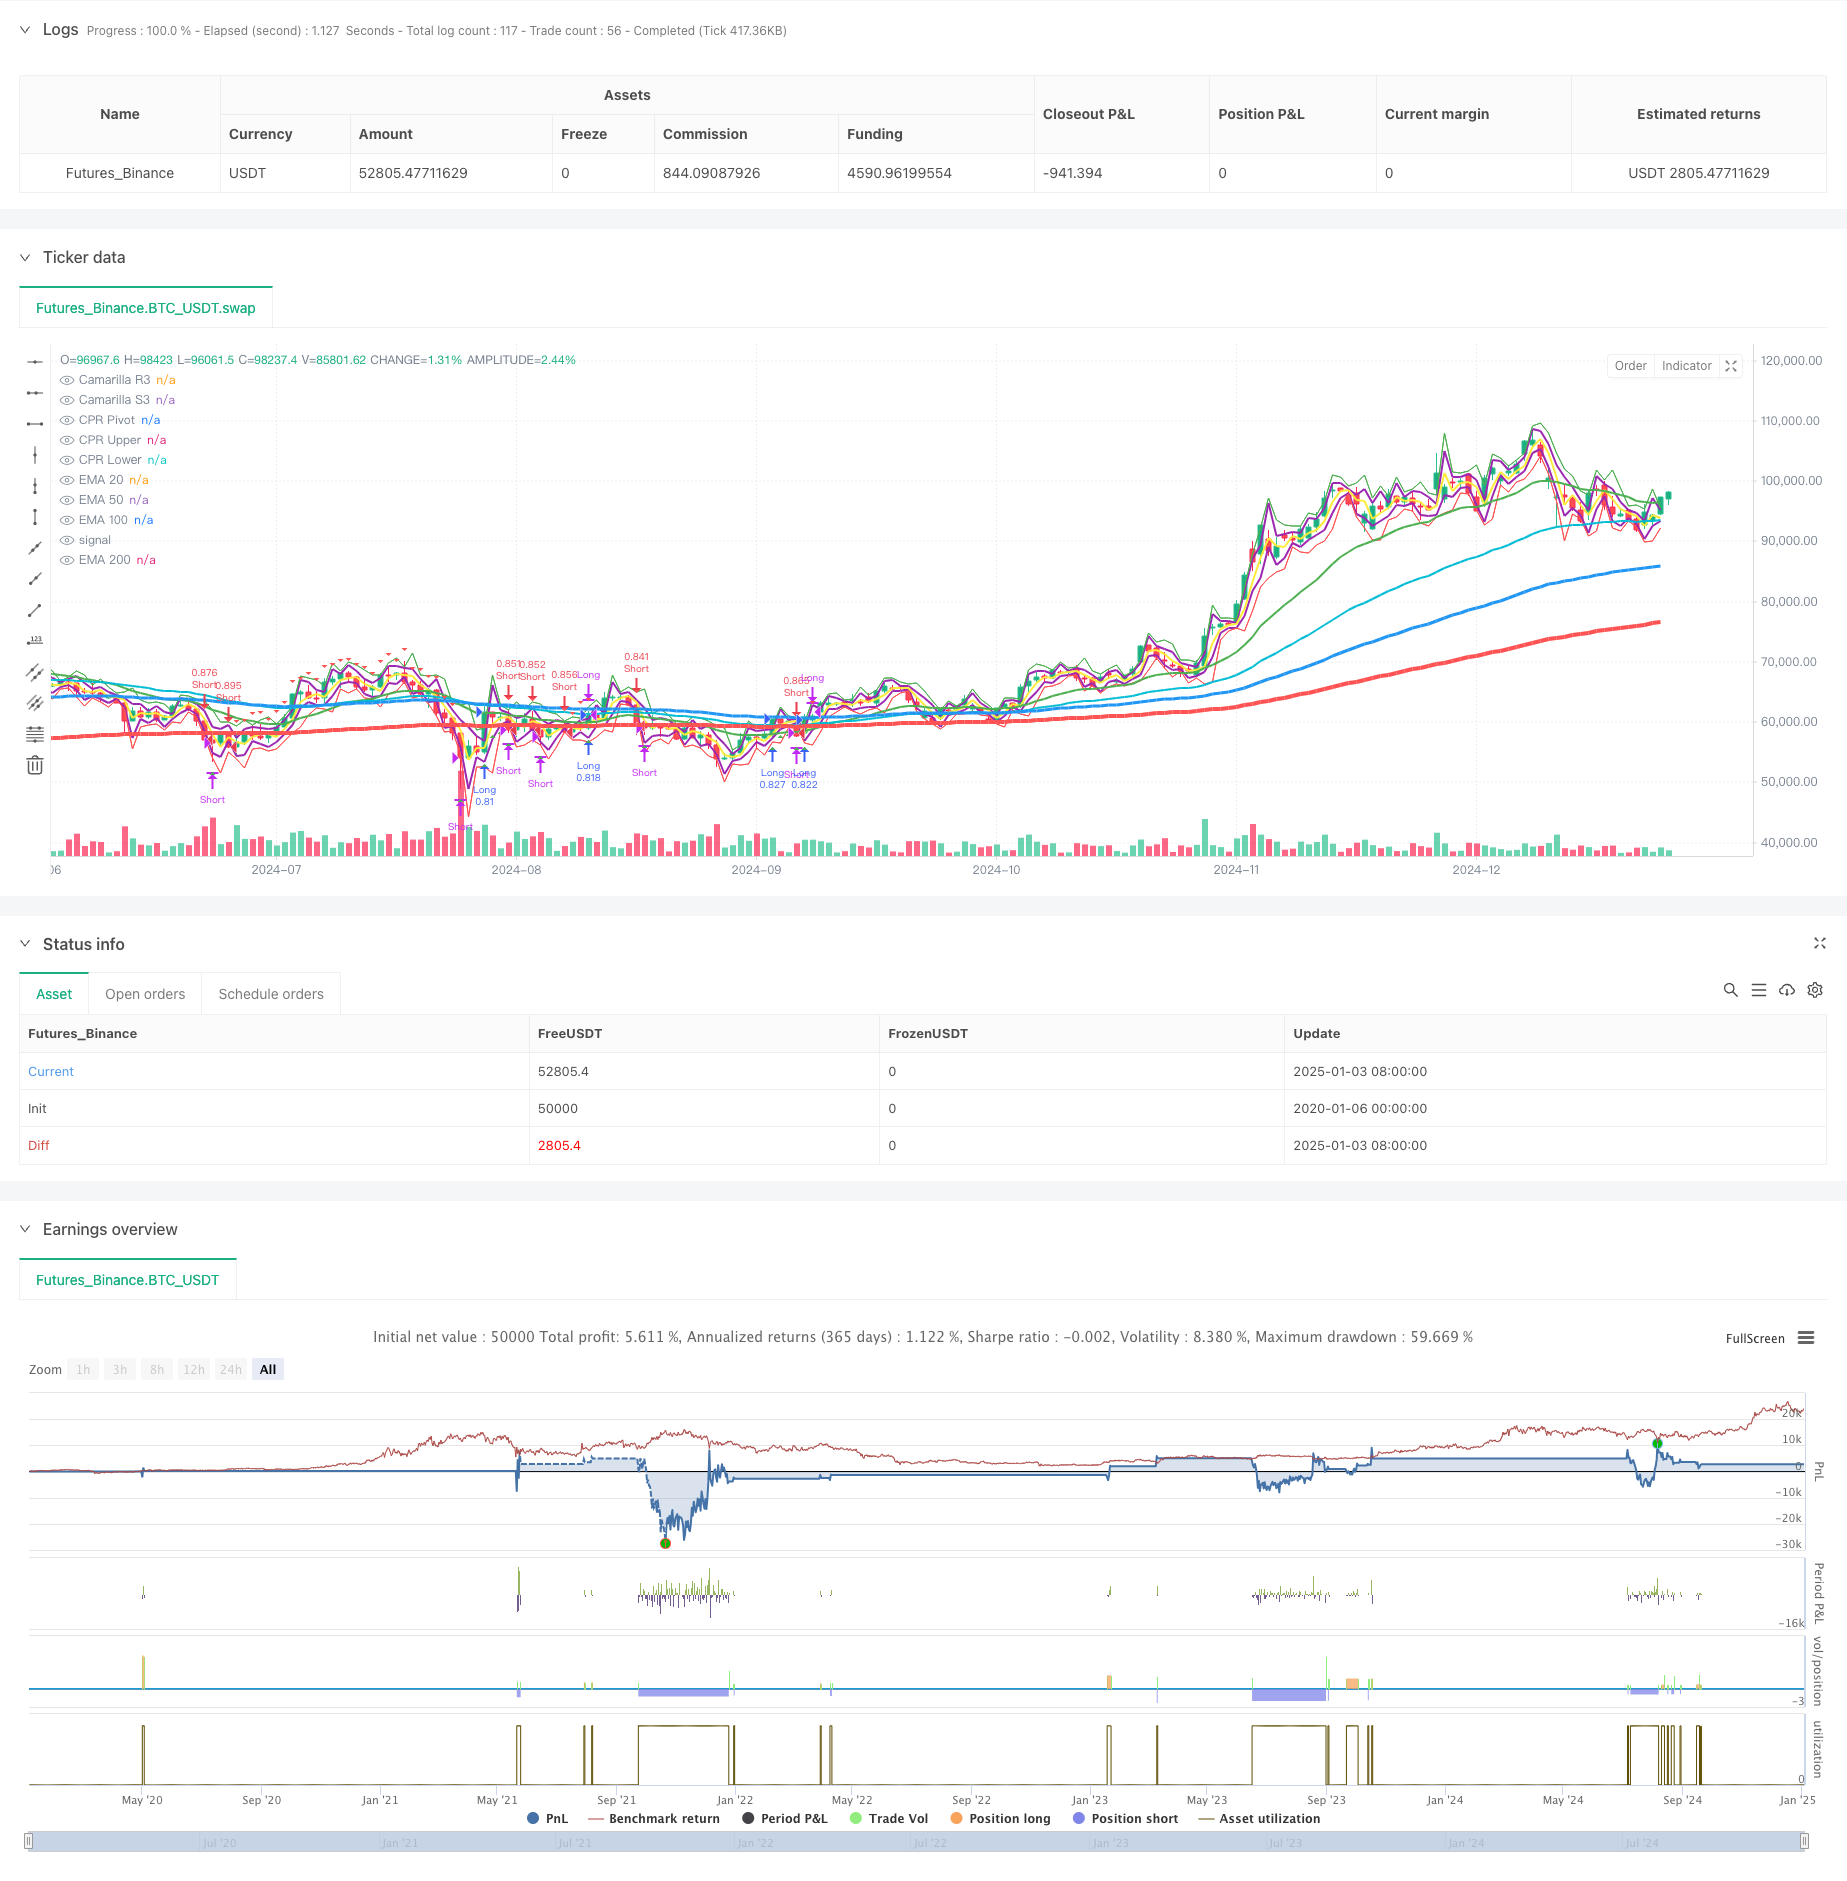
This strategy is a trend following trading system that combines multiple Exponential Moving Averages (EMA), Camarilla Support/Resistance levels, and Central Pivot Range (CPR). The system identifies market trends and…
Overview
This strategy is a trend following trading system that combines multiple Exponential Moving Averages (EMA), Camarilla Support/Resistance levels, and Central Pivot Range (CPR). The system identifies market trends and potential trading opportunities by analyzing price relationships with multiple moving averages and key price zones. It implements strict money management and risk control measures, including percentage-based position sizing and diverse exit mechanisms.
Strategy Principles
The strategy is based on several core components:
- Multiple EMA system (20/50/100/200) for trend direction and strength confirmation
- Camarilla Support/Resistance levels (R3/S3) for identifying key price levels
- Central Pivot Range (CPR) for determining intraday trading ranges
- Entry signals based on price crossovers with EMA200 and EMA20 confirmation
- Exit strategies including fixed points and percentage movement modes
- Money management system that dynamically adjusts position sizes based on account size
Strategy Advantages
- Integration of multi-dimensional technical indicators provides more reliable trading signals
- Flexible exit mechanisms adapt to different market conditions
- Comprehensive money management system effectively controls risk
- Trend following characteristics help capture major market moves
- Visualization components help traders understand market structure
Strategy Risks
- May generate false signals in ranging markets
- Multiple indicators might lead to lagging trade signals
- Fixed exit points may underperform in high volatility markets
- Requires substantial capital to withstand drawdowns
- Trading costs may impact overall strategy returns
Strategy Optimization Directions
- Introduce volatility indicators to dynamically adjust entry/exit parameters
- Add market state identification module to adapt to different market conditions
- Optimize money management system with dynamic position management
- Add trading time filters to improve signal quality
- Consider adding volume analysis to enhance signal reliability
Summary
The strategy integrates multiple classic technical analysis tools to build a complete trading system. Its strengths lie in multi-dimensional market analysis and strict risk management, while attention needs to be paid to adaptability in different market environments. Through continuous optimization and improvement, the strategy has the potential to enhance profitability while maintaining stability.
Source Pine Script
/*backtest
start: 2020-01-06 00:00:00
end: 2025-01-04 08:00:00
period: 1d
basePeriod: 1d
exchanges: [{"eid":"Futures_Binance","currency":"BTC_USDT"}]
*/

//@version=5
strategy("Pradeep Crude oil Entry and Exit", overlay=true)

// Input settings for EMAs
ema20_period = input.int(20, title="EMA 20 Period")
ema50_period = input.int(50, title="EMA 50 Period")
ema100_period = input.int(100, title="EMA 100 Period")
ema200_period = input.int(200, title="EMA 200 Period")

// Fixed line width settings for EMAs
ema20_width = 2  // EMA 20 Line Width
ema50_width = 2  // EMA 50 Line Width
ema100_width = 3 // EMA 100 Line Width
ema200_width = 4 // EMA 200 Line Width

// Backtesting inputs
initial_capital = input.float(50000, title="Initial Capital", minval=100)
position_size_percent = input.float(100, title="Position Size (% of Capital)", minval=0.1, maxval=100)
exit_mode = input.string("Price Movement", title="Exit Mode", options=["Price Movement", "Percentage Movement"])
exit_points = input.int(20, title="Exit After X Points", minval=1)
exit_percentage = input.float(1.0, title="Exit After X% Movement", minval=0.1, step=0.1)

// Calculate EMAs
ema20 = ta.ema(close, ema20_period)
ema50 = ta.ema(close, ema50_period)
ema100 = ta.ema(close, ema100_period)
ema200 = ta.ema(close, ema200_period)

// Signal conditions
long_entry_condition = close > ema200 and close > ema20 and close[1] <= ema200
long_exit_condition = (exit_mode == "Price Movement" and close - strategy.position_avg_price >= exit_points * syminfo.mintick) or
                      (exit_mode == "Percentage Movement" and (close - strategy.position_avg_price) / strategy.position_avg_price * 100 >= exit_percentage)
short_entry_condition = close < ema200 and close < ema20 and close[1] >= ema200
short_exit_condition = (exit_mode == "Price Movement" and strategy.position_avg_price - close >= exit_points * syminfo.mintick) or
                       (exit_mode == "Percentage Movement" and (strategy.position_avg_price - close) / strategy.position_avg_price * 100 >= exit_percentage)

// Plot EMAs with specified line widths
plot(ema20, color=color.green, title="EMA 20", linewidth=ema20_width)
plot(ema50, color=color.aqua, title="EMA 50", linewidth=ema50_width)
plot(ema100, color=color.blue, title="EMA 100", linewidth=ema100_width)
plot(ema200, color=color.red, title="EMA 200", linewidth=ema200_width)

// Camarilla Pivot Calculation
prev_high = request.security(syminfo.tickerid, "D", high[1])
prev_low = request.security(syminfo.tickerid, "D", low[1])
prev_close = request.security(syminfo.tickerid, "D", close[1])

R3 = prev_close + (prev_high - prev_low) * 1.1 / 2
S3 = prev_close - (prev_high - prev_low) * 1.1 / 2

// Central Pivot Range (CPR) Calculation
pivot = (prev_high + prev_low + prev_close) / 3
upper_cpr = pivot + (prev_high - prev_low)
lower_cpr = pivot - (prev_high - prev_low)

// Plot Camarilla R3, S3 and CPR levels
plot(R3, color=color.purple, title="Camarilla R3", linewidth=2)
plot(S3, color=color.purple, title="Camarilla S3", linewidth=2)
plot(pivot, color=color.yellow, title="CPR Pivot", linewidth=2)
plot(upper_cpr, color=color.green, title="CPR Upper", linewidth=1)
plot(lower_cpr, color=color.red, title="CPR Lower", linewidth=1)

// Backtesting: Capital and position size
capital = initial_capital
risk_per_trade = (position_size_percent / 100) * capital

// Long positions
if long_entry_condition
    strategy.entry("Long", strategy.long, qty=risk_per_trade / close)
    // Display entry price label
    label.new(bar_index, close, text="Entry: " + str.tostring(close), color=color.green, style=label.style_label_up, yloc=yloc.belowbar)

if long_exit_condition
    strategy.close("Long")
    // Display exit price label
    label.new(bar_index, close, text="Exit: " + str.tostring(close), color=color.red, style=label.style_label_down, yloc=yloc.abovebar)

// Short positions
if short_entry_condition
    strategy.entry("Short", strategy.short, qty=risk_per_trade / close)
    // Display entry price label
    label.new(bar_index, close, text="Entry: " + str.tostring(close), color=color.red, style=label.style_label_down, yloc=yloc.abovebar)

if short_exit_condition
    strategy.close("Short")
    // Display exit price label
    label.new(bar_index, close, text="Exit: " + str.tostring(close), color=color.green, style=label.style_label_up, yloc=yloc.belowbar)

// Plot signals
plotshape(long_entry_condition, style=shape.triangleup, location=location.belowbar, color=color.new(color.green, 0), size=size.small, title="Long Entry")
plotshape(long_exit_condition, style=shape.triangledown, location=location.abovebar, color=color.new(color.red, 0), size=size.small, title="Long Exit")
plotshape(short_entry_condition, style=shape.triangledown, location=location.abovebar, color=color.new(color.red, 0), size=size.small, title="Short Entry")
plotshape(short_exit_condition, style=shape.triangleup, location=location.belowbar, color=color.new(color.green, 0), size=size.small, title="Short Exit")
Published by ChaoZhang on the FMZ strategy square · last modified 2025-01-06. Collected in the Quant Trading Vault. Unvalidated research: re-test with your own data and costs before trusting it.
Build this with AgenKit
A spec is not a trading system. Paste this into your coding agent and AgenKit runs a specialist team — architecture, test-first build, risk gates, review — with paper trading on by default.
/agenkit build a production-grade trading bot with a backtest engine, risk controls and paper trading by default from strategies/Multi-EMA-Crossover-with-Camarilla-Support-Resistance-Trend-Trading-System.md- npx agenkit install engineering-kit in your project
- Paste the command into your agent and approve each phase
- Get tests, backtest, risk controls and a paper-trading switch
Understand it first
Before you run this, read the lesson behind the idea and how to backtest it honestly. Specs like this one are the survivors of an unknown number of trials; deflate their results accordingly.
Related specs
- Dual EMA Crossover StrategyPine Script · Trend following · 1d
- Dual Hull Moving Average Trading StrategyPine Script · Trend following · 1d
- Dual Moving Average Trend Following System with Adaptive Dynamic Filtering StrategyPine Script · Trend following · 30m
- EMA AROON ASHPine Script · Trend following · 3m
- EMA Crossover and MACD Signals Trend Following StrategyPine Script · Trend following · 1h
- EMA SMA Trend Following with Swing Trading Strategy Combined Volume Filter and Percentage Take Profit Stop Loss SystemPine Script · Trend following · 1d