Strategy vault / Trend following
Multi Factor Counter Trend Trading Strategy
The Multi-Factor Counter-Trend Trading Strategy is a sophisticated algorithmic trading system designed to identify potential reversal points after consecutive price rises or falls in the market. The strategy analyzes…
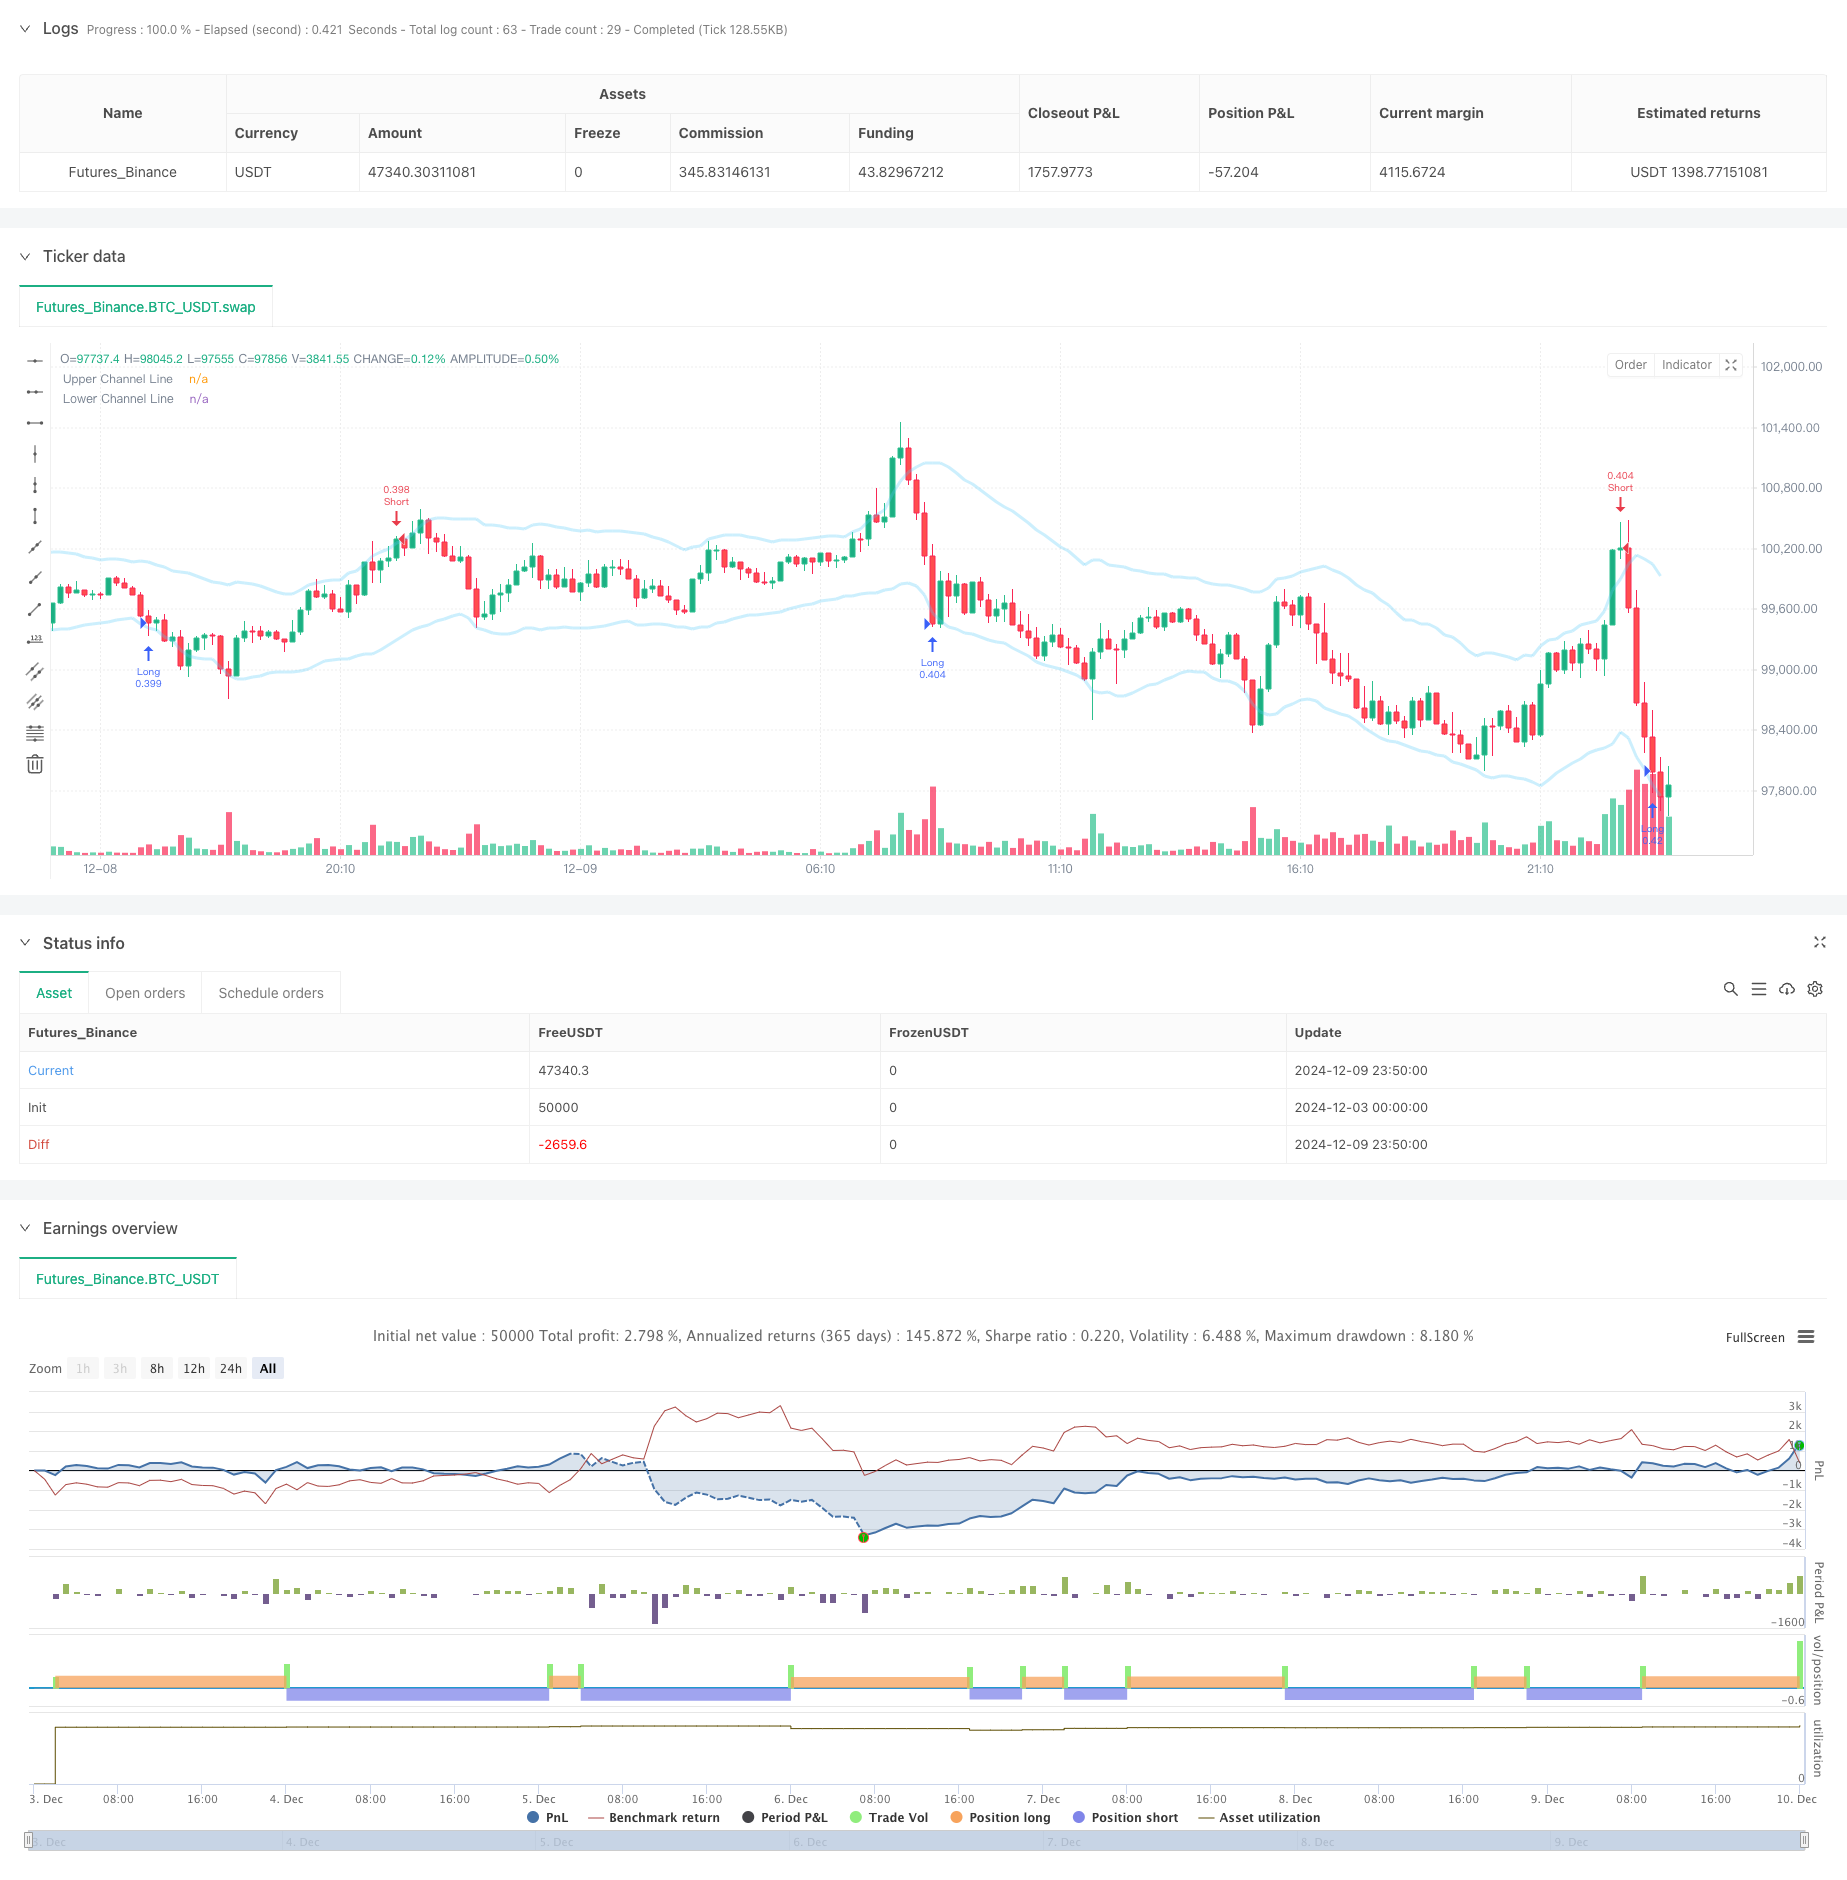
Overview
The Multi-Factor Counter-Trend Trading Strategy is a sophisticated algorithmic trading system designed to identify potential reversal points after consecutive price rises or falls in the market. The strategy analyzes price movements in conjunction with volume confirmation and channel bands (Bollinger Bands or Keltner Channels) to capture reversal opportunities in overbought or oversold conditions. The core strength lies in its multi-factor approach to enhance signal reliability and accuracy.
Strategy Principles
The strategy generates trading signals based on three core elements:
- Consecutive Price Movement Detection - Identifies strong trends through threshold settings for consecutive rising or falling bars
- Volume Confirmation Mechanism - Optional volume analysis requiring increasing volume during consecutive price movements
- Channel Breakout Verification - Supports both Bollinger Bands and Keltner Channels to confirm overbought/oversold conditions
Trade signals trigger when set conditions are met. The system plots triangle markers and executes corresponding long/short positions after bar confirmation. The strategy uses 80% of account equity for position sizing and factors in a 0.01% trading commission.
Strategy Advantages
- Multi-dimensional Signal Confirmation - Reduces false signals through comprehensive analysis of price, volume, and channel lines
- Flexible Parameter Configuration - Customizable bar count, optional volume and channel confirmation for different market conditions
- Clear Visual Feedback - Intuitive entry point visualization through triangle markers for monitoring and backtesting
- Rational Money Management - Dynamic position sizing based on account proportion for effective risk control
Strategy Risks
- Failed Reversal Risk - Counter-trend signals may lead to losses in strong trends
- Capital Efficiency Issues - Fixed 80% equity usage may be too aggressive in certain market conditions
- Time Lag Risk - Waiting for bar confirmation may result in suboptimal entry points
- Parameter Sensitivity - Performance varies significantly with different parameter combinations
Strategy Optimization Directions
- Implement Dynamic Stop-Loss - Consider adaptive stop-loss based on ATR or volatility
- Optimize Position Management - Consider dynamic position sizing based on market volatility
- Add Trend Filters - Incorporate trend indicators like moving averages to avoid counter-trend trades in strong trends
- Enhance Exit Mechanism - Design technical indicator-based profit-taking rules
- Market Environment Adaptation - Dynamically adjust strategy parameters based on market conditions
Summary
The Multi-Factor Counter-Trend Trading Strategy provides a systematic approach to reversal trading through comprehensive analysis of price patterns, volume changes, and channel breakouts. While the strategy excels in its flexible configuration and multi-dimensional signal confirmation, attention must be paid to market environment adaptation and risk control. The suggested optimization directions offer potential improvements for live trading performance.
Source Pine Script
/*backtest
start: 2024-12-03 00:00:00
end: 2024-12-10 00:00:00
period: 10m
basePeriod: 10m
exchanges: [{"eid":"Futures_Binance","currency":"BTC_USDT"}]
*/

//@version=5
strategy(title="The Bar Counter Trend Reversal Strategy [TradeDots]", overlay=true, initial_capital = 10000, default_qty_type = strategy.percent_of_equity, default_qty_value = 80, commission_type = strategy.commission.percent, commission_value = 0.01)

// Initialize variables
var bool rise_triangle_ready = false
var bool fall_triangle_ready = false
var bool rise_triangle_plotted = false
var bool fall_triangle_plotted = false

//Strategy condition setup
noOfRises = input.int(3, "No. of Rises", minval=1, group="STRATEGY")
noOfFalls = input.int(3, "No. of Falls", minval=1, group="STRATEGY")
volume_confirm = input.bool(false, "Volume Confirmation", group="STRATEGY")

channel_confirm = input.bool(true, "", inline="CHANNEL", group="STRATEGY")
channel_type = input.string("KC", "", inline="CHANNEL", options=["BB", "KC"],group="STRATEGY")
channel_source = input(close, "", inline="CHANNEL", group="STRATEGY")
channel_length = input.int(20, "", inline="CHANNEL", minval=1,group="STRATEGY")
channel_mult = input.int(2, "", inline="CHANNEL", minval=1,group="STRATEGY")

//Get channel line information
[_, upper, lower] = if channel_type == "KC"
    ta.kc(channel_source, channel_length,channel_mult)
else
    ta.bb(channel_source, channel_length,channel_mult)

//Entry Condition Check
if channel_confirm and volume_confirm
    rise_triangle_ready := ta.falling(close, noOfFalls) and ta.rising(volume, noOfFalls) and high > upper
    fall_triangle_ready := ta.rising(close, noOfRises) and ta.rising(volume, noOfRises) and low < lower

else if channel_confirm
    rise_triangle_ready := ta.falling(close, noOfFalls) and low < lower
    fall_triangle_ready := ta.rising(close, noOfRises) and high > upper

else if volume_confirm
    rise_triangle_ready := ta.falling(close, noOfFalls) and ta.rising(volume, noOfFalls)
    fall_triangle_ready := ta.rising(close, noOfRises) and ta.rising(volume, noOfRises)
else
    rise_triangle_ready := ta.falling(close, noOfFalls)
    fall_triangle_ready := ta.rising(close, noOfRises)

// Check if trend is reversed
if close > close[1]
    rise_triangle_plotted := false  // Reset triangle plotted flag

if close < close[1]
    fall_triangle_plotted := false

//Wait for bar close and enter trades
if barstate.isconfirmed
    // Plot triangle when ready and counts exceed threshold
    if rise_triangle_ready and not rise_triangle_plotted
        label.new(bar_index, low, yloc = yloc.belowbar, style=label.style_triangleup, color=color.new(#9CFF87,10))
        strategy.entry("Long", strategy.long)
        rise_triangle_plotted := true
        rise_triangle_ready := false  // Prevent plotting again until reset

    if fall_triangle_ready and not fall_triangle_plotted
        label.new(bar_index, low, yloc = yloc.abovebar, style=label.style_triangledown, color=color.new(#F9396A,10))
        strategy.entry("Short", strategy.short)
        fall_triangle_plotted := true
        fall_triangle_ready := false

// plot channel bands
plot(upper, color = color.new(#56CBF9, 70), linewidth = 3, title = "Upper Channel Line")
plot(lower, color = color.new(#56CBF9, 70), linewidth = 3, title = "Lower Channel Line")Published by ChaoZhang on the FMZ strategy square · last modified 2024-12-11. Collected in the Quant Trading Vault. Unvalidated research: re-test with your own data and costs before trusting it.
Build this with AgenKit
A spec is not a trading system. Paste this into your coding agent and AgenKit runs a specialist team — architecture, test-first build, risk gates, review — with paper trading on by default.
/agenkit build a production-grade trading bot with a backtest engine, risk controls and paper trading by default from strategies/Multi-Factor-Counter-Trend-Trading-Strategy.md- npx agenkit install engineering-kit in your project
- Paste the command into your agent and approve each phase
- Get tests, backtest, risk controls and a paper-trading switch
Understand it first
Before you run this, read the lesson behind the idea and how to backtest it honestly. Specs like this one are the survivors of an unknown number of trials; deflate their results accordingly.
Related specs
- Dynamic Moving Average and Bollinger Bands Cross Strategy with Fixed Stop Loss Optimization ModelPine Script · Trend following · 3h
- Relative Volume Trend Following Trading StrategyPine Script · Trend following · 1d
- AlphaTrend Dual Tracking StrategyPine Script · Trend following · 1h
- Moving Average Crossover Strategy 430371Pine Script · Trend following · 1h
- Multi indicator Trend Following Strategy 433078Pine Script · Trend following
- Dual directional Trailing Stop Moving Average Trend StrategyPine Script · Trend following · 1m