Multi factor Intelligent Trading Strategy
The Multi-factor Intelligent Trading Strategy is a powerful algo trading strategy that integrates multiple technical indicators. It combines Relative Strength Index (RSI), Bollinger Bands, Volume Profile, Fibonacci…
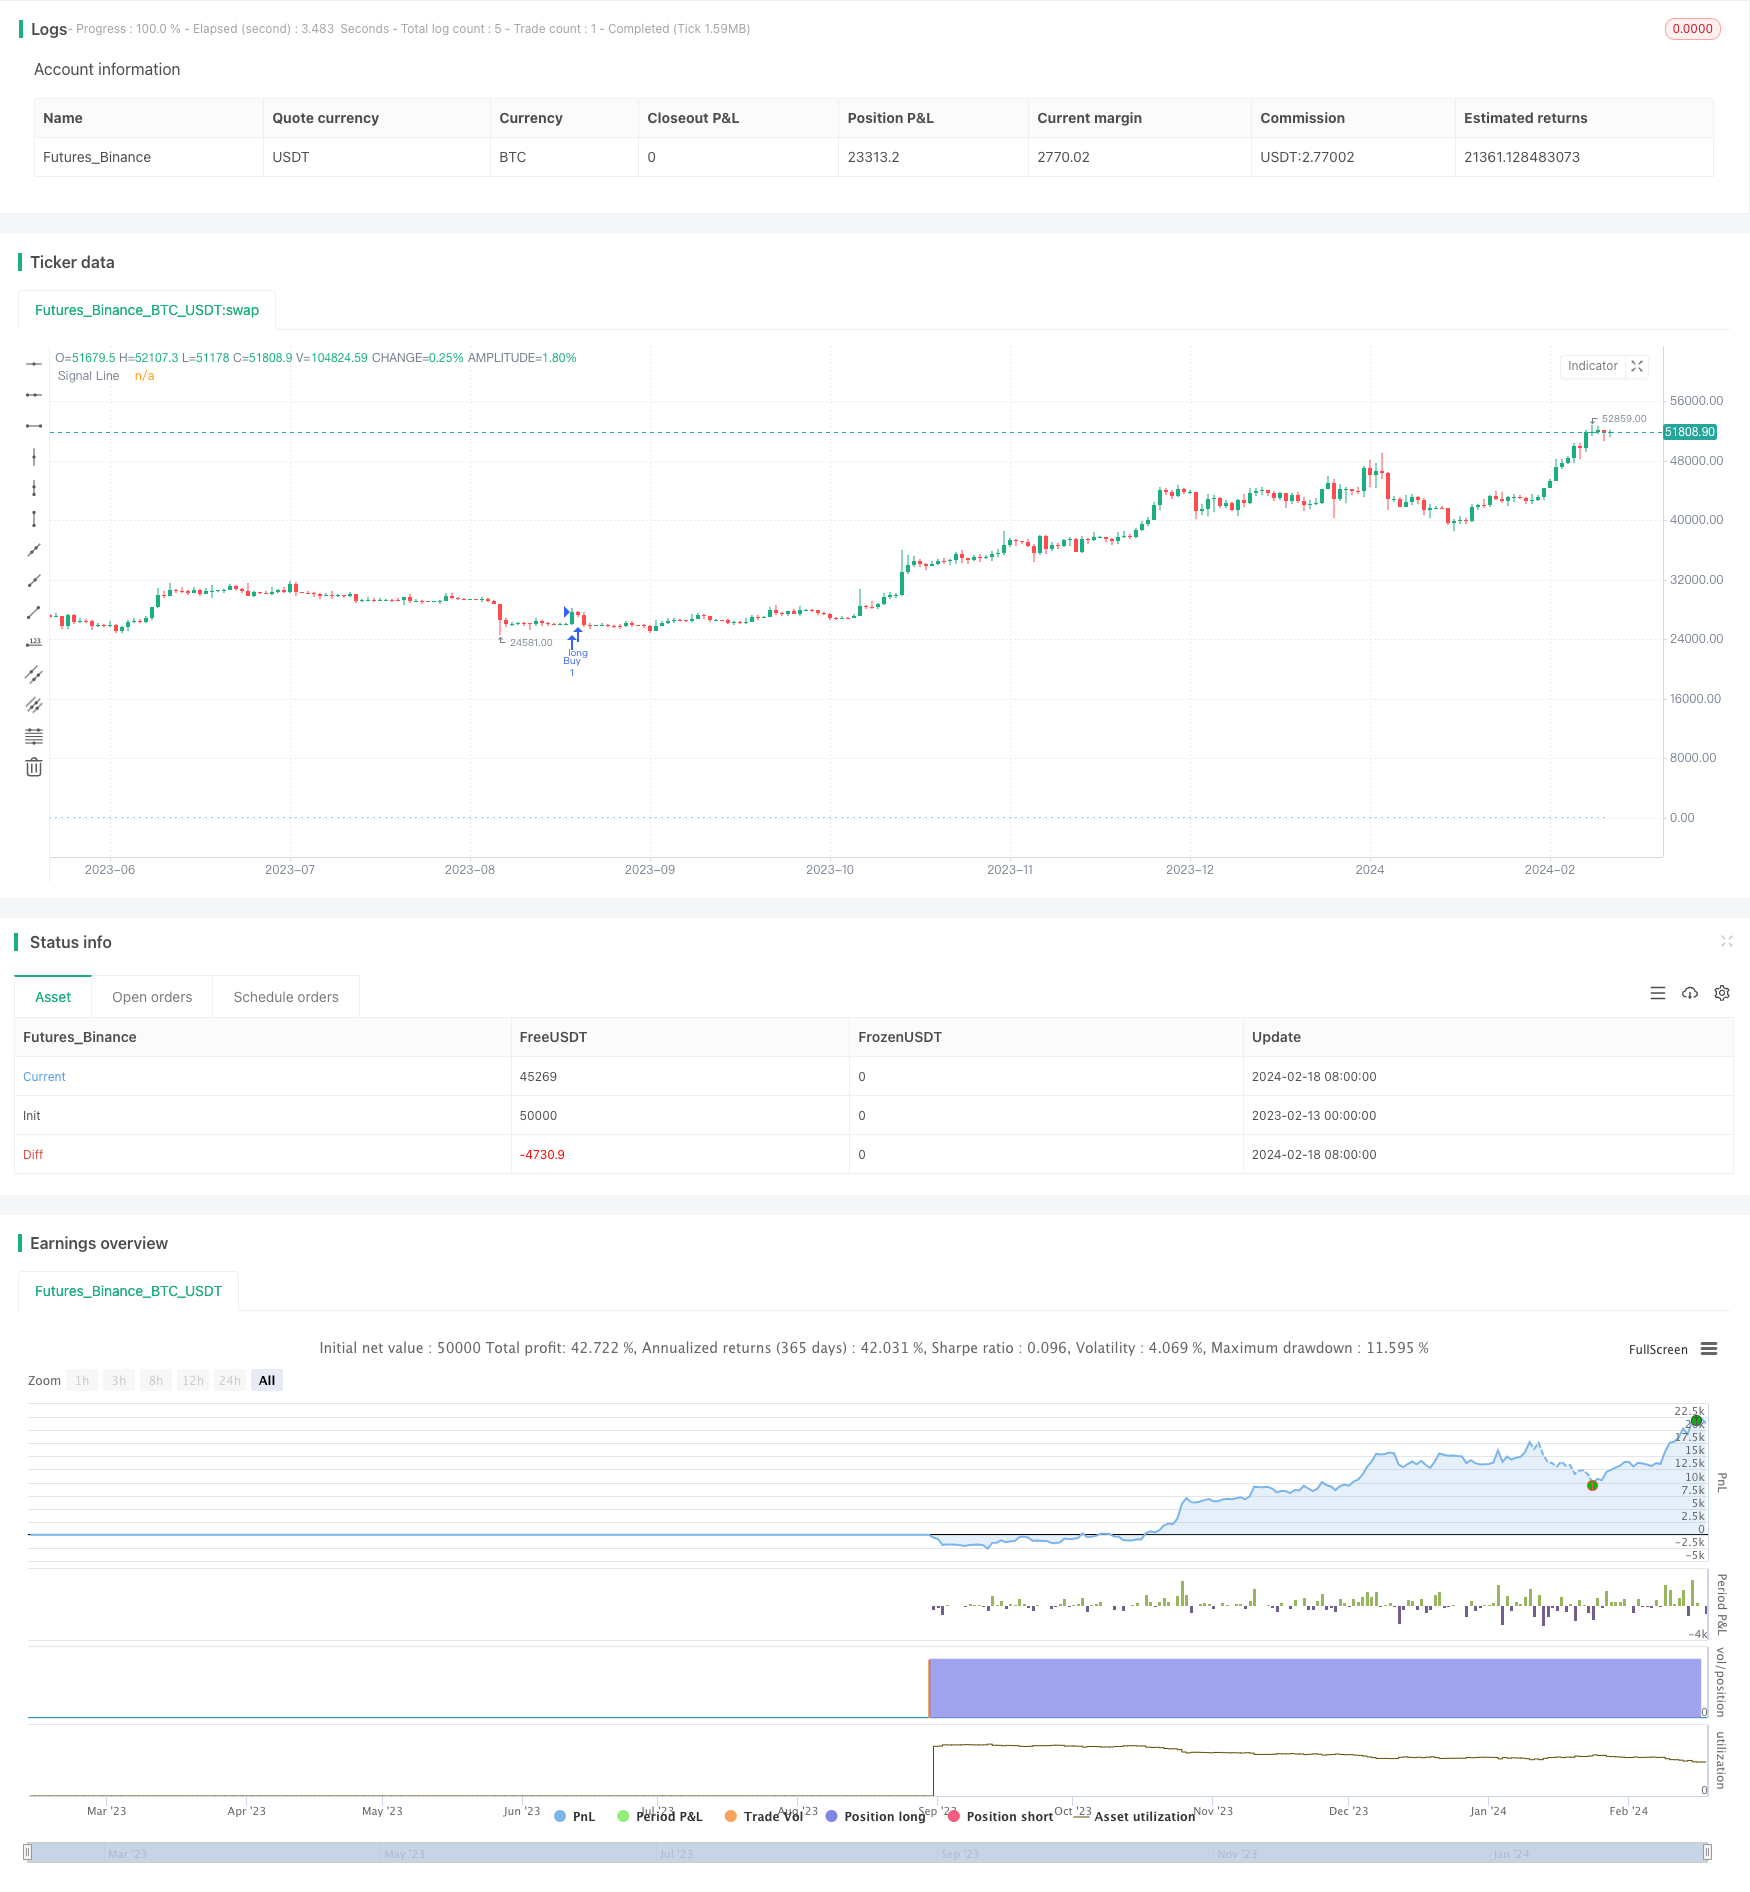
Overview
The Multi-factor Intelligent Trading Strategy is a powerful algo trading strategy that integrates multiple technical indicators. It combines Relative Strength Index (RSI), Bollinger Bands, Volume Profile, Fibonacci Retracement, Average Directional Index (ADX) and Volume Weighted Average Price (VWAP) to set entry and exit criteria for identifying potential trading opportunities in the financial markets.
Strategy Logic
The core principle of this strategy is based on the synthesis of multiple technical indicators. Firstly, it uses RSI to gauge momentum and identify overbought/oversold conditions. Secondly, it utilizes Bollinger Bands to spot volatility and potential trend changes. Additionally, it looks at Volume Profile for reliable support/resistance areas. It also factors in Fibonacci Retracement, ADX and VWAP to filter signals and confirm trends.
When multiple indicators meet the buy criteria, such as RSI crossing below 30 (oversold) and crossing above the 20-period SMA (middle band of Bollinger Bands), the strategy will generate a long entry signal. When sell criteria are met, like RSI surpassing 70 (overbought) and crossing below the middle band, a sell signal is triggered to close long positions. Such a multi-factor design improves signal reliability, reduces false signals, and catches major turning points in the markets.
Advantages Analysis
The Multi-factor Intelligent Trading Strategy has the following advantages:
Multi-factor design enhances signal quality and catches key breakouts while reducing noise.
A combination of indicators is used to confirm trends and filter incorrect signals.
It takes into account market momentum, volatility, volume-price relationship.
Captures potential opportunities from both reversal and trend-following tactics.
Customizable entry and exit criteria adaptable across different instruments and market regimes.
Clear visual signal line makes real trading execution straightforward.
Risk Analysis
Some risks to consider regarding this strategy:
Inadequate parameter optimization can lead to overtrading or missing signals. Robust in-sample and out-of-sample testing is critical.
Ineffective blending of factors may generate bad signals or add noise. Inter-relationships between factors need evaluation.
Inability to fully overcome directional bias from huge trends. Strict capital management essential for appropriate position sizing.
Price slippage upon entries and exits may erode actual P&L. Reasonable stop loss and take profit levels should be implemented.
Optimization Directions
The strategy can be further enhanced in the following aspects:
Test on more market data to find optimal combinations of indicator parameters for steady signals.
Incorporate machine learning models to aid multi-factor decision making.
Add more alternative data factors like sentiment measures to filter out noisy trades.
Employ adaptive stops to better adjust to evolving market landscapes.
Evaluate performance across more instruments like indices and futures.
Conclusion
The Multi-factor Intelligent Trading Strategy is a very effective quantitative approach that generates quality signals by synthesizing multiple factors while controlling risks. With continual testing and refinements, this strategy has strong practical merits and represents the future direction of quant strategy design - harnessing advanced models and diverse data sources for smarter decisions.
Parameters
| Name | Default | What it controls |
|---|---|---|
| v_input_1 | 14 | RSI Length |
| v_input_2 | 70 | Overbought |
| v_input_3 | 30 | Oversold |
| v_input_4 | 20 | Bollinger Bands Length |
| v_input_5 | 2 | Bollinger Bands Std Dev |
| v_input_6 | 200 | VPVR Length |
| v_input_7 | true | Fibonacci Retracement |
| v_input_8 | 14 | ADX Length |
| v_input_9 | 20 | VWAP Length |
Source Pine Script
/*backtest
start: 2023-02-13 00:00:00
end: 2024-02-19 00:00:00
period: 1d
basePeriod: 1h
exchanges: [{"eid":"Futures_Binance","currency":"BTC_USDT"}]
*/

// This source code is subject to the terms of the Mozilla Public License 2.0 at https://mozilla.org/MPL/2.0/
// © PRIDELEGENX005

//@version=5
//@version=5
strategy("ProfitCraft Strategy", shorttitle="CS", overlay=true)

// Input parameters
length = input(14, title="RSI Length")
overbought = input(70, title="Overbought")
oversold = input(30, title="Oversold")
bb_length = input(20, title="Bollinger Bands Length")
bb_mult = input(2, title="Bollinger Bands Std Dev")
vpvr_length = input(200, title="VPVR Length")
fibonacci_retracement = input(true, title="Fibonacci Retracement")
adx_length = input(14, title="ADX Length")
vwap_length = input(20, title="VWAP Length")

// Calculate RSI
rsi = ta.rsi(close, length)

// Calculate Bollinger Bands
sma = ta.sma(close, bb_length)
stddev = ta.stdev(close, bb_length)
upper_band = sma + bb_mult * stddev
lower_band = sma - bb_mult * stddev

// Calculate VPVR
vpvr_data = ta.sma(volume * (high - low), vpvr_length)

// Calculate Fibonacci Retracement
var high_fib = ta.highest(high, 30)
var low_fib = ta.lowest(low, 30)

// Calculate ADX (Manual calculation)
trueRange = ta.highest(high, 1) - ta.lowest(low, 1)
DMplus = ta.highest(high, 1) - high[1]
DMminus = low[1] - ta.lowest(low, 1)
TRn = ta.sma(trueRange, adx_length)
DMplusn = ta.sma(DMplus, adx_length)
DMminusn = ta.sma(DMminus, adx_length)
DIplus = 100 * (DMplusn / TRn)
DIminus = 100 * (DMminusn / TRn)
DX = 100 * math.abs(DIplus - DIminus) / (DIplus + DIminus)
ADX = ta.sma(DX, adx_length)

// Calculate VWAP
vwap = ta.sma(volume * close, vwap_length) / ta.sma(volume, vwap_length)

// Custom condition for buy/sell signals (example condition)
buy_condition = ta.crossover(rsi, oversold) and ta.crossover(close, sma)
sell_condition = ta.crossunder(rsi, overbought) and ta.crossunder(close, sma)

// Strategy entry and exit conditions
strategy.entry("Buy", strategy.long, when = buy_condition)
strategy.close("Buy", when = sell_condition)

// Plot the signal line
plot(buy_condition ? 1 : sell_condition ? -1 : 0, title="Signal Line", color=color.blue, style=plot.style_histogram)
Published by ChaoZhang on the FMZ strategy square · last modified 2024-02-20. Collected in the Quant Trading Vault. Unvalidated research: re-test with your own data and costs before trusting it.
Build this with AgenKit
A spec is not a trading system. Paste this into your coding agent and AgenKit runs a specialist team — architecture, test-first build, risk gates, review — with paper trading on by default.
/agenkit build a production-grade trading bot with a backtest engine, risk controls and paper trading by default from strategies/Multi-factor-Intelligent-Trading-Strategy.md- npx agenkit install engineering-kit in your project
- Paste the command into your agent and approve each phase
- Get tests, backtest, risk controls and a paper-trading switch
Understand it first
Before you run this, read the lesson behind the idea and how to backtest it honestly. Specs like this one are the survivors of an unknown number of trials; deflate their results accordingly.
Related specs
- Moving Average Crossover and Upper Rail Breakthrough Impulse StrategyPine Script · Breakout · 1m
- Dynamic Range Breakout Trading Strategy Based on Bollinger Bands and RSIPine Script · Breakout · 1d
- Multi Timeframe Momentum Breakout StrategyPine Script · Breakout · 1d
- Multi Filter Trend Breakthrough Smart Moving Average Trading StrategyPine Script · Breakout · 1h
- Cross Timeframe SuperTrend Breakout StrategyPine Script · Breakout · 1h
- Multi Indicator Trend Following and Volatility Breakout StrategyPine Script · Breakout · 2h