Strategy vault / Mean reversion
Multi factor Momentum Reversal Combo Strategy
This strategy is a multi-factor combo strategy that combines reversal factors and momentum factors to discover reversal opportunities in the market. The strategy first uses the long-term reversal factor to identify…
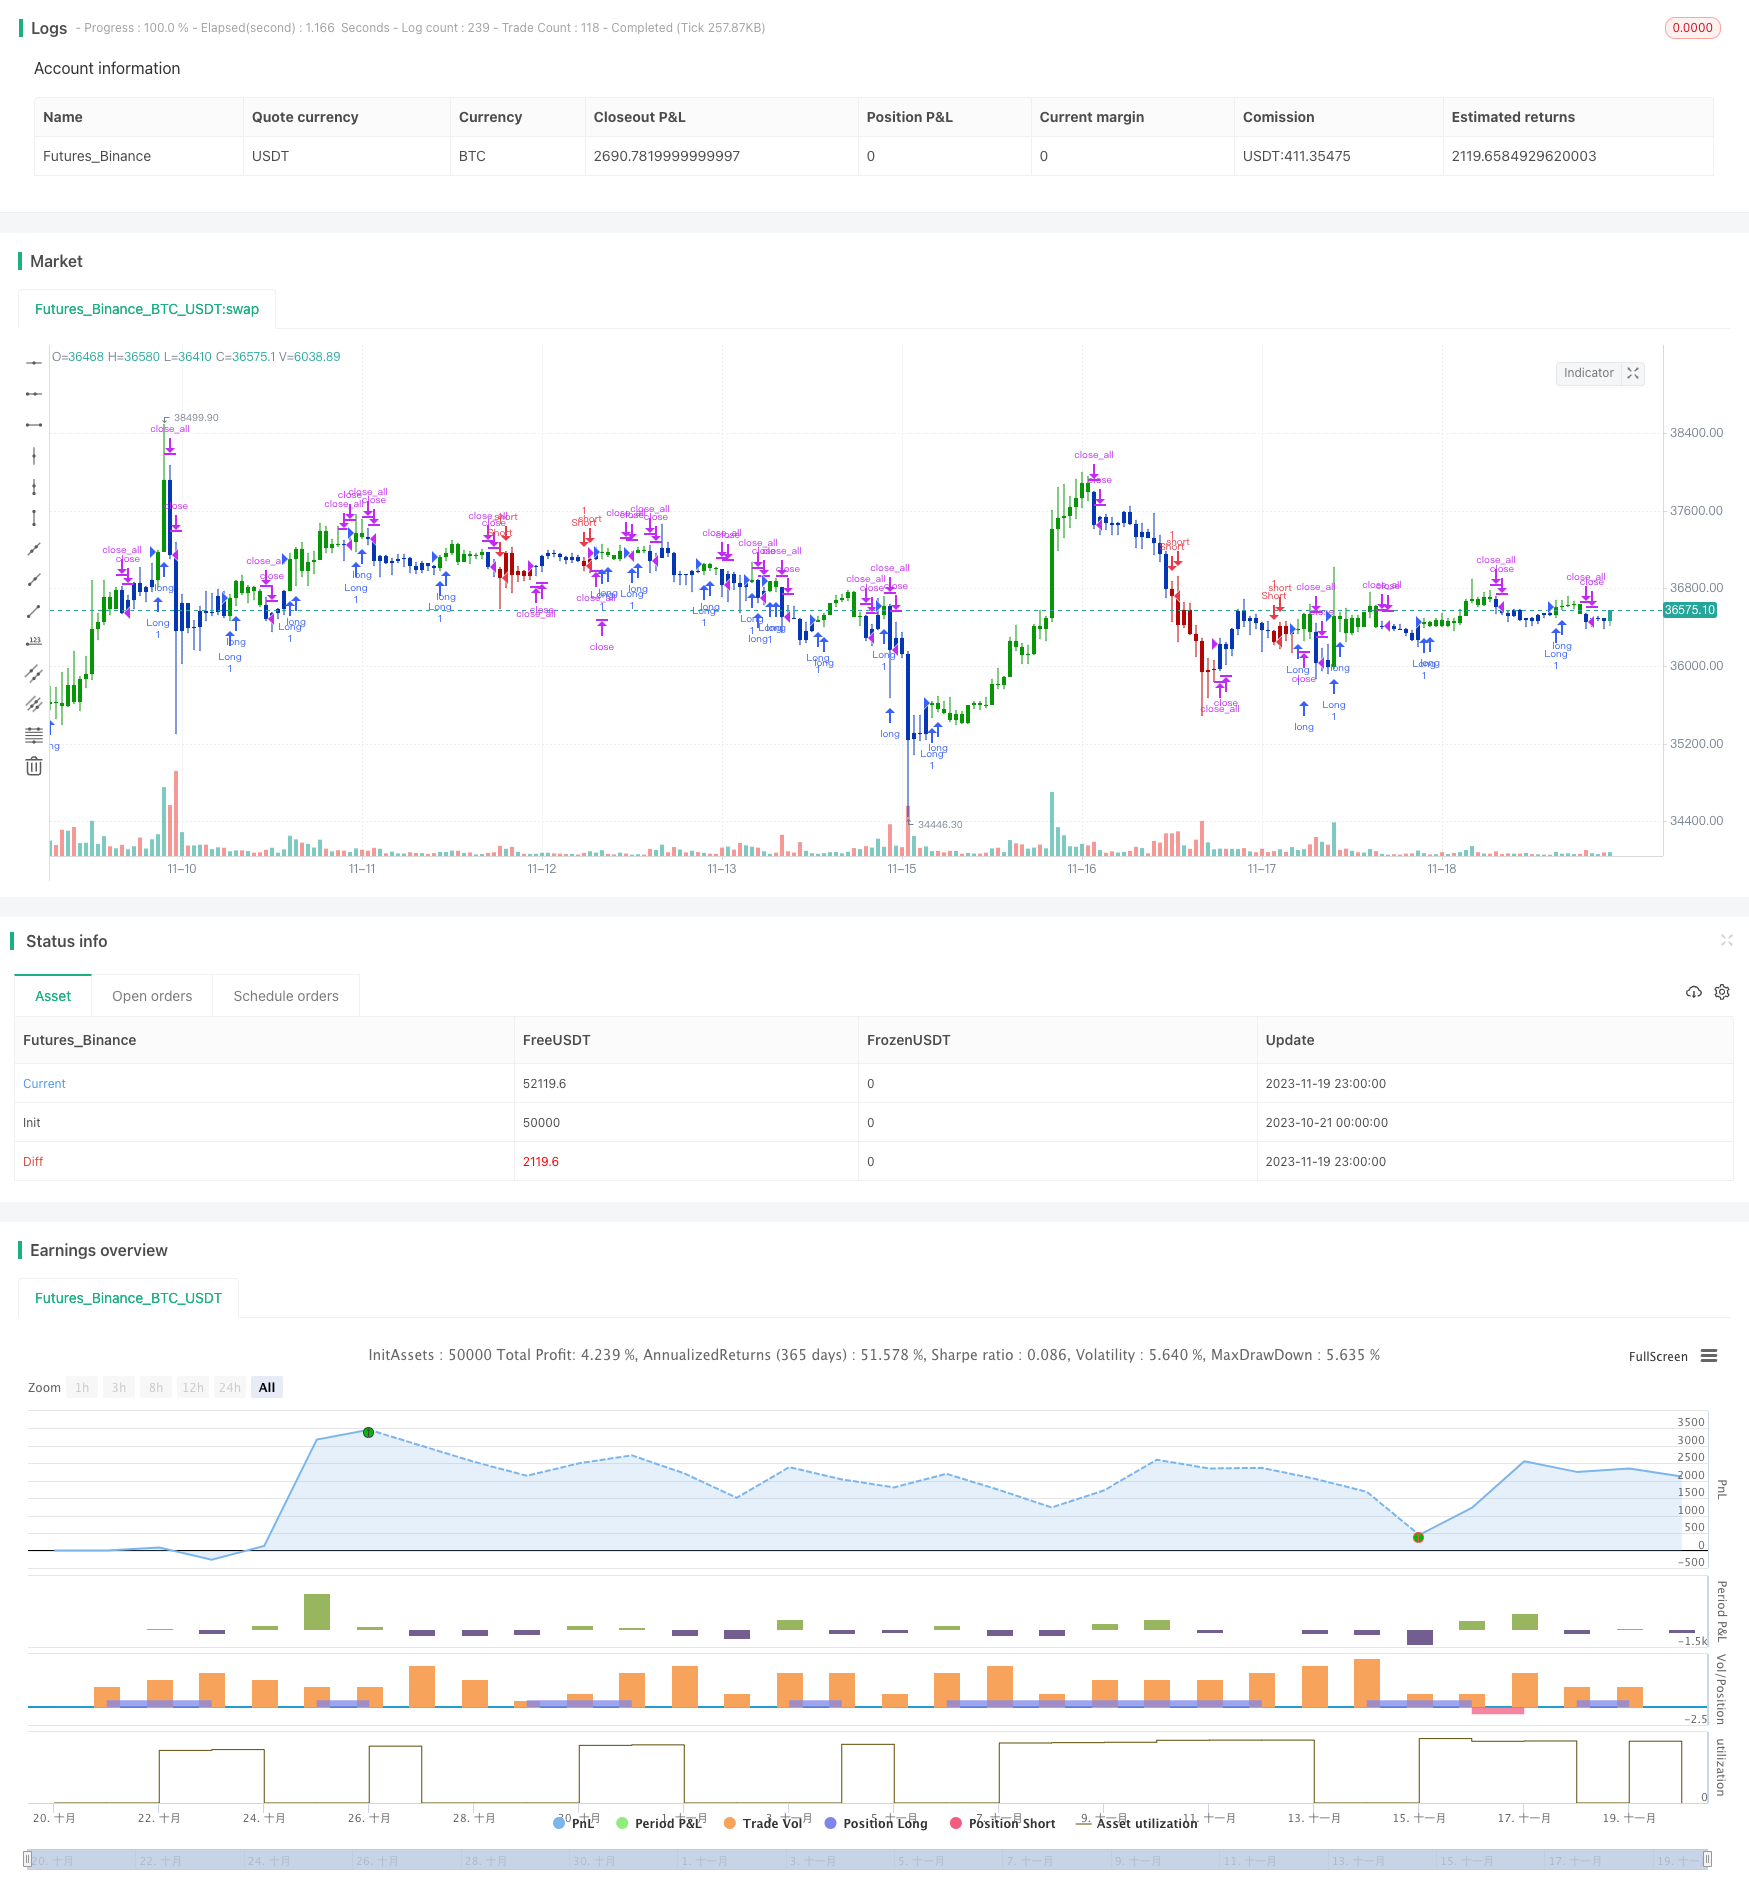
Overview
This strategy is a multi-factor combo strategy that combines reversal factors and momentum factors to discover reversal opportunities in the market. The strategy first uses the long-term reversal factor to identify reversal opportunities after range-bound declines, and then uses momentum indicators for secondary screening to filter out false reversal signals under major trends, so as to lock in short-term reversal arbitrage opportunities.
Strategy Logic
The strategy consists of two parts:
123 Reversal Factor
This part uses the idea of intraday reversal to determine the relationship between the closing price of the previous day and the closing price of the 2 days ago to identify reversal opportunities with slow K-line. The specific logic is:
Buy signal: After two consecutive days of decline in the closing price, if the closing price rises on the current day, and the 9-day slow K-line is lower than 50, a buy signal is generated;
Sell signal: After two consecutive days of rise in the closing price, if the closing price declines on the current day, and the 9-day fast K-line is higher than 50, a sell signal is generated.
Ehlers Dynamic Momentum Oscillator (ETSI)
This part uses the three EMA smoothing price momentum method to construct a momentum indicator. The formula for the indicator is as follows:
xPrice1 = close - close[1]
xPrice2 = abs(close - close[1])
xSMA_R = EMA(EMA(EMA(xPrice1,r), s), u)
xSMA_aR = EMA(EMA(EMA(xPrice2, r), s), u)
xTSI = xSMA_R / xSMA_aR * 100
xEMA_TSI = EMA(xTSI, N)
Where xSMA_R is the EMA smoothed value of price momentum, xSMA_aR is the EMA smoothed value of price volatility, xTSI is the momentum indicator constructed from the ratio of the two, and xEMA_TSI is the secondary EMA smoothing of xTSI. The indicator determines the trading signal direction based on the relationship between xTSI and xEMA_TSI.
Finally, the strategy ANDs the signals from the two parts, and only issues actual trading orders when the signals from both factors agree.
Advantages of the Strategy
The biggest advantage of this strategy lies in its multi-factor design, which can filter out false signals and discover high-quality trading opportunities. Specifically, there are three main points:
The 123 reversal factor can identify short-term rebound points after range-bound declines.
The Ehlers momentum indicator can effectively determine the direction of the major trend to avoid reversal signals occurring under a major trend, thereby filtering out false signals.
The AND operation on the two signal parts can improve signal quality and enhance strategy stability.
Risks of the Strategy
Although the strategy adopts a multi-factor design to control risks, there are still the following main risks:
Reversal signals may occur in oscillating trends and fail to profit.
There is subjectivity in the parameter settings between the two factors, which may overfit specific products.
The risk of increased losses after the price reversal reverses again.
These risks can be mitigated by optimizing parameters to adapt to more varieties, controlling post-reversal positions, real-time monitoring of changes in indicator relationships, and other means.
Optimization Directions
The main aspects for optimizing this strategy include:
Adjusting the parameters of the two factors to find data samples that match better.
Increasing stop loss strategies to control single loss.
Using different parameter combinations for trending and oscillating varieties.
Increasing the factor weighting mechanism to give better performing factors greater weight.
Increasing machine learning algorithms to achieve automatic optimization and updating of parameters.
Conclusion
The strategy successfully combines reversal factors and momentum indicators to achieve multi-factor optimized design. It can effectively identify short-term reversal opportunities and use momentum indicators to conduct secondary verification of the signals, thereby improving the win rate of the strategy. Although there is still room for improvement in the strategy, its core idea provides a good reference for the design of quantitative strategies.
Parameters
| Name | Default | What it controls |
|---|---|---|
| v_input_1 | 14 | Length |
| v_input_2 | true | KSmoothing |
| v_input_3 | 3 | DLength |
| v_input_4 | 50 | Level |
| v_input_5 | 4 | r |
| v_input_6 | 8 | s |
| v_input_7 | 6 | u |
| v_input_8 | 3 | SmthLen |
| v_input_9 | false | Trade reverse |
Source Pine Script
/*backtest
start: 2023-10-21 00:00:00
end: 2023-11-20 00:00:00
period: 1h
basePeriod: 15m
exchanges: [{"eid":"Futures_Binance","currency":"BTC_USDT"}]
*/

//@version=4
////////////////////////////////////////////////////////////
//  Copyright by HPotter v1.0 30/07/2020
// This is combo strategies for get a cumulative signal.
//
// First strategy
// This System was created from the Book "How I Tripled My Money In The
// Futures Market" by Ulf Jensen, Page 183. This is reverse type of strategies.
// The strategy buys at market, if close price is higher than the previous close
// during 2 days and the meaning of 9-days Stochastic Slow Oscillator is lower than 50.
// The strategy sells at market, if close price is lower than the previous close price
// during 2 days and the meaning of 9-days Stochastic Fast Oscillator is higher than 50.
//
// Second strategy
// r - Length of first EMA smoothing of 1 day momentum        4
// s - Length of second EMA smoothing of 1 day smoothing      8
// u- Length of third EMA smoothing of 1 day momentum         6
// Length of EMA signal line                                  3
// Source of Ergotic TSI                                      Close
//
// This is one of the techniques described by William Blau in his book "Momentum,
// Direction and Divergence" (1995). If you like to learn more, we advise you to
// read this book. His book focuses on three key aspects of trading: momentum,
// direction and divergence. Blau, who was an electrical engineer before becoming
// a trader, thoroughly examines the relationship between price and momentum in
// step-by-step examples. From this grounding, he then looks at the deficiencies
// in other oscillators and introduces some innovative techniques, including a
// fresh twist on Stochastics. On directional issues, he analyzes the intricacies
// of ADX and offers a unique approach to help define trending and non-trending periods.
//
// WARNING:
// - For purpose educate only
// - This script to change bars colors.
////////////////////////////////////////////////////////////
Reversal123(Length, KSmoothing, DLength, Level) =>
    vFast = sma(stoch(close, high, low, Length), KSmoothing)
    vSlow = sma(vFast, DLength)
    pos = 0.0
    pos := iff(close[2] < close[1] and close > close[1] and vFast < vSlow and vFast > Level, 1,
	         iff(close[2] > close[1] and close < close[1] and vFast > vSlow and vFast < Level, -1, nz(pos[1], 0)))
	pos


ETSI(r,s,u,SmthLen) =>
    pos = 0
    xPrice = close
    xPrice1 = xPrice - xPrice[1]
    xPrice2 = abs(xPrice - xPrice[1])
    xSMA_R = ema(ema(ema(xPrice1,r), s),u)
    xSMA_aR = ema(ema(ema(xPrice2, r), s),u)
    Val1 = 100 * xSMA_R
    Val2 = xSMA_aR
    xTSI = iff (Val2 != 0, Val1 / Val2, 0)
    xEMA_TSI = ema(xTSI, SmthLen)
    pos:= iff(xTSI > xEMA_TSI, 1,
    	   iff(xTSI < xEMA_TSI, -1, nz(pos[1], 0)))
    pos

strategy(title="Combo Backtest 123 Reversal & Ergodic TSI", shorttitle="Combo", overlay = true)
Length = input(14, minval=1)
KSmoothing = input(1, minval=1)
DLength = input(3, minval=1)
Level = input(50, minval=1)
//-------------------------
r = input(4, minval=1)
s = input(8, minval=1)
u = input(6, minval=1)
SmthLen = input(3, minval=1)
reverse = input(false, title="Trade reverse")
posReversal123 = Reversal123(Length, KSmoothing, DLength, Level)
posETSI = ETSI(r,s,u,SmthLen)
pos = iff(posReversal123 == 1 and posETSI == 1 , 1,
	   iff(posReversal123 == -1 and posETSI == -1, -1, 0))
possig = iff(reverse and pos == 1, -1,
          iff(reverse and pos == -1 , 1, pos))
if (possig == 1)
    strategy.entry("Long", strategy.long)
if (possig == -1)
    strategy.entry("Short", strategy.short)
if (possig == 0)
    strategy.close_all()
barcolor(possig == -1 ? #b50404: possig == 1 ? #079605 : #0536b3 )Published by ChaoZhang on the FMZ strategy square · last modified 2023-11-21. Collected in the Quant Trading Vault. Unvalidated research: re-test with your own data and costs before trusting it.
Build this with AgenKit
A spec is not a trading system. Paste this into your coding agent and AgenKit runs a specialist team — architecture, test-first build, risk gates, review — with paper trading on by default.
/agenkit build a production-grade trading bot with a backtest engine, risk controls and paper trading by default from strategies/Multi-factor-Momentum-Reversal-Combo-Strategy.md- npx agenkit install engineering-kit in your project
- Paste the command into your agent and approve each phase
- Get tests, backtest, risk controls and a paper-trading switch
Understand it first
Before you run this, read the lesson behind the idea and how to backtest it honestly. Specs like this one are the survivors of an unknown number of trials; deflate their results accordingly.
Related specs
- Dual Indicator Slight Reversal Trading StrategyPine Script · Mean reversion · 15m
- Combo Trading Strategy Based on 123 Reversal and MACDPine Script · Mean reversion · 30m
- Intraday Single Candle Indicator Combo Short Term Trading StrategyPine Script · Mean reversion · 1d
- TMA LegacyPine Script · Mean reversion · 2h
- Hedging Oscillation Reversal StrategyPine Script · Mean reversion · 5m
- 15 MIN BTCUSDTPERP BOTPine Script · Mean reversion · 45m