Strategy vault / Machine learning
Multi factor Quantitative Trading Strategy 430013
This is a quantitative trading strategy that combines multiple technical indicators for long/short decisions. It takes into account momentum indicators, trend indicators, Ichimoku cloud and other factors to form the…
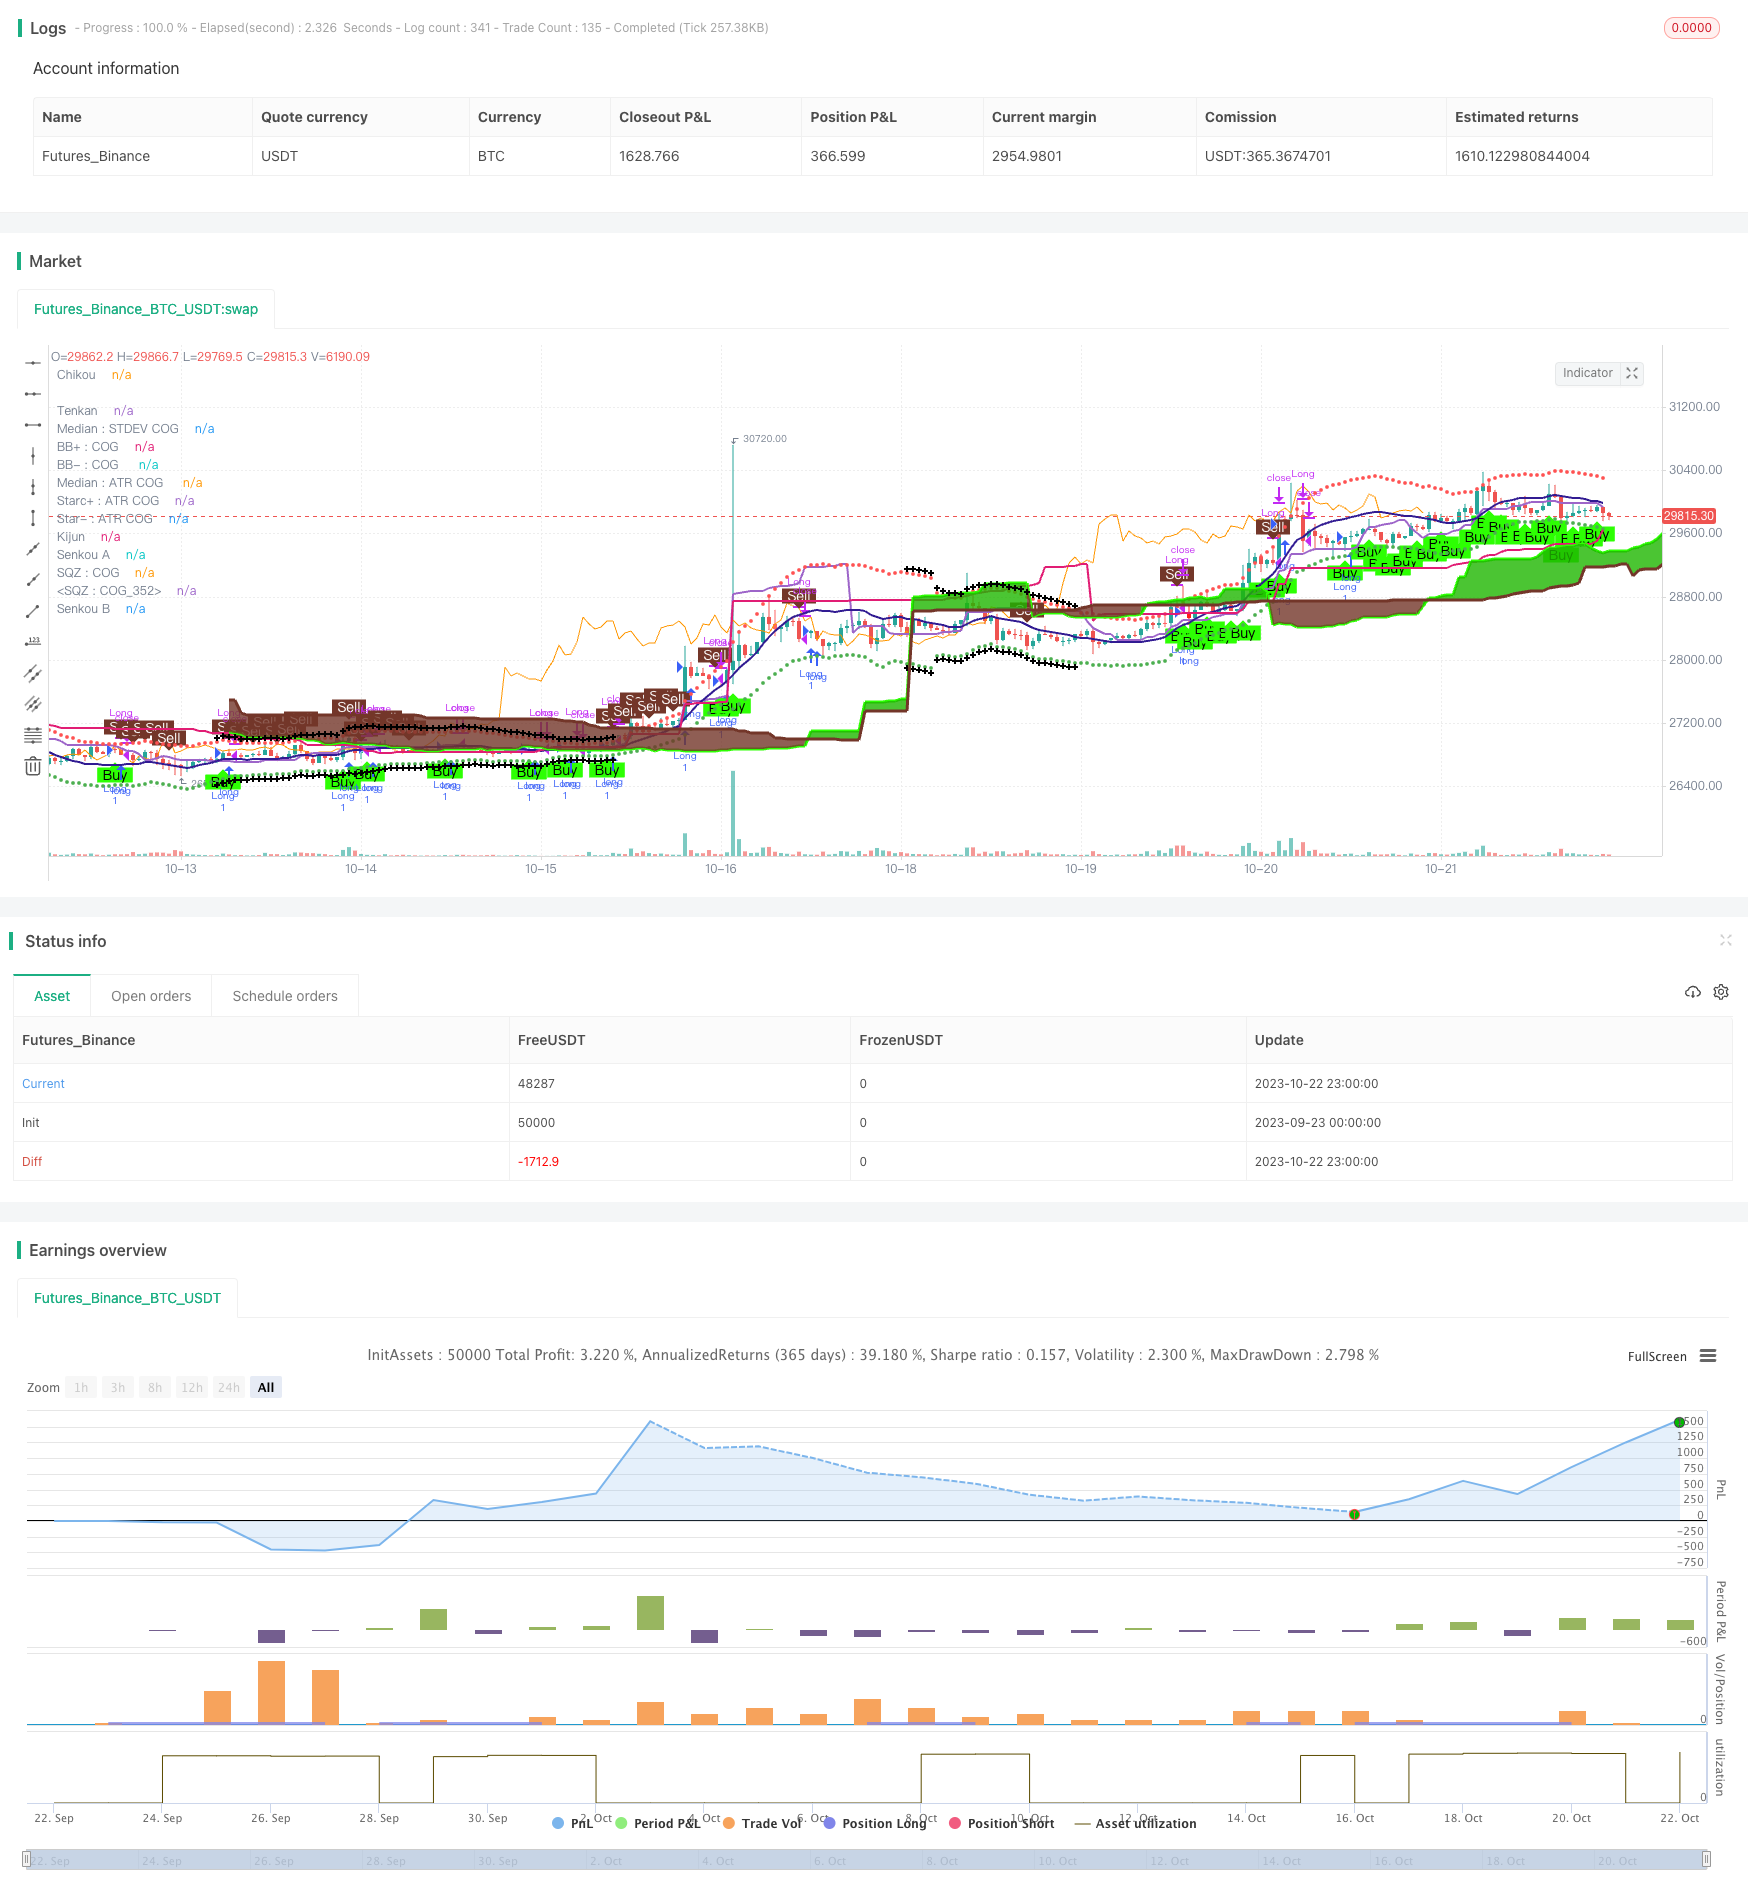
This is a quantitative trading strategy that combines multiple technical indicators for long/short decisions. It takes into account momentum indicators, trend indicators, Ichimoku cloud and other factors to form the final buy/sell judgements. The strategy has strong stability and risk resistance.
Principle Analysis
The strategy consists of following main components:
Momentum indicators: Parabolic SAR, Leledc, Kaufman Adaptive Moving Average etc.
Trend indicators: RahulMohindar Oscillator, Trend Magic etc.
Ichimoku Cloud: Tenkan-sen, Kijun-sen etc.
Volume indicators: Volume Flow Indicator
Volatility indicators: Wave Trend Oscillator
TD Sequential
These indicators judge the market trend and momentum from different perspectives. Parabolic SAR detects trend reversal points, Leledc measures momentum, Ichimoku Cloud identifies support/resistance levels. Buy/sell signals are generated when most indicators agree on the direction.
The strategy also sets filter conditions to avoid inefficient trades outside specified date ranges per month/day.
Advantage Analysis
Multiple factors improve accuracy and risk resistance
Cross validation with different indicator types avoids failure risk
Filter conditions avoid inefficient trades in unsuitable periods
Pine Script implementation allows easy use on TradingView
Customizable parameters can be optimized for different markets
Visual signals provide intuitive market structure judgements
Risk Analysis
Multi-factor combination requires parameter tuning and weight optimization
Individual indicators may fail in certain market conditions
Improper filter settings may miss opportunities
Over-optimization needs to be avoided
Traders should watch out for indicator failure risks and adjust strategy accordingly
Countermeasures:
Optimize parameters for indicator effectiveness in current market
Adjust weights to amplify effective and reduce ineffective indicators
Fine-tune filters to balance opportunity and risk
Optimization Directions
Add machine learning algorithms to auto-adjust indicator weights
Incorporate more factors like sentiment, money flow etc.
Test optimial parameters across products and timeframes
Evaluate different holding period performances
Combine more filters like seasonality, economic data etc.
Add stop loss strategies
Conclusion
The strategy combines multiple indicators for stronger risk resistance. But indicator failure risks need to be monitored, parameters continuously optimized. Future enhancements may include optimizing indicator weights, adding more factors, testing optimal holding periods etc.
Parameters
| Name | Default | What it controls |
|---|---|---|
| v_input_1 | false | Do you want to display Parabolic SAR? |
| v_input_2 | false | Do you want to display Parabolic SAR on the chart? |
| v_input_3 | false | Do you want to display the Tenkan and Kijun lines of Ichimoku lines on the chart? |
| v_input_4 | false | Do you want to display Leledec Exhausion - Leledc on the chart? |
| v_input_5 | false | Do you want to display Rahul Mohindar Oscillator - RMO on the chart? |
| v_input_6 | false | Do you want to display Kaufman AMA wave - AMA on the chart? |
| v_input_7 | false | Do you want to display Trend Magic signals on the chart? |
| v_input_8 | false | Do you want to display WaveTrend Oscillator - WTO on the chart? |
| v_input_9 | false | Do you want to display Volume Flow Indicator - VFI on the chart? |
| v_input_10 | false | Do you want to not display the minor or the not so strong signals from Ichimoku |
| v_input_11 | false | Show Minor Leledc Exhausion Bar signal |
| v_input_12 | 20 | Tenkan Period - Ichimoku [9 or 10 or 20] |
| v_input_13 | 60 | Kijun Period - Ichimoku [26 or 30 or 60] |
| v_input_14 | 120 | Chikou - Ichimoku [52 or 60 or 120] |
| v_input_15 | 30 | Displacement - Ichimoku [26 or 30] |
| v_input_16 | true | monthfrom |
| v_input_17 | 12 | monthuntil |
| v_input_18 | true | dayfrom |
| v_input_19 | 31 | dayuntil |
| v_input_20 | 2017 | yearfrom |
| v_input_21 | 2020 | yearuntil |
| v_input_22 | true | leverage |
Source Pine Script
//@version=2
persistent_bull = nz(persistent_bull[1],0)
persistent_bear  = nz(persistent_bear[1],0)

strategy("Strategy for The Bitcoin Buy/Sell Indicator", overlay=true, calc_on_every_tick=true)

// ****************************************Inputs***************************************************************
//@fixme if there is a buy and sell signal on the same bar, then it displays the first one and skips the second one. Fix this issue
buySellSignal = true // Make this false if you do not want to show Buy/Sell signal
inputIndividualSiganlPlot = true // = input (false, "Do you want to display each individual indicator's signal on the chart?")
sp = input (false, "Do you want to display Parabolic SAR?")
spLines = input (false, "Do you want to display Parabolic SAR on the chart?")
sCloud = input(false, "Do you want to display the Tenkan and Kijun lines of Ichimoku lines on the chart?")
sL = input (false, "Do you want to display Leledec Exhausion - Leledc on the chart?")
sTD = false
sRMO = input(false, "Do you want to display Rahul Mohindar Oscillator - RMO on the chart?")
inputAma = input(false, title="Do you want to display Kaufman AMA wave - AMA on the chart?")
tm = input (false, "Do you want to display Trend Magic signals on the chart?")
wtoLB = input (false, "Do you want to display WaveTrend Oscillator - WTO on the chart?")
vfiLB = input (false, "Do you want to display Volume Flow Indicator - VFI on the chart?")
cogRegionFillTransp = 100 // input(false, "Do you want to display COG Region Fill and ATR Starc+/-")
inputNeutralMinorSignals = input (false, title="Do you want to not display the minor or the not so strong signals from Ichimoku")
maj=true // input(true,title="Show Major Leledc Exhausion Bar signal")
min=input(false,title="Show Minor Leledc Exhausion Bar signal")

tenkanPeriods = input(20, minval=9, title="Tenkan Period - Ichimoku [9 or 10 or 20]")
kijunPeriods = input(60, minval=26, title="Kijun Period - Ichimoku [26 or 30 or 60]")
chikouPeriods = input(120, minval=52, title="Chikou - Ichimoku [52 or 60 or 120]")
displacement = input(30, minval=26, title="Displacement - Ichimoku [26 or 30]")

// ****************************************General Color Variables***************************************************************
colorLime = #006400 // Warning sign for long trade
colorBuy= #2DFF03 // Good sign for long trade
colorSell = #733629 // Good sign for short trade
colorMaroon =#8b0000 // Warning sign for short trade
colorBlue =#0000ff // No clear sign
colorGray = #a9a9a9 // Gray Color (For Squeeze momentum indicator)
colorBlack = #000000 // Black
colorWhite = #ffffff // White
colorTenkanViolet = #800000 // Tenkan-sen line color
colorKijun = #0000A6 // Kijun-sen line color

// TD Sequential bar colors
tdSell = #ff6666
tdSellOvershoot = #ff1a1a
tdSellOvershoot1 = #cc0000
tdSellOverShoot2 = #990000
tdSellOverShoot3 = #732626

tdBuy = #80ff80
tdBuyOverShoot = #33ff33
tdBuyOvershoot1 = #00cc00
tdBuyOverShoot2 = #008000
tdBuyOvershoot3 = #004d00

// ****************************************Icons***************************************************************
upSign = '↑' // indicates the indicator shows uptrend
downSign = '↓' // incicates the indicator showing downtrend
exitSign ='x' //indicates the indicator uptrend/downtrend ending
// diamond signals weakBullishSignal or weakBearishsignal
// flag signals neutralBullishSignal or neutralBearishSignal

// ****************************************Parabolic SAR code***************************************************************
start = 2
increment = 2
maximum = 2
sus = true
sds = true
disc = false

startCalc = start * .01
incrementCalc = increment * .01
maximumCalc = maximum * .10

sarUp = sar(startCalc, incrementCalc, maximumCalc)
sarDown = sar(startCalc, incrementCalc, maximumCalc)

colUp = spLines and close >= sarDown ? colorLime : na
colDown = spLines and close <= sarUp ? colorSell : na

//@fixme Does not display the correct values for up and down pSAR
plot(sp and sus and sarUp ? sarUp : na, title="↓ SAR", style=cross, linewidth=3,color=colUp)
plot(sp and sds and sarDown ? sarDown : na, title="↑ SAR", style=circles, linewidth=3,color=colDown)

startSAR = 0.02
incrementSAR = 0.02
maximumSAR = 0.2

psar = sar(startSAR, incrementSAR, maximumSAR)
bullishPSAR = psar < high and psar[1] > low
bearishPSAR= psar > low and psar[1] < high

//***********************Leledc Exhausion Bar***********************************************
maj_qual=6
maj_len=30
min_qual=5
min_len=5

lele(qual,len)=>
    bindex=nz(bindex[1],0)
    sindex=nz(sindex[1],0)
    ret=0
    if (close>close[4])
        bindex:=bindex + 1
    if(close<close[4])
        sindex:=sindex + 1
    if (bindex>qual) and (close<open) and high>=highest(high,len)
        bindex:=0
        ret:=-1
    if ((sindex>qual) and (close>open) and (low<= lowest(low,len)))
        sindex:=0
        ret:=1
    return=ret

major=lele(maj_qual,maj_len)
minor=lele(min_qual,min_len)

leledecMajorBullish = maj ? (major==1?low:na) : na
leledecMajorBearish = maj ? (major==-1?high:na) : na

//****************Ichimoku ************************************
donchian(len) => avg(lowest(len), highest(len))

tenkan = donchian(tenkanPeriods)
kijun = donchian(kijunPeriods)
senkouA = avg(tenkan, kijun)
senkouB = donchian(chikouPeriods)
displacedSenkouA = senkouA[displacement]
displacedSenkouB = senkouB[displacement]

bullishSignal = crossover(tenkan, kijun)
bearishSignal = crossunder(tenkan, kijun)

bullishSignalValues = iff(bullishSignal, tenkan, na)
bearishSignalValues = iff(bearishSignal, tenkan, na)

strongBullishSignal = crossover(tenkan, kijun) and bullishSignalValues > displacedSenkouA and bullishSignalValues > displacedSenkouB and low > tenkan and displacedSenkouA > displacedSenkouB
strongBearishSignal = bearishSignalValues < displacedSenkouA and bearishSignalValues < displacedSenkouB and high < tenkan and displacedSenkouA <  displacedSenkouB

neutralBullishSignal = (bullishSignalValues > displacedSenkouA and bullishSignalValues < displacedSenkouB) or (bullishSignalValues < displacedSenkouA and bullishSignalValues > displacedSenkouB)
weakBullishSignal = bullishSignalValues < displacedSenkouA and bullishSignalValues < displacedSenkouB
neutralBearishSignal = (bearishSignalValues > displacedSenkouA and bearishSignalValues < displacedSenkouB) or (bearishSignalValues < displacedSenkouA and bearishSignalValues > displacedSenkouB)
weakBearishSignal = bearishSignalValues > displacedSenkouA and bearishSignalValues > displacedSenkouB

//*********************Kaufman AMA wave*********************//
src=close
lengthAMA=20
filterp = 10

d=abs(src-src[1])
s=abs(src-src[lengthAMA])
noise=sum(d, lengthAMA)
efratio=s/noise
fastsc=0.6022
slowsc=0.0645

smooth=pow(efratio*fastsc+slowsc, 2)
ama=nz(ama[1], close)+smooth*(src-nz(ama[1], close))
filter=filterp/100 * stdev(ama-nz(ama), lengthAMA)
amalow=ama < nz(ama[1]) ? ama : nz(amalow[1])
amahigh=ama > nz(ama[1]) ? ama : nz(amahigh[1])
bw=(ama-amalow) > filter ? 1 : (amahigh-ama > filter ? -1 : 0)
s_color=bw > 0 ? colorBuy : (bw < 0) ? colorSell : colorBlue

amaLongConditionEntry = s_color==colorBuy and s_color[1]!=colorBuy
amaShortConditionEntry = s_color==colorSell and s_color[1]!=colorSell

//***********************Rahul Mohindar Oscillator ******************************//
C=close
cm2(x) => sma(x,2)
ma1=cm2(C)
ma2=cm2(ma1)
ma3=cm2(ma2)
ma4=cm2(ma3)
ma5=cm2(ma4)
ma6=cm2(ma5)
ma7=cm2(ma6)
ma8=cm2(ma7)
ma9=cm2(ma8)
ma10=cm2(ma9)
SwingTrd1 = 100 * (close - (ma1+ma2+ma3+ma4+ma5+ma6+ma7+ma8+ma9+ma10)/10)/(highest(C,10)-lowest(C,10))
SwingTrd2=ema(SwingTrd1,30)
SwingTrd3=ema(SwingTrd2,30)
RMO= ema(SwingTrd1,81)
Buy=cross(SwingTrd2,SwingTrd3)
Sell=cross(SwingTrd3,SwingTrd2)
Bull_Trend=ema(SwingTrd1,81)>0
Bear_Trend=ema(SwingTrd1,81)<0
Ribbon_kol=Bull_Trend ? colorBuy : (Bear_Trend ? colorSell : colorBlue)
Impulse_UP= SwingTrd2 > 0
Impulse_Down= RMO < 0
bar_kol=Impulse_UP ? colorBuy : (Impulse_Down ? colorSell : (Bull_Trend ?  colorBuy : colorBlue))

rahulMohindarOscilllatorLongEntry = Ribbon_kol==colorBuy and Ribbon_kol[1]!=colorBuy and Ribbon_kol[1]==colorSell and bar_kol==colorBuy
rahulMohindarOscilllatorShortEntry = Ribbon_kol==colorSell and Ribbon_kol[1]!=colorSell and Ribbon_kol[1]==colorBuy and bar_kol==colorSell

//***********************TD Sequential code ******************************//
transp=0
Numbers=false
SR=false
Barcolor=true

TD = close > close[4] ?nz(TD[1])+1:0
TS = close < close[4] ?nz(TS[1])+1:0

TDUp = TD - valuewhen(TD < TD[1], TD , 1 )
TDDn = TS - valuewhen(TS < TS[1], TS , 1 )

priceflip = barssince(close<close[4])
sellsetup = close>close[4] and priceflip
sell = sellsetup and barssince(priceflip!=9)
sellovershoot = sellsetup and barssince(priceflip!=13)
sellovershoot1 = sellsetup and barssince(priceflip!=14)
sellovershoot2 = sellsetup and barssince(priceflip!=15)
sellovershoot3 = sellsetup and barssince(priceflip!=16)

priceflip1 = barssince(close>close[4])
buysetup = close<close[4] and priceflip1
buy = buysetup and barssince(priceflip1!=9)
buyovershoot = barssince(priceflip1!=13) and buysetup
buyovershoot1 = barssince(priceflip1!=14) and buysetup
buyovershoot2 = barssince(priceflip1!=15) and buysetup
buyovershoot3 = barssince(priceflip1!=16) and buysetup

TDbuyh = valuewhen(buy,high,0)
TDbuyl = valuewhen(buy,low,0)
TDsellh = valuewhen(sell,high,0)
TDselll = valuewhen(sell,low,0)
//***********************Volume Flow Indicator [LazyBear] ******************************//
lengthVFI = 130
coefVFI = 0.2
vcoefVFI = 2.5
signalLength= 5
smoothVFI=true

ma(x,y) => smoothVFI ? sma(x,y) : x

typical=hlc3
inter = log( typical ) - log( typical[1] )
vinter = stdev(inter, 30 )
cutoff = coefVFI * vinter * close
vave = sma( volume, lengthVFI )[1]
vmax = vave * vcoefVFI
vc = iff(volume < vmax, volume, vmax)
mf = typical - typical[1]
vcp = iff( mf > cutoff, vc, iff ( mf < -cutoff, -vc, 0 ) )

vfi = ma(sum( vcp , lengthVFI )/vave, 3)
vfima=ema( vfi, signalLength )
dVFI=vfi-vfima

bullishVFI = vfi > 0 and vfi[1] <=0
bearishVFI =  vfi < 0 and vfi[1] >=0

//***********************WaveTrend Oscillator [WT] ******************************//
n1 = 10
n2 = 21
obLevel1 = 60
obLevel2 = 53
osLevel1 = -60
osLevel2 = -53

ap = hlc3
esa = ema(ap, n1)
dWTI = ema(abs(ap - esa), n1)
ci = (ap - esa) / (0.015 * dWTI)
tci = ema(ci, n2)

wt1 = tci
wt2 = sma(wt1,4)

wtiSignal = wt1-wt2

bullishWTI = wt1 > osLevel1 and wt1[1] <= osLevel1 and wtiSignal > 0
bearishWTI = wt1 < obLevel1 and wt1[1] >= obLevel1 and wtiSignal < 0

// **************** Trend Magic code adapted from  Glaz ********************* /
CCI = 20 // input(20)
ATR = 5 // input(5)
Multiplier=1 // input(1,title='ATR Multiplier')
original=true // input(true,title='original coloring')
thisCCI = cci(close, CCI)
lastCCI = nz(thisCCI[1])
bufferDn= high + Multiplier * sma(tr,ATR)
bufferUp= low - Multiplier * sma(tr,ATR)
if (thisCCI >= 0 and lastCCI < 0)
    bufferUp := bufferDn[1]
if (thisCCI <= 0 and lastCCI > 0)
    bufferDn := bufferUp[1]

if (thisCCI >= 0)
    if (bufferUp < bufferUp[1])
        bufferUp := bufferUp[1]
else
    if (thisCCI <= 0)
        if (bufferDn > bufferDn[1])
            bufferDn := bufferDn[1]

x=thisCCI >= 0 ?bufferUp:thisCCI <= 0 ?bufferDn:x[1]
swap=x>x[1]?1:x<x[1]?-1:swap[1]
swap2=swap==1?lime:red
swap3=thisCCI >=0 ?lime:red
swap4=original?swap3:swap2

bullTrendMagic = swap4 == lime and swap4[1] == red
bearTrendMagic = swap4 == red and swap4[1] == lime

// ************ Indicator: Custom COG channel by Lazy Bear **************** //
srcCOG = close
lengthCOG = 34
median=0
multCOG= 2.5 // input(2.5)
offset = 20 //input(20)

tr_custom() =>
    x1=high-low
    x2=abs(high-close[1])
    x3=abs(low-close[1])
    max(x1, max(x2,x3))

atr_custom(x,y) =>
    sma(x,y)

dev = (multCOG * stdev(srcCOG, lengthCOG))
basis=linreg(srcCOG, lengthCOG, median)
ul = (basis + dev)
ll = (basis - dev)
tr_v = tr_custom()
acustom=(2*atr_custom(tr_v, lengthCOG))
uls=basis+acustom
lls=basis-acustom

// Plot STDEV channel
plot(basis, linewidth=1, color=navy, style=line, linewidth=1, title="Median : STDEV COG")
lb=plot(ul, color=red, linewidth=1, title="BB+ : COG", style=hline.style_dashed)
tb=plot(ll, color=green, linewidth=1, title="BB- : COG ", style=hline.style_dashed)
fill(tb,lb, silver, title="Region fill: STDEV COG",  transp=cogRegionFillTransp)

// Plot ATR channel
plot(basis, linewidth=2, color=navy, style=line, linewidth=2, title="Median : ATR COG ")
ls=plot(uls, color=red, linewidth=1, title="Starc+ : ATR COG", style=circles, transp=cogRegionFillTransp)
ts=plot(lls, color=green, linewidth=1, title="Star- : ATR COG", style=circles, transp=cogRegionFillTransp)
fill(ts,tb, green, title="Region fill : ATR COG", transp=cogRegionFillTransp)
fill(ls,lb, red, title="Region fill : ATR COG", transp=cogRegionFillTransp)

// Mark SQZ
plot_offs_high=0.002
plot_offs_low=0.002
sqz_f=(uls>ul) and (lls<ll)
b_color=sqz_f ? colorBlack : na
plot(sqz_f ? lls - (lls * plot_offs_low) : na, color=b_color, style=cross, linewidth=3, title="SQZ : COG", trasp=0)
plot(sqz_f ? uls + (uls * plot_offs_high) : na, color=b_color, style=cross, linewidth=3, title="SQZ : COG", trasp=0)

// ****************************************All the plots and coloring of bars***************************************************************
// Trend Magic
plotchar(tm and bullTrendMagic, title="TM", char=upSign, location=location.belowbar, color=colorBuy, transp=0, text="TM", textcolor=colorBuy, size=size.auto)
plotchar(tm and bearTrendMagic, title="TM", char=downSign, location=location.abovebar, color=colorSell, transp=0, text="TM", textcolor=colorSell, size=size.auto)

// WaveTrend Oscillator
plotshape(wtoLB and bullishWTI, color=colorBuy, style=shape.labelup, textcolor=#000000, text="WTI", location=location.belowbar, transp=0)
plotshape(wtoLB and bearishWTI, color=colorSell, style=shape.labeldown, textcolor=#ffffff,  text="WTI", location=location.abovebar, transp=0)

// VFI
plotshape(vfiLB and bullishVFI, color=colorBuy, style=shape.labelup, textcolor=#000000, text="VFI", location=location.belowbar, transp=0)
plotshape(vfiLB and bearishVFI, color=colorSell, style=shape.labeldown, textcolor=#ffffff,  text="VFI", location=location.abovebar, transp=0)

// PSAR
plotshape(inputIndividualSiganlPlot and sp and bullishPSAR, color=colorBuy, style=shape.labelup, textcolor=#000000, text="Sar", location=location.belowbar, transp=0)
plotshape(inputIndividualSiganlPlot and sp and bearishPSAR, color=colorSell, style=shape.labeldown, textcolor=#ffffff,  text="Sar", location=location.abovebar, transp=0)

// Leledec
plotshape(inputIndividualSiganlPlot and sL and leledecMajorBearish, color=colorSell, style=shape.labeldown, textcolor=#ffffff,  text="Leledec", location=location.abovebar, transp=0)
plotshape(inputIndividualSiganlPlot and sL and leledecMajorBullish, color=colorBuy, style=shape.labelup, textcolor=#000000, text="Leledec", location=location.belowbar, transp=0)

plotshape(min ? (minor==1?low:na) : na, style=shape.diamond, text="Leledec", size=size.tiny, location=location.belowbar, title="Weak Bullish Signals - Leledec", color=colorLime)
plotshape(min ? (minor==-1?high:na) : na, style=shape.diamond, text="Leledec", size=size.tiny, location=location.abovebar, title="Weak Bearish Signals - Leleded", color=colorSell)

// Ichimoku
plot(tenkan, color=iff(sCloud, colorTenkanViolet, na), title="Tenkan", linewidth=2, transp=0)
plot(kijun, color=iff(sCloud, colorKijun, na), title="Kijun", linewidth=2, transp=0)

plot(close, offset = -displacement, color=iff(sCloud, colorLime, na), title="Chikou", linewidth=1)
p1 = plot(senkouA, offset=displacement, color=colorBuy, title="Senkou A", linewidth=3, transp=0)
p2 = plot(senkouB, offset=displacement, color=colorSell, title="Senkou B", linewidth=3, transp=0)
fill(p1, p2, color = senkouA > senkouB ? #1eb600 : colorSell)

plotshape(inputIndividualSiganlPlot and strongBearishSignal, color=colorSell, style=shape.labelup, textcolor=#000000,  text="Ichimoku", location=location.abovebar, transp=0)
plotshape(inputIndividualSiganlPlot and strongBullishSignal, color=colorBuy, style=shape.labeldown, textcolor=#ffffff,  text="Ichimoku", location=location.belowbar, transp=0)

plotshape(inputNeutralMinorSignals and neutralBullishSignal, style=shape.flag, text="Ichimoku", size=size.small, location=location.belowbar, title="Neutral Bullish Signals - Ichimoku", color=colorLime)
plotshape(inputNeutralMinorSignals and weakBullishSignal, style=shape.diamond, text="Ichimoku", size=size.tiny, location=location.belowbar, title="Weak Bullish Signals - Ichimoku", color=colorLime)

plotshape(inputNeutralMinorSignals and neutralBearishSignal, style=shape.flag, text="Ichimoku", size=size.small, location=location.abovebar, title="Neutral Bearish Signals - Ichimoku", color=colorMaroon)
plotshape(inputNeutralMinorSignals and weakBearishSignal, style=shape.diamond, text="Ichimoku", size=size.tiny, location=location.abovebar, title="Weak Bearish Signals - Ichimoku", color=colorMaroon)

// AMA
plotshape(inputIndividualSiganlPlot and inputAma and amaLongConditionEntry, color=colorBuy, style=shape.labelup, textcolor=#000000, text="AMA", location=location.belowbar, transp=0)
plotshape(inputIndividualSiganlPlot and inputAma and amaShortConditionEntry, color=colorSell, style=shape.labeldown, textcolor=#ffffff,  text="AMA", location=location.abovebar, transp=0)

// RMO
plotshape(inputIndividualSiganlPlot and sRMO and rahulMohindarOscilllatorLongEntry, color=colorBuy, style=shape.labelup, textcolor=#000000, text="RMO", location=location.belowbar, transp=0)
plotshape(inputIndividualSiganlPlot and sRMO and rahulMohindarOscilllatorShortEntry, color=colorSell, style=shape.labeldown, textcolor=#ffffff,  text="RMO", location=location.abovebar, transp=0)

// TD
plot(sTD and SR?(TDbuyh ? TDbuyl: na):na,style=circles, linewidth=1, color=red)
plot(sTD and SR?(TDselll ? TDsellh : na):na,style=circles, linewidth=1, color=lime)

barColour = sell? tdSell : buy? tdBuy : sellovershoot? tdSellOvershoot : sellovershoot1? tdSellOvershoot1 : sellovershoot2?tdSellOverShoot2 : sellovershoot3? tdSellOverShoot3 : buyovershoot? tdBuyOverShoot : buyovershoot1? tdBuyOvershoot1 : buyovershoot2? tdBuyOverShoot2 : buyovershoot3? tdBuyOvershoot3 : na
barcolor(color=barColour, title ="TD Sequential Bar Colour")

// ****************************************BUY/SELL Signal ***************************************************************
bull = leledecMajorBullish or bullishPSAR or strongBullishSignal or amaLongConditionEntry or rahulMohindarOscilllatorLongEntry or bullishVFI
bear = leledecMajorBearish or bearishPSAR or strongBearishSignal or amaShortConditionEntry or rahulMohindarOscilllatorShortEntry or bearishVFI

if bull
    persistent_bull := 1
    persistent_bear := 0

if bear
    persistent_bull := 0
    persistent_bear := 1

plotshape(bull and persistent_bull[1] != 1, style=shape.labelup, location=location.belowbar, color=colorBuy, text="Buy", textcolor=#000000, transp=0)
plotshape(bear and persistent_bear[1] != 1, style=shape.labeldown, color=colorSell, text="Sell", location=location.abovebar, textcolor =#ffffff, transp=0)

// ****************************************Alerts***************************************************************
// For global buy/sell
alertcondition(bull and persistent_bull[1] != 1, title='Buy', message='Buy')
alertcondition(bear and persistent_bear[1] != 1, title='Sell', message='Sell')

// Strategy
longCondition = leledecMajorBullish or bullishPSAR or strongBullishSignal or amaLongConditionEntry or rahulMohindarOscilllatorLongEntry or bullishVFI
closeLongCondition = leledecMajorBearish or bearishPSAR or strongBearishSignal or amaShortConditionEntry or rahulMohindarOscilllatorShortEntry or bearishVFI


monthfrom =input(1)
monthuntil =input(12)
dayfrom=input(1)
dayuntil=input(31)
yearfrom=input(2017)
yearuntil=input(2020)
leverage=input(1)

if (longCondition )
    strategy.entry("Long", strategy.long, leverage, comment="Enter Long")
else
    strategy.close("Long", when=closeLongCondition)


//if (closeLongCondition and month>=monthfrom and month <=monthuntil and dayofmonth>=dayfrom and dayofmonth <= dayuntil and year <= yearuntil and year>=yearfrom)
//    strategy.entry("Short", strategy.short, leverage, comment="Enter Short")
//else
//    strategy.close("Short", when=longCondition)
Published by ChaoZhang on the FMZ strategy square · last modified 2023-10-24. Collected in the Quant Trading Vault. Unvalidated research: re-test with your own data and costs before trusting it.
Build this with AgenKit
A spec is not a trading system. Paste this into your coding agent and AgenKit runs a specialist team — architecture, test-first build, risk gates, review — with paper trading on by default.
/agenkit build a production-grade trading bot with a backtest engine, risk controls and paper trading by default from strategies/Multi-factor-Quantitative-Trading-Strategy-430013.md- npx agenkit install engineering-kit in your project
- Paste the command into your agent and approve each phase
- Get tests, backtest, risk controls and a paper-trading switch
Understand it first
Before you run this, read the lesson behind the idea and how to backtest it honestly. Specs like this one are the survivors of an unknown number of trials; deflate their results accordingly.
Related specs
- Triple Moving Average Combined with MACD Quantitative StrategyPine Script · Machine learning · 1d
- High Low Cryptocurrency Strategy Based on Multiple IndicatorsPine Script · Machine learning · 45m
- Multi indicator Combination StrategyPine Script · Machine learning · 1d
- kNN based Trend Following StrategyPine Script · Machine learning · 1h
- Multi Indicator Decision Tree Strategy IMACD EMA and IchimokuPine Script · Machine learning · 30m
- Multi indicator Assisted StrategyPine Script · Machine learning · 1d