Strategy vault / Trend following
Multi Indicator Consensus Trend Trading System Combining Liquidity Weighted Supertrend Trend Signals and Enhanced Wavetrend Oscillator
This strategy is a multi-indicator consensus trading system that optimizes trading decisions by combining three powerful technical indicators: Liquidity-Weighted Supertrend (LWST), a dual moving average trend signal…
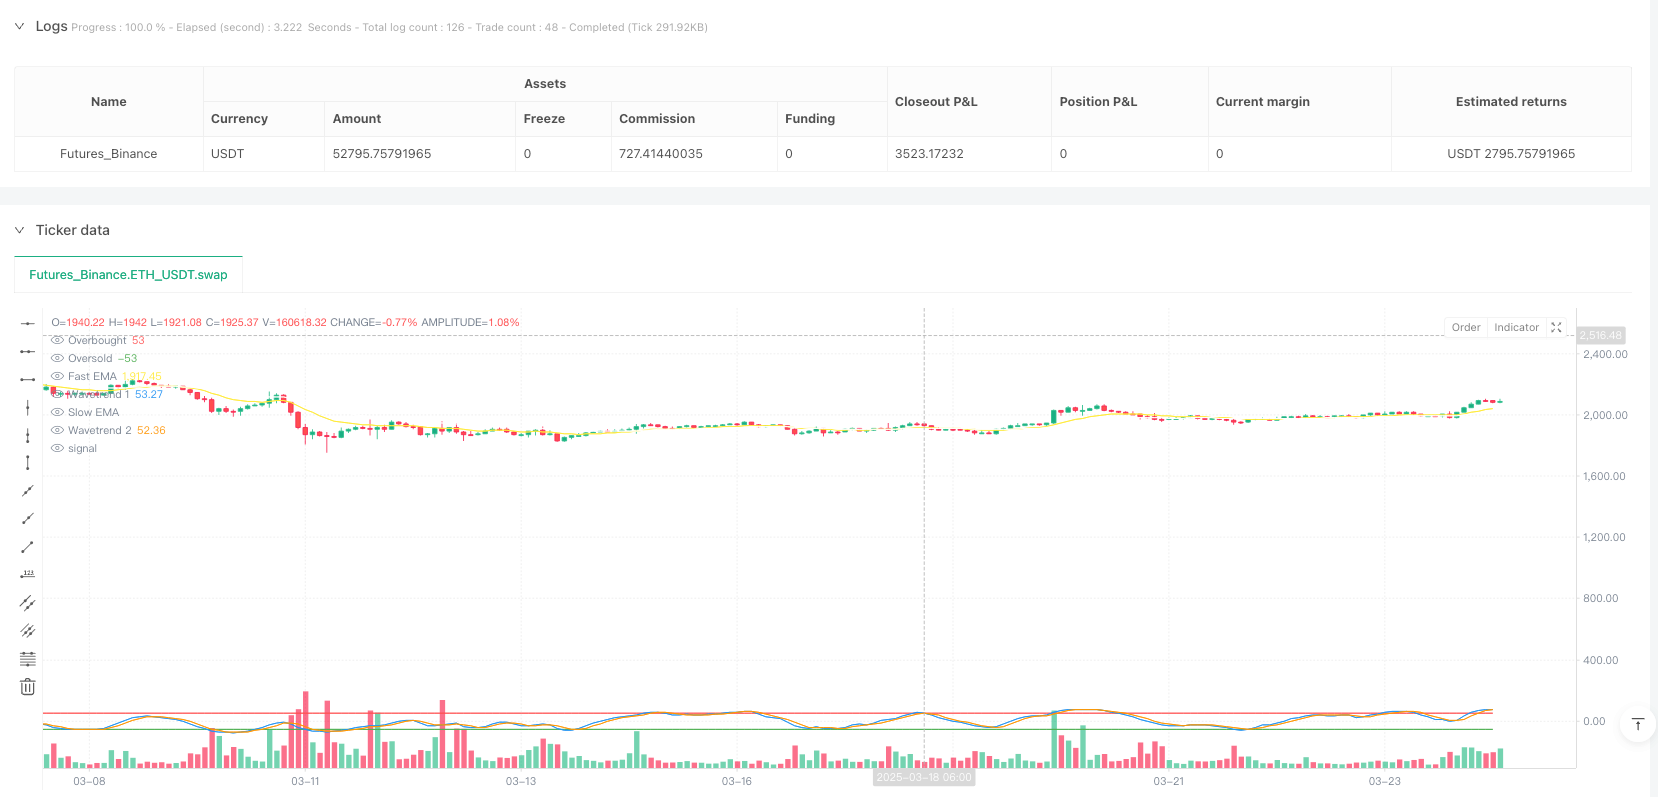
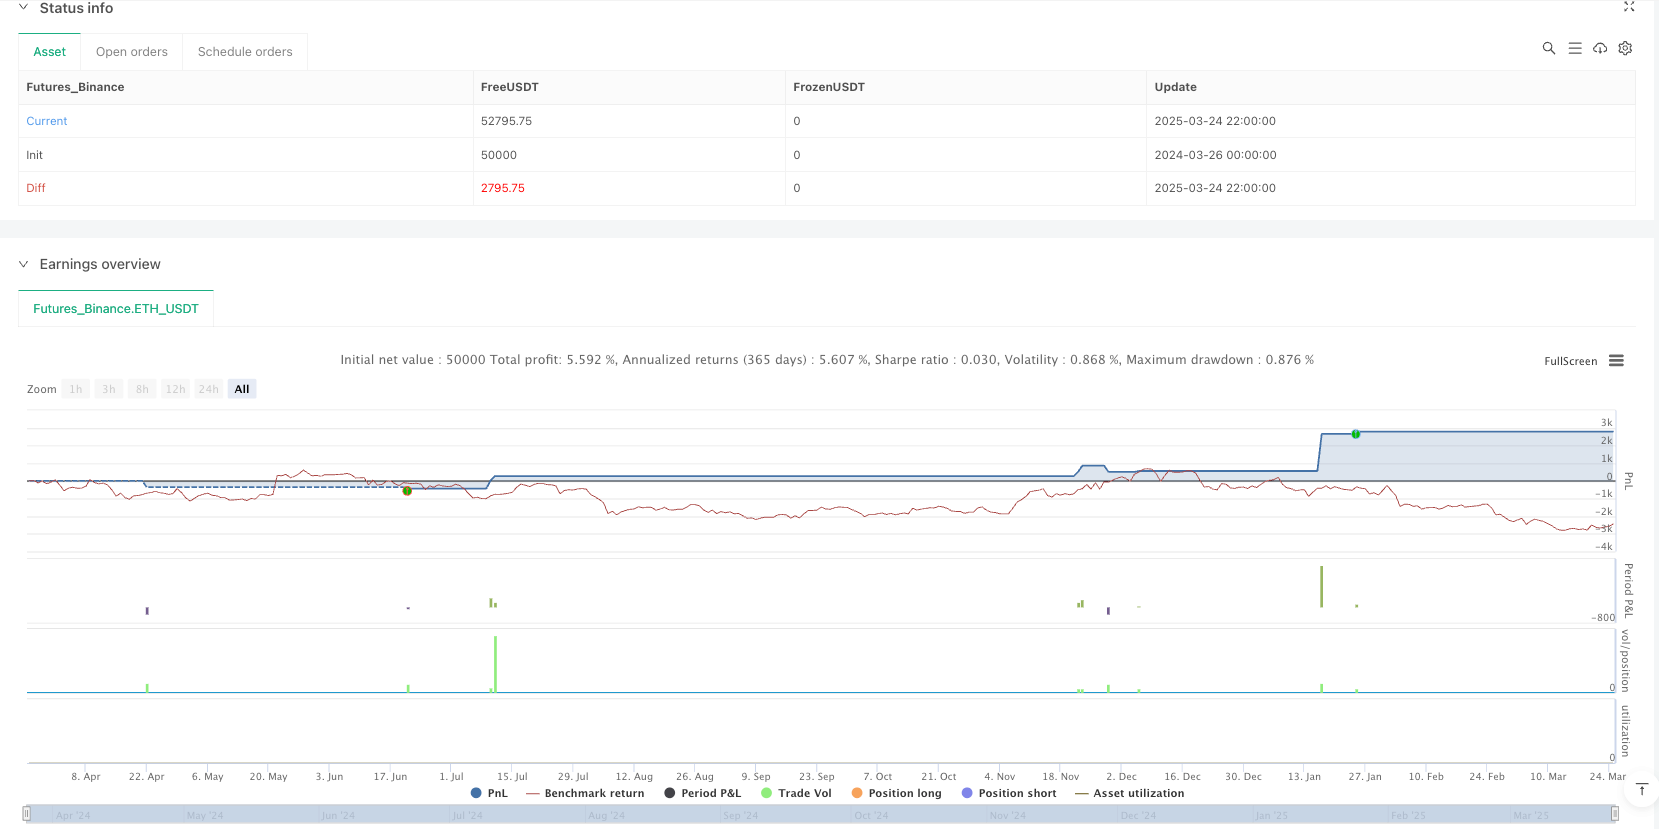
Overview
This strategy is a multi-indicator consensus trading system that optimizes trading decisions by combining three powerful technical indicators: Liquidity-Weighted Supertrend (LWST), a dual moving average trend signal system, and an Enhanced Wavetrend Oscillator. The core concept is to execute trades only when at least two indicators reach consensus, significantly reducing the risk of false signals. The system supports both long and short operations and comes equipped with comprehensive risk management mechanisms, including stop-loss and take-profit functions to protect trading capital.
Strategy Principles
The strategy operates based on three independent but complementary technical indicator systems:
Liquidity-Weighted Supertrend (LWST): This is an innovative improvement to the traditional Supertrend indicator that incorporates market liquidity factors. The system first calculates a simple moving average (SMA) of trading volume, then creates a dynamic liquidity weight using the ratio of current volume to the SMA. This weight is applied to the Average True Range (ATR) calculation to form upper and lower bands. When price breaks through these bands, trend signals are generated, simplified to positive values (1) for uptrends and negative values (-1) for downtrends.
Dual Moving Average Trend Signal System: This system uses two exponential moving averages (EMAs) to identify market trends. It calculates the percentage difference between a fast EMA and a slow EMA (with a period twice that of the fast EMA). When this difference exceeds a user-defined threshold, the system generates corresponding trend signals.
Enhanced Wavetrend Oscillator: This is an oscillator used to identify overbought and oversold market conditions. It is constructed by calculating multiple technical components, including typical price (hlc3), exponential moving averages (EMA), volatility measurements, and final wavetrend indicator values. When the indicator exceeds preset overbought/oversold thresholds, the system generates trading signals.
The core of the strategy is the "consensus mechanism," which counts how many of the three indicators are generating bullish signals. Trades are only executed when at least two indicators reach consensus (i.e., produce signals in the same direction). This greatly reduces the risk of false signals that might occur with a single indicator.
Strategy Advantages
Multiple Confirmation Mechanism: The strategy requires at least two indicators to jointly confirm trading signals, significantly reducing the risk of false signals and improving trading accuracy.
Liquidity Adaptability: By incorporating volume factors into the Supertrend calculation, the strategy can dynamically adjust sensitivity based on market liquidity conditions, making it more adaptable to different market environments.
Comprehensive Market Coverage: The three indicators respectively cover trend following, momentum analysis, and overbought/oversold judgment, analyzing the market from multiple dimensions and providing a more comprehensive market perspective.
Built-in Risk Management: The strategy includes stop-loss and take-profit functions that automatically calculate stop-loss and take-profit levels based on user-defined percentages, effectively controlling the risk of each trade.
Visual Interface: The code implements a detailed graphical interface, including signal markers, indicator lines, and real-time information tables, allowing traders to intuitively understand and monitor the strategy's operation.
High Customizability: The strategy offers multiple parameter setting options, allowing traders to adjust according to their risk preferences and market views, adapting to different trading styles and market conditions.
Strategy Risks
Parameter Sensitivity: Strategy performance is highly dependent on parameter settings. Different market environments may require different parameter combinations, and incorrect parameter settings may lead to overtrading or missed opportunities. To mitigate this risk, it is recommended to conduct thorough backtesting and parameter optimization before live trading.
Market Adaptability Limitations: Despite integrating multiple indicators, the strategy may still perform poorly under certain specific market conditions (such as extreme volatility or range-bound markets). The solution is to add market environment filters to activate the strategy only in suitable market environments.
Signal Delay: Since the strategy depends on multiple indicators reaching consensus, it may cause signal generation delays, missing optimal entry points. This can be balanced by adjusting the parameters of each indicator to balance sensitivity and reliability.
Stop-Loss Risk: Fixed percentage stop-losses may be too tight in highly volatile markets, causing them to be easily triggered. It is recommended to implement dynamic stop-loss mechanisms that automatically adjust stop-loss distances based on market volatility.
Over-reliance on Technical Indicators: The strategy completely relies on technical indicators, ignoring fundamental factors and market sentiment. Consider integrating some fundamental filters or market sentiment indicators to enhance the strategy's robustness.
Strategy Optimization Directions
Adaptive Parameter System: Implement a system that automatically adjusts parameters based on market conditions. For example, automatically adjust ATR multipliers and stop-loss percentages based on market volatility to better adapt to different market environments.
Time Filters: Add trading time filtering functionality to avoid trading during highly volatile periods such as market opening and closing, thereby reducing the impact of false signals.
Weighted Consensus Mechanism: Currently, the consensus mechanism simply counts the signals from the three indicators. A weighted system could be implemented, assigning different weights to each indicator based on their historical performance in different market environments, further improving signal accuracy.
Dynamic Stop-Loss/Take-Profit: Change fixed percentage stop-loss/take-profit to dynamic calculations based on market volatility, such as using ATR multiples to set stop-loss distances, better adapting to actual market volatility.
Market Environment Classification: Add a market environment classification system that categorizes market states as trending, oscillating, or uncertain, and apply different trading strategy parameters or even different trading logic based on different market environments.
Volume Confirmation: Add volume confirmation mechanisms requiring sufficient volume support when trading signals occur, further reducing the risk of false signals.
Summary
The Multi-Indicator Consensus Trend Trading System is a comprehensive trading strategy that integrates Liquidity-Weighted Supertrend, Dual Moving Average Trend Signals, and Enhanced Wavetrend Oscillator. By requiring multiple indicators to reach consensus before executing trades, this strategy significantly improves the reliability of trading signals. Additionally, it incorporates volume factors to dynamically adjust sensitivity based on market liquidity conditions and is equipped with comprehensive risk management mechanisms, providing traders with a relatively comprehensive and robust trading system.
The strategy's main advantages lie in its multiple confirmation mechanisms and liquidity adaptability, but it also faces risks such as parameter sensitivity and potential signal delays. By implementing adaptive parameter systems, weighted consensus mechanisms, and dynamic risk management, the performance and robustness of this strategy can be further enhanced. Overall, this is a well-designed, structurally complete trading system suitable for traders with a certain foundation in technical analysis.
Source Pine Script
/*backtest
start: 2024-03-26 00:00:00
end: 2025-03-25 00:00:00
period: 2h
basePeriod: 2h
exchanges: [{"eid":"Futures_Binance","currency":"ETH_USDT"}]
*/

//@version=5
strategy("Multi-Indicator Consensus Strategy", overlay=true, initial_capital=100000, default_qty_type=strategy.percent_of_equity, default_qty_value=100)

// =================== Input Parameters ===================
// Liquidity Weighted Supertrend
lwst_period      = input.int(10, "LWST Period", minval=1, tooltip="Period for ATR calculation")
lwst_multiplier  = input.float(3.0, "LWST Multiplier", minval=0.1, tooltip="Multiplier for ATR bands")
lwst_length      = input.int(20, "Volume SMA Length", minval=1, tooltip="Length for volume SMA")

// Trend Signals
trend_length     = input.int(14, "Trend Length", minval=1, tooltip="Length for EMA calculation")
trend_threshold  = input.float(0.5, "Trend Threshold", minval=0.1, tooltip="Percentage threshold for trend signals")

// Enhanced Wavetrend
wt_channel_length = input.int(9, "WT Channel Length", minval=1, tooltip="Smoothing period for initial calculations")
wt_average_length = input.int(12, "WT Average Length", minval=1, tooltip="Smoothing period for final signal")
wt_ma_length      = input.int(3, "WT MA Length", minval=1, tooltip="Moving average length for signal line")
wt_overbought     = input.float(53, "WT Overbought", minval=0, tooltip="Level to identify overbought conditions")
wt_oversold       = input.float(-53, "WT Oversold", minval=-100, tooltip="Level to identify oversold conditions")

// Risk Management
sl_percent       = input.float(2.0, "Stop Loss %", minval=0.1, tooltip="Stop loss percentage from entry")
tp_percent       = input.float(4.0, "Take Profit %", minval=0.1, tooltip="Take profit percentage from entry")

// =================== Indicator 1: Liquidity Weighted Supertrend ===================
// Volume-weighted component for dynamic sensitivity
vol_sma    = ta.sma(volume, lwst_length)
vol_weight = volume / vol_sma

// ATR-based bands with volume weighting
atr        = ta.atr(lwst_period)
upperBand  = hl2 + lwst_multiplier * atr * vol_weight
lowerBand  = hl2 - lwst_multiplier * atr * vol_weight

// Trend determination based on price action
var float lwst_trend = 0.0
lwst_trend := close > lwst_trend[1] ? 1 : close < lwst_trend[1] ? -1 : lwst_trend[1]

// =================== Indicator 2: Trend Signals ===================
// Dual EMA system for trend detection
fast_ema    = ta.ema(close, trend_length)
slow_ema    = ta.ema(close, trend_length * 2)
trend_diff  = (fast_ema - slow_ema) / slow_ema * 100
trend_signal = trend_diff > trend_threshold ? 1 : trend_diff < -trend_threshold ? -1 : 0

// =================== Indicator 3: Enhanced Wavetrend ===================
// Calculate Wavetrend components
ap  = hlc3  // Typical price
esa = ta.ema(ap, wt_channel_length)  // Smoothed price
d   = ta.ema(math.abs(ap - esa), wt_channel_length)  // Average volatility
ci  = (ap - esa) / (0.015 * d)  // Base oscillator
tci = ta.ema(ci, wt_average_length)  // Smoothed oscillator

// Generate main and signal lines
wt1 = tci
wt2 = ta.sma(wt1, wt_ma_length)

// Generate Wavetrend Signal based on overbought/oversold conditions
wt_signal = 0
wt_signal := wt1 > wt_overbought and wt2 > wt_overbought ? -1 :
             wt1 < wt_oversold and wt2 < wt_oversold ? 1 :
             wt_signal[1]

// =================== Consensus Signal Generation ===================
// Count bullish signals (1 point for each bullish indicator)
var int consensus_count = 0
consensus_count := (lwst_trend == 1 ? 1 : 0) +
                   (trend_signal == 1 ? 1 : 0) +
                   (wt_signal == 1 ? 1 : 0)

// Generate trading signals when majority (2+ indicators) agree
bool buy_signal  = consensus_count >= 2
bool sell_signal = consensus_count <= -2

// =================== Trade Execution ===================
// Long position entry and exit with risk management
if (buy_signal and strategy.position_size <= 0)
    strategy.entry("Long", strategy.long)
    strategy.exit("Long TP/SL", "Long",
                 profit = close * tp_percent / 100,
                 loss = close * sl_percent / 100)

// Short position entry and exit with risk management
if (sell_signal and strategy.position_size >= 0)
    strategy.entry("Short", strategy.short)
    strategy.exit("Short TP/SL", "Short",
                 profit = close * tp_percent / 100,
                 loss = close * sl_percent / 100)

// =================== Visualization ===================
// Signal markers for entry points
plotshape(buy_signal ? low : na, "Buy Signal", shape.triangleup, location.belowbar, color.green, size=size.small)
plotshape(sell_signal ? high : na, "Sell Signal", shape.triangledown, location.abovebar, color.red, size=size.small)

// Indicator lines
plot(wt1, "Wavetrend 1", color.blue, linewidth=1)
plot(wt2, "Wavetrend 2", color.orange, linewidth=1)
plot(wt_overbought, "Overbought", color.red, linewidth=1)
plot(wt_oversold, "Oversold", color.green, linewidth=1)
plot(fast_ema, "Fast EMA", color.yellow, linewidth=1)
plot(slow_ema, "Slow EMA", color.white, linewidth=1)
plot(lwst_trend == 1 ? upperBand : na, "Upper Band", color.green, linewidth=2)
plot(lwst_trend == -1 ? lowerBand : na, "Lower Band", color.red, linewidth=2)

// =================== Information Table ===================
// Real-time display of indicator signals
var table info = table.new(position.top_right, 2, 4)
table.cell(info, 0, 0, "Indicator", bgcolor=color.gray, text_color=color.white)
table.cell(info, 1, 0, "Signal", bgcolor=color.gray, text_color=color.white)
table.cell(info, 0, 1, "LWST", text_color=color.white)
table.cell(info, 1, 1, str.tostring(lwst_trend), text_color=lwst_trend == 1 ? color.green : color.red)
table.cell(info, 0, 2, "Trend", text_color=color.white)
table.cell(info, 1, 2, str.tostring(trend_signal), text_color=trend_signal == 1 ? color.green : color.red)
table.cell(info, 0, 3, "Wavetrend", text_color=color.white)
table.cell(info, 1, 3, str.tostring(wt_signal), text_color=wt_signal == 1 ? color.green : color.red)
Published by ianzeng123 on the FMZ strategy square · last modified 2025-03-26. Collected in the Quant Trading Vault. Unvalidated research: re-test with your own data and costs before trusting it.
Build this with AgenKit
A spec is not a trading system. Paste this into your coding agent and AgenKit runs a specialist team — architecture, test-first build, risk gates, review — with paper trading on by default.
/agenkit build a production-grade trading bot with a backtest engine, risk controls and paper trading by default from strategies/Multi-Indicator-Consensus-Trend-Trading-System-Combining-Liquidity-Weighted-Supertrend-Trend-Signals-and-Enhanced-Wavetrend-Oscillator.md- npx agenkit install engineering-kit in your project
- Paste the command into your agent and approve each phase
- Get tests, backtest, risk controls and a paper-trading switch
Understand it first
Before you run this, read the lesson behind the idea and how to backtest it honestly. Specs like this one are the survivors of an unknown number of trials; deflate their results accordingly.
Related specs
- Multi Indicator Dynamic Trend Following Strategy Based on EMA and SMAPine Script · Trend following · 1d
- Supertrend Advance StrategyPine Script · Trend following · 5m
- Supertrend and Moving Average Crossover StrategyPine Script · Trend following · 2h
- Trend Following Strategy Based on PMax IndicatorPine Script · Trend following · 5m
- Trend Tracking and Short term Trading Strategy Based on ADX IndicatorPine Script · Trend following · 1d
- Triple Supertrend Ichimoku Cloud Quantitative Trading StrategyPine Script · Trend following · 1d