Strategy vault / Trend following
Multi Indicator Filtered Trading Strategy with Bollinger Bands and Woodies CCI
This strategy is a multi-indicator trading system combining Bollinger Bands, Woodies CCI (Commodity Channel Index), Moving Averages (MA), and On-Balance Volume (OBV). It uses Bollinger Bands to provide market…
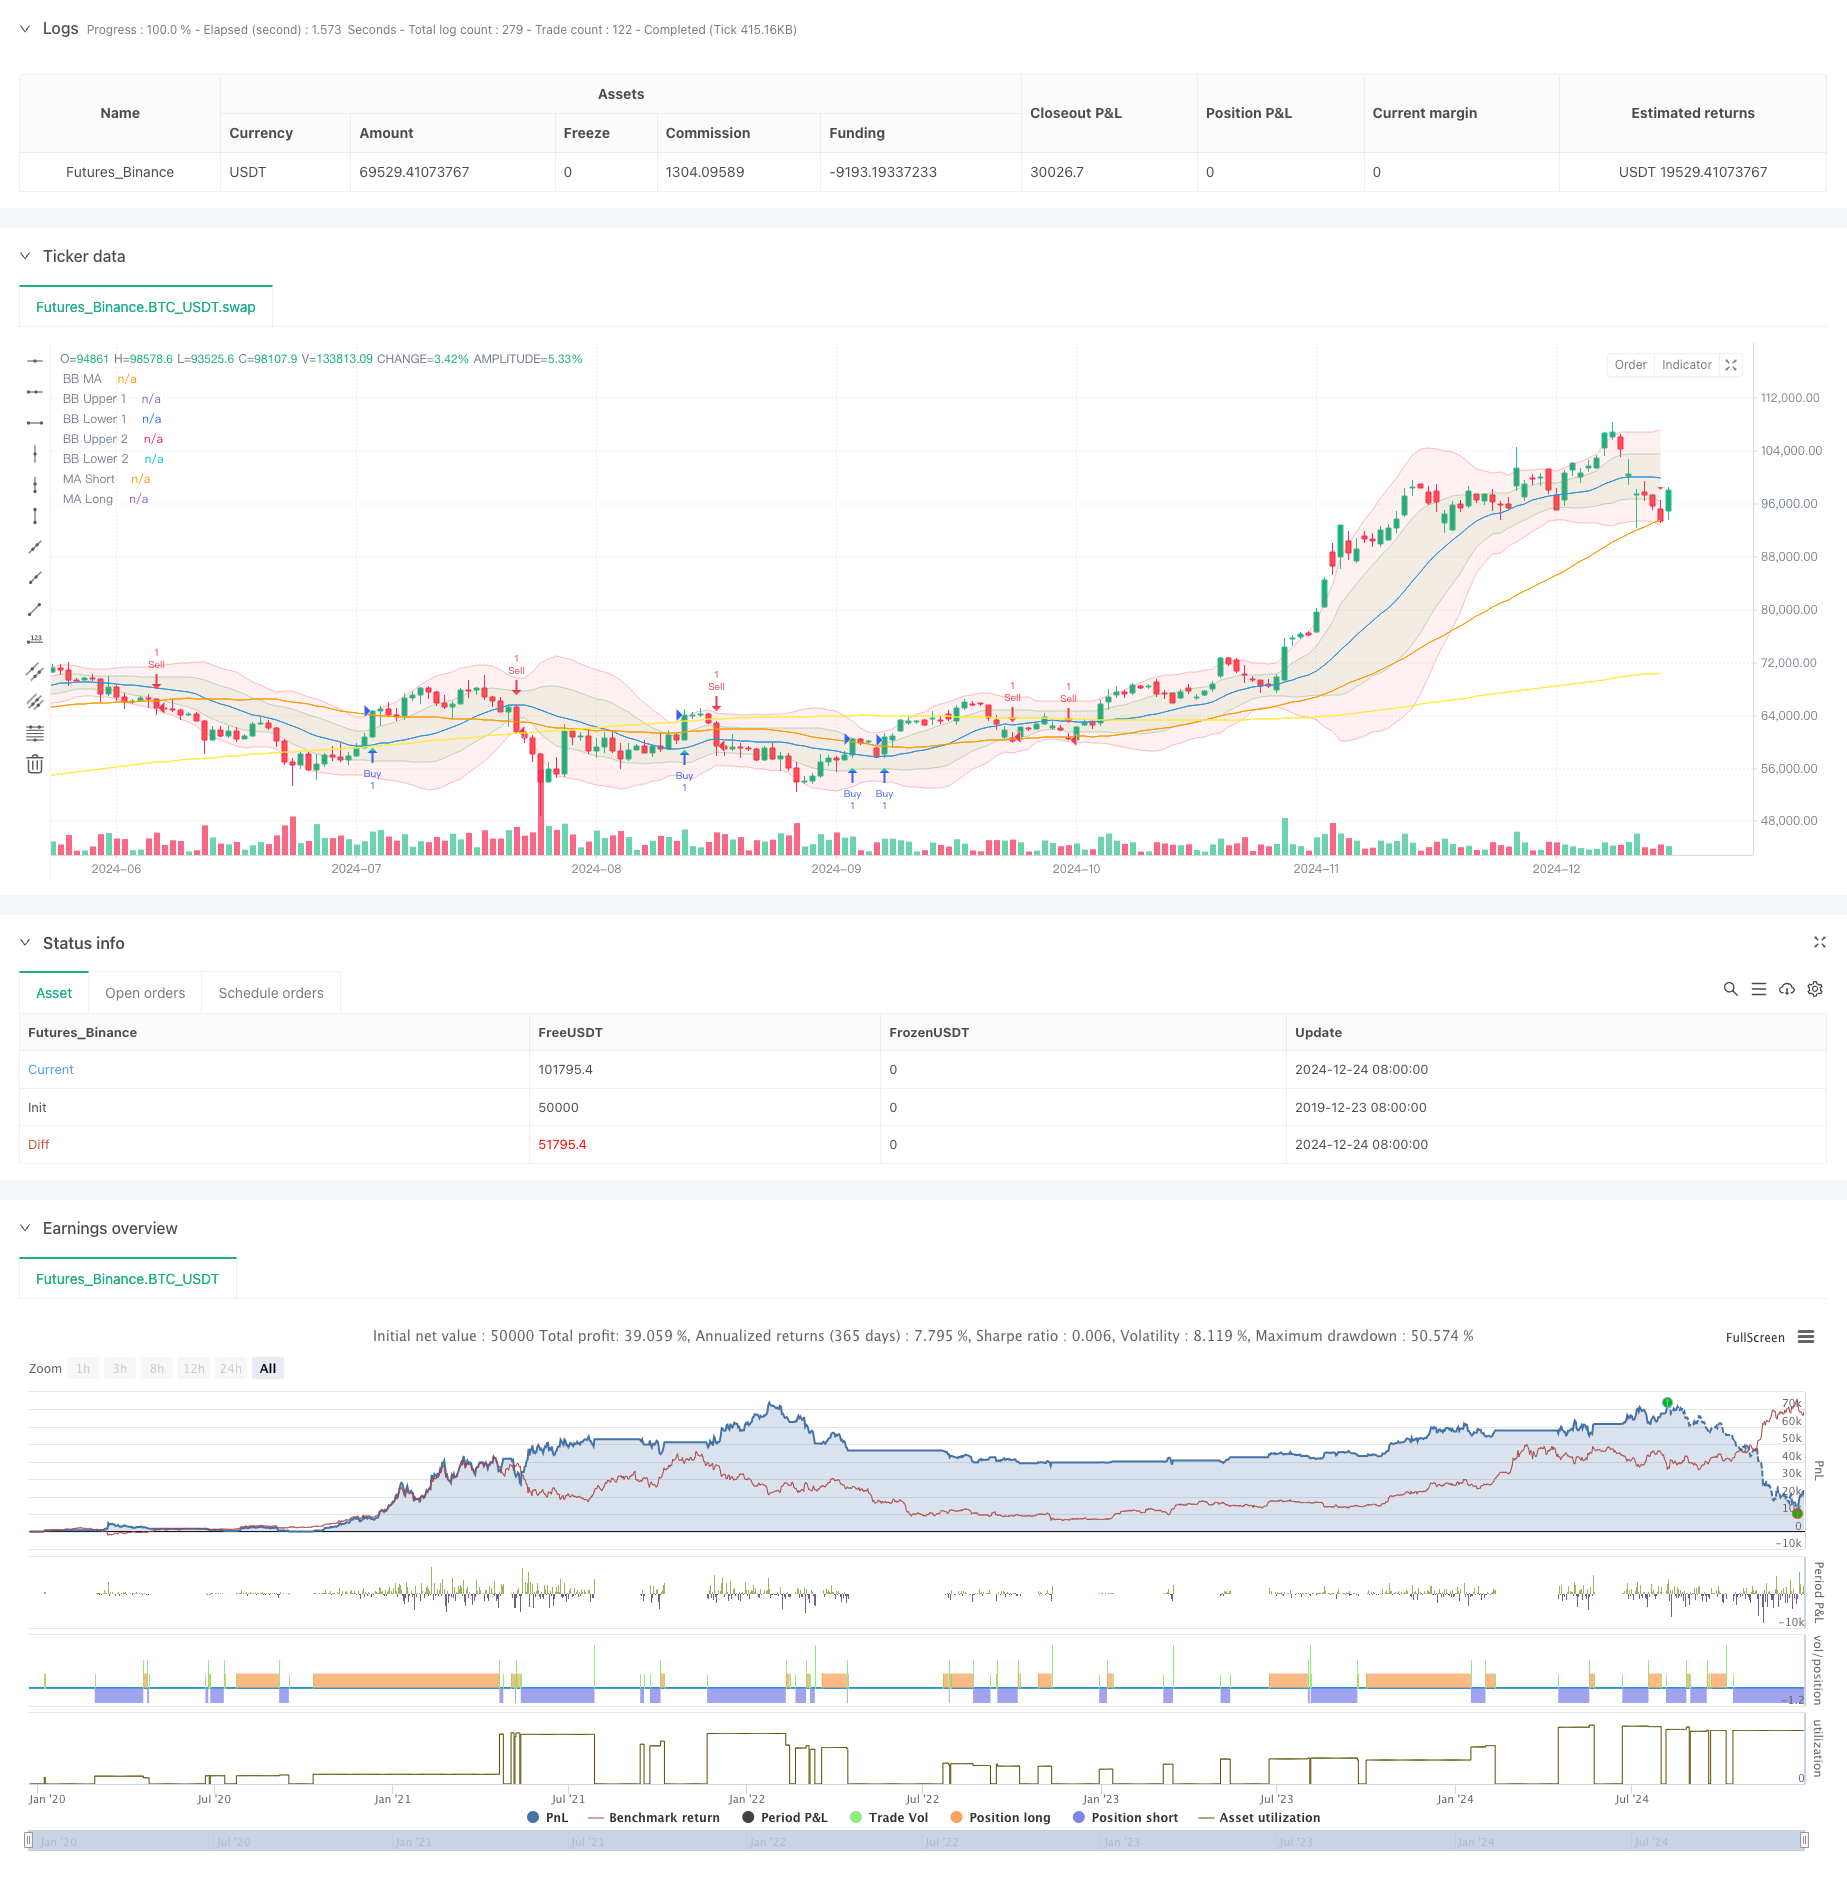
Overview
This strategy is a multi-indicator trading system combining Bollinger Bands, Woodies CCI (Commodity Channel Index), Moving Averages (MA), and On-Balance Volume (OBV). It uses Bollinger Bands to provide market volatility ranges, CCI indicators for signal filtering, and combines MA systems with volume confirmation to execute trades when market trends are clear. Additionally, it employs ATR for dynamic stop-loss and take-profit placement to effectively control risk.
Strategy Principles
The core logic is based on the following key elements:
- Uses two standard deviation Bollinger Bands (1x and 2x) to construct price volatility channels
- Employs 6-period and 14-period CCI indicators as signal filters, requiring confirmation from both periods
- Combines 50-period and 200-period moving averages to determine market trends
- Confirms volume trends through 10-period smoothed OBV
- Uses 14-period ATR for dynamic stop-loss and take-profit levels
Strategy Advantages
- Multiple indicator cross-validation significantly reduces false signals
- Bollinger Bands and CCI combination provides accurate market volatility judgment
- Long and short-term MA systems effectively capture major trends
- OBV confirms volume support, increasing signal reliability
- Dynamic stop-loss and take-profit settings adapt to different market conditions
- Clear trading signals with standardized execution, suitable for quantitative implementation
Strategy Risks
- Multiple indicators may lead to delayed signals
- Frequent stop-losses in ranging markets
- Risk of parameter optimization overfitting
- Stop-losses may not trigger quickly enough in volatile periods Mitigation measures:
- Dynamically adjust indicator parameters for different market cycles
- Monitor drawdown for position control
- Regular parameter validation
- Set maximum loss limits
Optimization Directions
- Introduce volatility indicators to adjust positions in high volatility periods
- Add trend strength filtering to avoid ranging market trades
- Optimize CCI period selection for improved signal sensitivity
- Enhance profit/loss management with partial profit-taking
- Implement volume anomaly warning system
Summary
This is a complete trading system based on technical indicator combinations that improves trading accuracy through multiple signal confirmations. The strategy design is reasonable with proper risk control and has good practical application value. It is recommended to test with conservative positions in live trading and continuously optimize parameters based on market conditions.
Source Pine Script
/*backtest
start: 2019-12-23 08:00:00
end: 2024-12-25 08:00:00
period: 1d
basePeriod: 1d
exchanges: [{"eid":"Futures_Binance","currency":"BTC_USDT"}]
*/

//@version=6
strategy(shorttitle="BB Debug + Woodies CCI Filter", title="Debug Buy/Sell Signals with Woodies CCI Filter", overlay=true)

// Input Parameters
length = input.int(20, minval=1, title="BB MA Length")
src = input.source(close, title="BB Source")
mult1 = input.float(1.0, minval=0.001, maxval=50, title="BB Multiplier 1 (Std Dev 1)")
mult2 = input.float(2.0, minval=0.001, maxval=50, title="BB Multiplier 2 (Std Dev 2)")
ma_length = input.int(50, minval=1, title="MA Length")
ma_long_length = input.int(200, minval=1, title="Long MA Length")
obv_smoothing = input.int(10, minval=1, title="OBV Smoothing Length")
atr_length = input.int(14, minval=1, title="ATR Length") // ATR Length for TP/SL

// Bollinger Bands
basis = ta.sma(src, length)
dev1 = mult1 * ta.stdev(src, length)
dev2 = mult2 * ta.stdev(src, length)

upper_1 = basis + dev1
lower_1 = basis - dev1
upper_2 = basis + dev2
lower_2 = basis - dev2

plot(basis, color=color.blue, title="BB MA")
p1 = plot(upper_1, color=color.new(color.green, 80), title="BB Upper 1")
p2 = plot(lower_1, color=color.new(color.green, 80), title="BB Lower 1")
p3 = plot(upper_2, color=color.new(color.red, 80), title="BB Upper 2")
p4 = plot(lower_2, color=color.new(color.red, 80), title="BB Lower 2")

fill(p1, p2, color=color.new(color.green, 90))
fill(p3, p4, color=color.new(color.red, 90))

// Moving Averages
ma_short = ta.sma(close, ma_length)
ma_long = ta.sma(close, ma_long_length)
plot(ma_short, color=color.orange, title="MA Short")
plot(ma_long, color=color.yellow, title="MA Long")

// OBV and Smoothing
obv = ta.cum(ta.change(close) > 0 ? volume : ta.change(close) < 0 ? -volume : 0)
obv_smooth = ta.sma(obv, obv_smoothing)

// Debugging: Buy/Sell Signals
debugBuy = ta.crossover(close, ma_short)
debugSell = ta.crossunder(close, ma_short)

// Woodies CCI
cciTurboLength = 6
cci14Length = 14
cciTurbo = ta.cci(src, cciTurboLength)
cci14 = ta.cci(src, cci14Length)

// Filter: Only allow trades when CCI confirms the signal
cciBuyFilter = cciTurbo > 0 and cci14 > 0
cciSellFilter = cciTurbo < 0 and cci14 < 0

finalBuySignal = debugBuy and cciBuyFilter
finalSellSignal = debugSell and cciSellFilter

// Plot Debug Buy/Sell Signals
plotshape(finalBuySignal, title="Filtered Buy", location=location.belowbar, color=color.lime, style=shape.triangleup, size=size.normal)
plotshape(finalSellSignal, title="Filtered Sell", location=location.abovebar, color=color.red, style=shape.triangledown, size=size.normal)

// Change candle color based on filtered signals
barcolor(finalBuySignal ? color.lime : finalSellSignal ? color.red : na)

// ATR for Stop Loss and Take Profit
atr = ta.atr(atr_length)
tp_long = close + 2 * atr  // Take Profit for Long = 2x ATR
sl_long = close - 1 * atr  // Stop Loss for Long = 1x ATR
tp_short = close - 2 * atr // Take Profit for Short = 2x ATR
sl_short = close + 1 * atr // Stop Loss for Short = 1x ATR

// Strategy Execution
if (finalBuySignal)
    strategy.entry("Buy", strategy.long)
    strategy.exit("Take Profit/Stop Loss", "Buy", limit=tp_long, stop=sl_long)

if (finalSellSignal)
    strategy.entry("Sell", strategy.short)
    strategy.exit("Take Profit/Stop Loss", "Sell", limit=tp_short, stop=sl_short)

// Check for BTC/USDT pair
isBTCUSDT = syminfo.ticker == "BTCUSDT"

// Add alerts only for BTC/USDT
alertcondition(isBTCUSDT and finalBuySignal, title="BTCUSDT Buy Signal", message="Buy signal detected for BTCUSDT!")
alertcondition(isBTCUSDT and finalSellSignal, title="BTCUSDT Sell Signal", message="Sell signal detected for BTCUSDT!")Published by ChaoZhang on the FMZ strategy square · last modified 2024-12-27. Collected in the Quant Trading Vault. Unvalidated research: re-test with your own data and costs before trusting it.
Build this with AgenKit
A spec is not a trading system. Paste this into your coding agent and AgenKit runs a specialist team — architecture, test-first build, risk gates, review — with paper trading on by default.
/agenkit build a production-grade trading bot with a backtest engine, risk controls and paper trading by default from strategies/Multi-Indicator-Filtered-Trading-Strategy-with-Bollinger-Bands-and-Woodies-CCI.md- npx agenkit install engineering-kit in your project
- Paste the command into your agent and approve each phase
- Get tests, backtest, risk controls and a paper-trading switch
Understand it first
Before you run this, read the lesson behind the idea and how to backtest it honestly. Specs like this one are the survivors of an unknown number of trials; deflate their results accordingly.
Related specs
- Dynamic Moving Average and Bollinger Bands Cross Strategy with Fixed Stop Loss Optimization ModelPine Script · Trend following · 3h
- Relative Volume Trend Following Trading StrategyPine Script · Trend following · 1d
- AlphaTrend Dual Tracking StrategyPine Script · Trend following · 1h
- Five Minute Triple Confirmation Trend Trading Strategy with Risk Management SystemPine Script · Trend following · 1m
- Moving Average Crossover Strategy 430371Pine Script · Trend following · 1h
- Advanced Multi Indicator Trend Confirmation Trading StrategyPine Script · Trend following · 1d