Strategy vault / Trend following
Multi Indicator Optimized KDJ Trend Crossover Strategy Based on Dynamic Stochastic Pattern Trading System
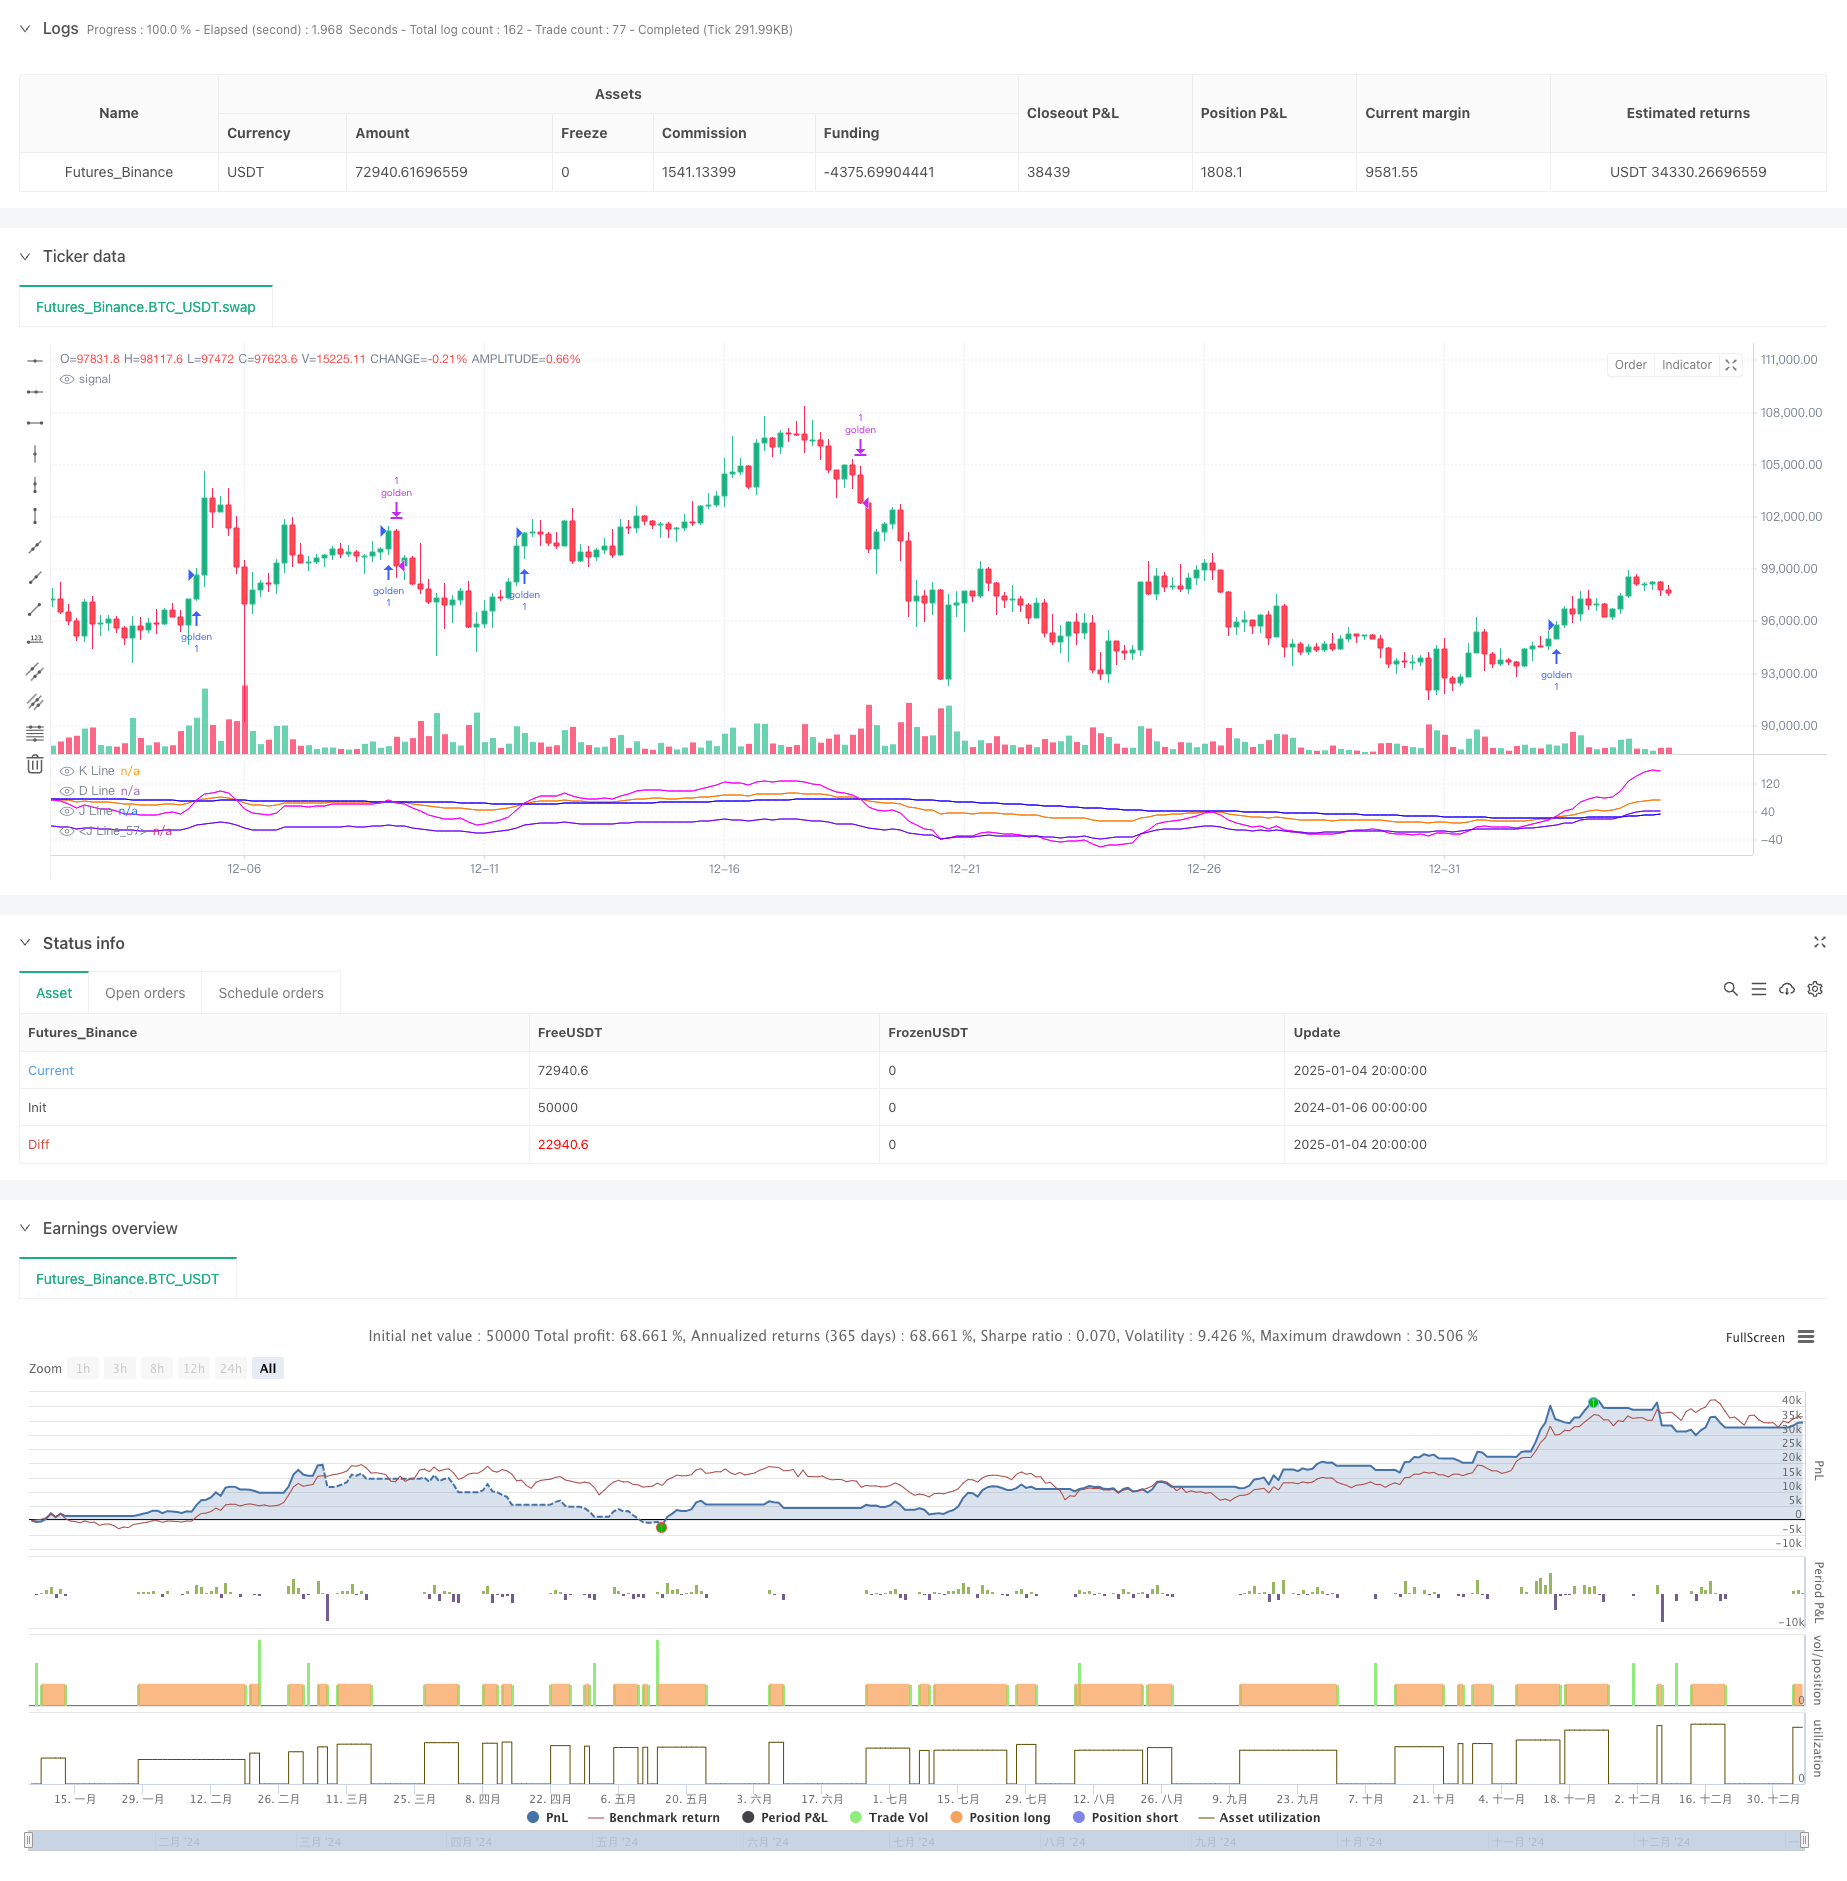
This strategy is an advanced trading system based on the KDJ indicator, which captures market trends through in-depth analysis of K-line, D-line, and J-line crossover patterns. The strategy integrates a custom BCWSMA…
Overview
This strategy is an advanced trading system based on the KDJ indicator, which captures market trends through in-depth analysis of K-line, D-line, and J-line crossover patterns. The strategy integrates a custom BCWSMA smoothing algorithm, improving signal reliability through optimized calculation of stochastic indicators. The system employs strict risk control mechanisms, including stop-loss and trailing stop features, to achieve robust money management.
Strategy Principles
The core logic of the strategy is based on several key elements:
- Uses custom BCWSMA (Weighted Moving Average) algorithm to calculate KDJ indicators, improving indicator smoothness and stability
- Converts prices to 0-100 range through RSV (Raw Stochastic Value) calculation, better reflecting price position between highs and lows
- Designs unique J-line and J5-line (derivative indicator) cross-validation mechanism, improving trade signal accuracy through multiple confirmations
- Establishes trend confirmation mechanism based on continuity, requiring J-line to remain above D-line for 3 consecutive days to confirm trend validity
- Integrates composite risk control system with percentage stop-loss and trailing stop-loss
Strategy Advantages
- Advanced Signal Generation: Significantly reduces false signals through multiple technical indicator cross-validation
- Comprehensive Risk Control: Employs multi-level risk control mechanisms, including fixed and trailing stops, effectively controlling downside risk
- Strong Parameter Adaptability: Key parameters like KDJ period and signal smoothing coefficients can be flexibly adjusted based on market conditions
- High Computational Efficiency: Uses optimized BCWSMA algorithm, reducing computational complexity and improving strategy execution efficiency
- Good Adaptability: Can adapt to different market environments through parameter adjustment optimization
Strategy Risks
- Oscillation Market Risk: May generate frequent false breakout signals in sideways markets, increasing trading costs
- Lag Risk: Signals may experience some delay due to moving average smoothing
- Parameter Sensitivity: Strategy effectiveness is sensitive to parameter settings, improper settings may significantly reduce strategy performance
- Market Environment Dependency: Strategy performance may not be ideal in certain specific market environments
Strategy Optimization Directions
- Signal Filter Mechanism Optimization: Can introduce auxiliary indicators like volume and volatility to improve signal reliability
- Dynamic Parameter Adjustment: Dynamically adjust KDJ parameters and stop-loss parameters based on market volatility
- Market Environment Recognition: Add market environment judgment module to adopt different trading strategies in different market environments
- Risk Control Enhancement: Can add additional risk control measures like maximum drawdown control and position time limits
- Performance Optimization: Further optimize BCWSMA algorithm to improve computational efficiency
Summary
The strategy builds a complete trading system through innovative technical indicator combinations and strict risk control. The core advantages lie in multiple signal confirmation mechanisms and comprehensive risk control systems, but attention needs to be paid to parameter optimization and market environment adaptability. Through continuous optimization and improvement, the strategy has the potential to maintain stable performance across different market environments.
Source Pine Script
/*backtest
start: 2024-01-06 00:00:00
end: 2025-01-05 00:00:00
period: 4h
basePeriod: 4h
exchanges: [{"eid":"Futures_Binance","currency":"BTC_USDT"}]
*/

// This Pine Script™ code is subject to the terms of the Mozilla Public License 2.0 at https://mozilla.org/MPL/2.0/
// © hexu90

//@version=6

// Date Range
// STEP 1. Create inputs that configure the backtest's date range
useDateFilter = input.bool(true, title="Filter Date Range of Backtest",
     group="Backtest Time Period")
backtestStartDate = input(timestamp("1 Jan 2020"),
     title="Start Date", group="Backtest Time Period",
     tooltip="This start date is in the time zone of the exchange " +
     "where the chart's instrument trades. It doesn't use the time " +
     "zone of the chart or of your computer.")
backtestEndDate = input(timestamp("15 Dec 2024"),
     title="End Date", group="Backtest Time Period",
     tooltip="This end date is in the time zone of the exchange " +
     "where the chart's instrument trades. It doesn't use the time " +
     "zone of the chart or of your computer.")
// STEP 2. See if current bar falls inside the date range
inTradeWindow = true

//KDJ strategy
// indicator("My Customized KDJ", shorttitle="KDJ")
strategy("My KDJ Strategy", overlay = false)

// Input parameters
ilong = input(90, title="Period")
k_isig = input(3, title="K Signal")
d_isig = input(30, title="D Signal")

// Custom BCWSMA calculation outside the function
bcwsma(source, length, weight) =>
    var float prev = na  // Persistent variable to store the previous value
    if na(prev)
        prev := source  // Initialize on the first run
    prev := (weight * source + (length - weight) * prev) / length
    prev

// Calculate KDJ
c = close
h = ta.highest(high, ilong)
l = ta.lowest(low, ilong)
RSV = 100 * ((c - l) / (h - l))
pK = bcwsma(RSV, k_isig, 1)
pD = bcwsma(pK, d_isig, 1)
pJ = 3 * pK - 2 * pD

pJ1 = 0
pJ2 = 80
pJ5 = (pJ-pK)-(pK-pD)

// Plot the K, D, J lines with colors
plot(pK, color=color.rgb(251, 121, 8), title="K Line")  // Orange
plot(pD, color=color.rgb(30, 0, 255), title="D Line")  // Blue
plot(pJ, color=color.new(color.rgb(251, 0, 255), 10), title="J Line")  // Pink with transparency
plot(pJ5, color=#6f03f3e6, title="J Line")  // Pink with transparency

// Background color and reference lines
// bgcolor(pJ > pD ? color.new(color.green, 75) : color.new(color.red, 75))
// hline(80, "Upper Band", color=color.gray)
// hline(20, "Lower Band", color=color.gray)

// Variables to track the conditions
var bool condition1_met = false
var int condition2_met = 0

// Condition 1: pJ drops below pJ5
if ta.crossunder(pJ, pJ5)
    condition1_met := true
    condition2_met := 0  // Reset condition 2 if pJ drops below pJ5 again

if ta.crossover(pJ, pD)
    condition2_met += 1

to_long = ta.crossover(pJ, pD)


var int consecutiveDays = 0
// Update the count of consecutive days
if pJ > pD
    consecutiveDays += 1
else
    consecutiveDays := 0

// Check if pJ has been above pD for more than 3 days
consPJacrossPD = false
if consecutiveDays > 3
    consPJacrossPD := true

// Entry condition: After condition 2, pJ crosses above pD a second time
// if condition1_met and condition2_met > 1
//     strategy.entry("golden", strategy.long, qty=1000)
//     condition1_met := false  // Reset the conditions for a new cycle
//     condition2_met = 0
//
if ta.crossover(pJ, pD)
    // and pD < 40 and consPJacrossPD
    // consecutiveDays == 1
    //  consecutiveDays == 3 and
    strategy.entry("golden", strategy.long, qty=1)

// to_short =
// or ta.crossunder(pJ, 100)

// Exit condition
if ta.crossover(pD, pJ)
    strategy.close("golden", qty = 1)

// Stop loss and trailing profit
trail_stop_pct = input.float(0.5, title="Trailing Stop activation (%)", group="Exit Lonng", inline="LTS", tooltip="Trailing Treshold %")
trail_offset_pct = input.float(0.5, title="Trailing Offset (%)", group="Exit Lonng", inline="LTS", tooltip="Trailing Offset %")
trail_stop_tick = trail_stop_pct * close/100
trail_offset_tick = trail_offset_pct * close/100

sl_pct = input.float(5, title="Stop Loss", group="SL and TP", inline="LSLTP")
// tp_pct = input.float(9, title="Take Profit", group="SL and TP", inline="LSLTP")

long_sl_price = strategy.position_avg_price * (1 - sl_pct/100)
// long_tp_price = strategy.position_avg_price * (1 + tp_pct/100)

strategy.exit('golden Exit', 'golden', stop = long_sl_price)
// trail_points = trail_stop_tick, trail_offset=trail_offset_tick
Published by ChaoZhang on the FMZ strategy square · last modified 2025-01-06. Collected in the Quant Trading Vault. Unvalidated research: re-test with your own data and costs before trusting it.
Build this with AgenKit
A spec is not a trading system. Paste this into your coding agent and AgenKit runs a specialist team — architecture, test-first build, risk gates, review — with paper trading on by default.
/agenkit build a production-grade trading bot with a backtest engine, risk controls and paper trading by default from strategies/Multi-Indicator-Optimized-KDJ-Trend-Crossover-Strategy-Based-on-Dynamic-Stochastic-Pattern-Trading-System.md- npx agenkit install engineering-kit in your project
- Paste the command into your agent and approve each phase
- Get tests, backtest, risk controls and a paper-trading switch
Understand it first
Before you run this, read the lesson behind the idea and how to backtest it honestly. Specs like this one are the survivors of an unknown number of trials; deflate their results accordingly.
Related specs
- Adaptive Trading Strategy Based on Stochastic RSI Dual Line CrossoverPine Script · Trend following · 4h
- Dual Moving Average Crossover Strategy with Stop Loss and Take ProfitPine Script · Trend following · 4h
- Dynamic Multi Indicator Trend Recognition Strategy with Triple Sync AnalysisPine Script · Trend following · 1d
- EMA AROON ASHPine Script · Trend following · 3m
- EMA SMA Multi Indicator Comprehensive Trend Following StrategyPine Script · Trend following · 1h
- EMA200 and Stochastic RSI StrategyPine Script · Trend following · 1h