Multi Indicator Trend Breakout Quantitative Trading Strategy
This is a multi-indicator quantitative trading strategy that combines Bollinger Bands, Ichimoku Cloud, and Support/Resistance levels. The strategy identifies potential trading opportunities by analyzing market…
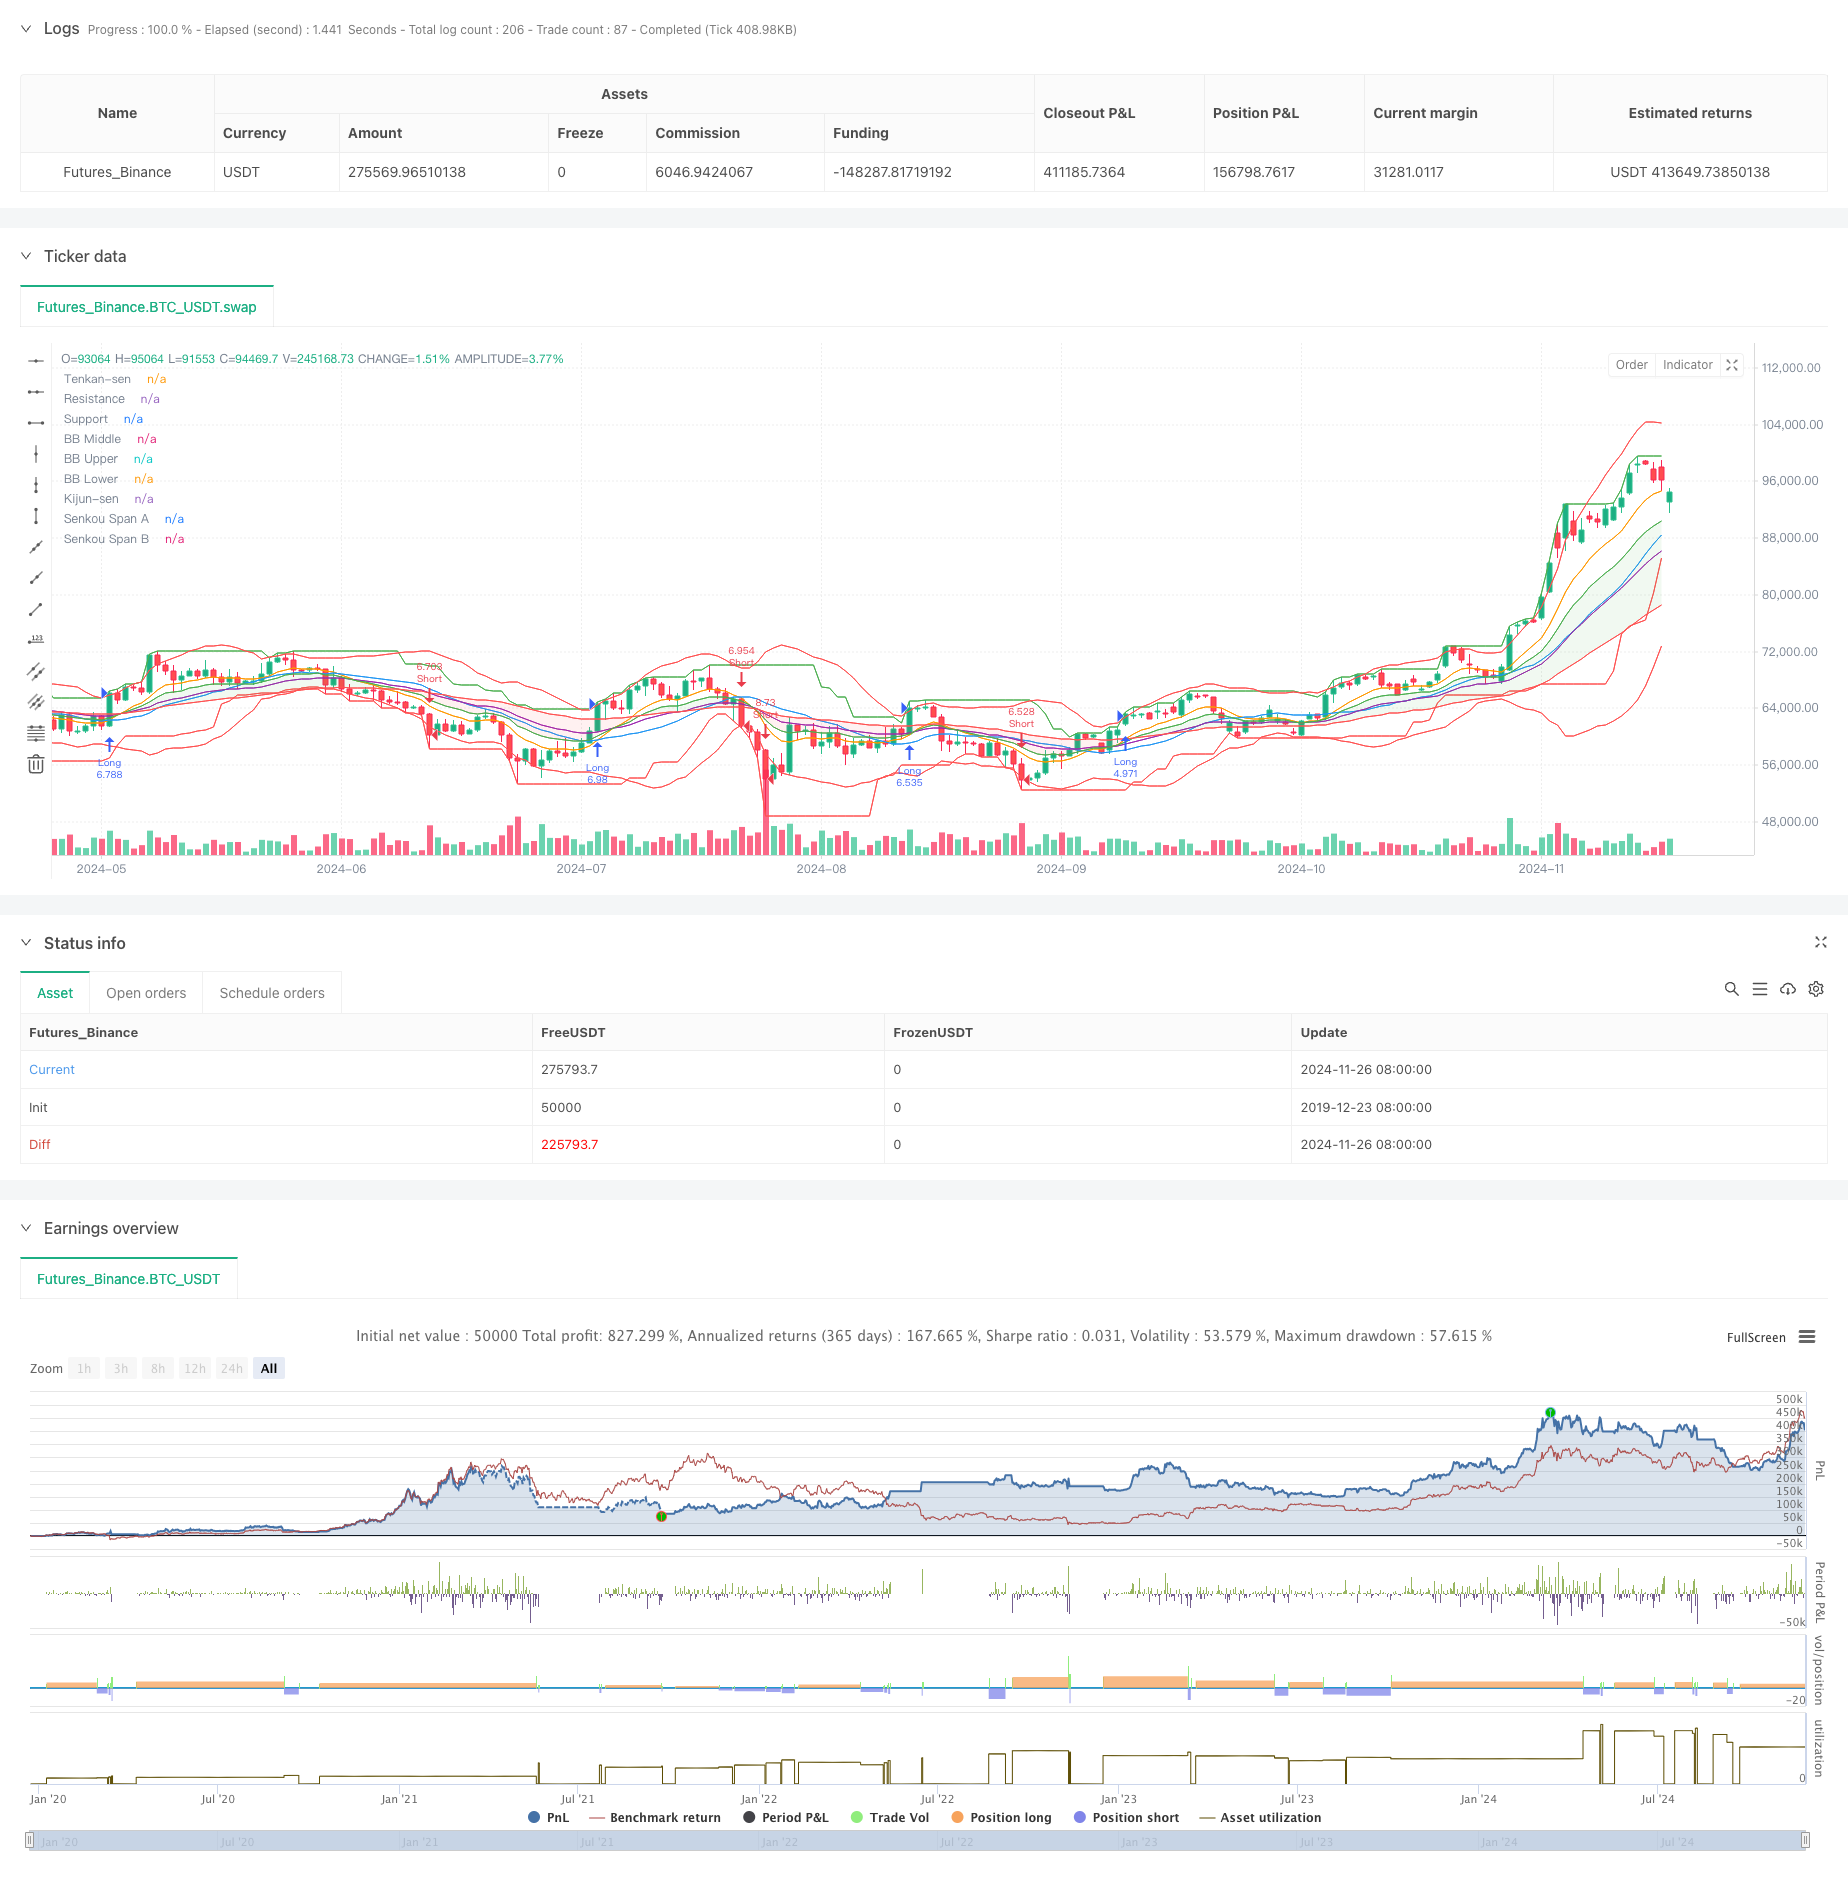
Overview
This is a multi-indicator quantitative trading strategy that combines Bollinger Bands, Ichimoku Cloud, and Support/Resistance levels. The strategy identifies potential trading opportunities by analyzing market volatility, trend strength, and key price levels. It employs precise entry conditions and risk management methods to achieve robust trading performance. The core strength lies in cross-validation through multiple technical indicators to enhance signal reliability.
Strategy Principles
The strategy utilizes three main technical indicator components: Bollinger Bands for measuring market volatility and overbought/oversold conditions; Ichimoku Cloud for evaluating trend direction and strength; Support/Resistance levels for identifying key price levels. The combination of multiple indicators provides a more comprehensive market perspective.
Trade signals are generated based on the following conditions: Long signals are triggered when price breaks above the upper Bollinger Band, positions above the Ichimoku Cloud, and breaks above the previous high; Short signals are triggered when price breaks below the lower Bollinger Band, positions below the Ichimoku Cloud, and breaks below the previous low. The strategy includes percentage-based profit targets and stop losses for risk control.
Strategy Advantages
- Multiple indicator cross-validation improves signal reliability
- Combines benefits of trend following and breakout trading
- Clear risk management mechanism
- Parameters can be flexibly adjusted for different market conditions
- Technical indicator combination reduces false signals
- Complete visualization support aids trading decisions
Strategy Risks
- May generate frequent false breakout signals in ranging markets
- Multiple indicators might lead to lagging signals
- Parameter optimization may result in overfitting
- Stop losses might fail during sharp market movements
- Trading costs may impact strategy returns Risk management recommendations include: adjusting stop loss positions, optimizing parameters, adding filtering conditions, etc.
Optimization Directions
- Add volume analysis indicators to improve signal reliability
- Introduce adaptive parameter adjustment mechanism
- Add market volatility filters
- Optimize profit-taking and stop-loss mechanisms, such as trailing stops
- Add time filtering to avoid trading during specific periods
- Implement drawdown control mechanisms
Conclusion
This is a quantitative trading strategy that comprehensively utilizes multiple technical indicators, capturing trading opportunities through trend breakouts and multiple signal confirmations. The strategy's strengths lie in high signal reliability and robust risk management, but attention must be paid to false breakouts and parameter optimization issues. Through continuous optimization and risk management, the strategy has the potential to maintain stable performance across various market conditions.
Source Pine Script
/*backtest
start: 2019-12-23 08:00:00
end: 2024-11-27 08:00:00
period: 1d
basePeriod: 1d
exchanges: [{"eid":"Futures_Binance","currency":"BTC_USDT"}]
*/

//@version=5
strategy("BB Ichimoku S/R Strategy", overlay=true, initial_capital=10000, default_qty_type=strategy.percent_of_equity, default_qty_value=100)

// Input parameters
bb_length = input.int(20, "Bollinger Bands Length")
bb_mult = input.float(2.0, "Bollinger Bands Multiplier")
ichimoku_tenkan = input.int(9, "Ichimoku Tenkan-sen")
ichimoku_kijun = input.int(26, "Ichimoku Kijun-sen")
ichimoku_senkou = input.int(52, "Ichimoku Senkou Span B")
sr_lookback = input.int(14, "S/R Lookback Period")
profit_target = input.float(1.5, "Profit Target (%)", minval=0.1, step=0.1)
stop_loss = input.float(1.0, "Stop Loss (%)", minval=0.1, step=0.1)

// Bollinger Bands
[bb_middle, bb_upper, bb_lower] = ta.bb(close, bb_length, bb_mult)

// Ichimoku Cloud
tenkan = ta.ema(hl2, ichimoku_tenkan)
kijun = ta.ema(hl2, ichimoku_kijun)
spanA = (tenkan + kijun) / 2
spanB = ta.ema(hl2, ichimoku_senkou)

// Support and Resistance
highest_high = ta.highest(high, sr_lookback)
lowest_low = ta.lowest(low, sr_lookback)

// Entry conditions
long_condition = close > bb_upper and close > spanA and close > spanB and close > highest_high[1]
short_condition = close < bb_lower and close < spanA and close < spanB and close < lowest_low[1]

// Execute trades
if (long_condition)
    strategy.entry("Long", strategy.long)

if (short_condition)
    strategy.entry("Short", strategy.short)

// Set profit target and stop loss
strategy.exit("TP/SL", "Long", profit=strategy.position_avg_price * (1 + profit_target / 100), loss=strategy.position_avg_price * (1 - stop_loss / 100))
strategy.exit("TP/SL", "Short", profit=strategy.position_avg_price * (1 - profit_target / 100), loss=strategy.position_avg_price * (1 + stop_loss / 100))

// Plot indicators
plot(bb_middle, color=color.blue, title="BB Middle")
plot(bb_upper, color=color.red, title="BB Upper")
plot(bb_lower, color=color.red, title="BB Lower")
plot(tenkan, color=color.orange, title="Tenkan-sen")
plot(kijun, color=color.purple, title="Kijun-sen")
spanA_plot = plot(spanA, color=color.green, title="Senkou Span A")
spanB_plot = plot(spanB, color=color.red, title="Senkou Span B")
plot(highest_high, color=color.green, title="Resistance")
plot(lowest_low, color=color.red, title="Support")

// Fill Ichimoku Cloud
fill(spanA_plot, spanB_plot, color=spanA > spanB ? color.rgb(76, 175, 80, 90) : color.rgb(255, 82, 82, 90))Published by ChaoZhang on the FMZ strategy square · last modified 2024-11-29. Collected in the Quant Trading Vault. Unvalidated research: re-test with your own data and costs before trusting it.
Build this with AgenKit
A spec is not a trading system. Paste this into your coding agent and AgenKit runs a specialist team — architecture, test-first build, risk gates, review — with paper trading on by default.
/agenkit build a production-grade trading bot with a backtest engine, risk controls and paper trading by default from strategies/Multi-Indicator-Trend-Breakout-Quantitative-Trading-Strategy.md- npx agenkit install engineering-kit in your project
- Paste the command into your agent and approve each phase
- Get tests, backtest, risk controls and a paper-trading switch
Understand it first
Before you run this, read the lesson behind the idea and how to backtest it honestly. Specs like this one are the survivors of an unknown number of trials; deflate their results accordingly.
Related specs
- Momentum Breakout Moving Average StrategyPine Script · Breakout · 1d
- Moving Average Crossover and Upper Rail Breakthrough Impulse StrategyPine Script · Breakout · 1m
- Multi Indicator Short Term Algorithmic Trading StrategyPine Script · Breakout · 4h
- Quantitative Trading Strategy Based on Ichimoku with Multiple SignalsPine Script · Breakout · 1h
- Bollinger Bands Breakout Strategy 442259Pine Script · Breakout · 1h
- Honey Trend ATR Breakout StrategyPine Script · Breakout · 1h